
COVID-19 Regional Numbers of Dead People
fit with advanced Gompertz function
with Advanced Gompertz Function
All the fits of the data of individual areas are created fully automatically. You may check on the graph (click on the image) if the fit has a sufficient quality, matching the data points as best as possible. There may be some cases, where by too unexpected real data, the fit is not giving a good forecast. So please use common sense to evaluate the data.
Locations or countries with not enough data points or other reasons are skipped and can be found in this list.
The table shows from the left: The maximum last cumulative number, the expected maximum number by fit, graph and location, the T2 also known as doubling time of the exponential growth, the day of turning point of the function.
The turning point is important, showing the turn from purely exponential growth to the process of fading out by limited number of victims.
In the middle of the graph is written the doubling time, that describes the time it needs to double the number of cases. This number is calculated using the logistic function and describes the growth before the turning point, where numbers rise quickly. In a simple picture, the T2 of the Gompertz function describes the later part and the doubling time of the logisitic the first part.
Color code on numbers of dead people: Below 30 , between 30 and 99, between 100 and 499, between 500 and 999, between 1000 and 4999, above 5000.
Color code on locations describe percentages of last number and expected Nmax: Above 95%, between 90% and 95%, between 80% and 89%, between 70% and 79%, between 60% and 69%, when number of cases is above 50 and Nmax is below 50% or the doubling time is below 3.5 days! Above 130%, a reoccurrence of an outbreak is indicated.
The location color code tells you, how well the Covid-19 outbreak has faded out and is under control (greenish). In red and magenta the areas are on fast rise in numbers. The color code in numbers tells you how severe the outbreak was in that region.
Applied maths is explained here.
If you like to support my work:
 (by click on image you accept third party cookies, required by paypal)
For old broad desktop overview, follow this link.
Actualisation date: Sun Aug 15 04:17:24 UTC 2021
| Ncurrent location |
Nmax (err) | cumulative_dead | death rate (err) | death_rate | deaths_daily | T2 (err) | dturning_point (err) |
| 1062641 South America, South America | 1805616 (±3.4%) | 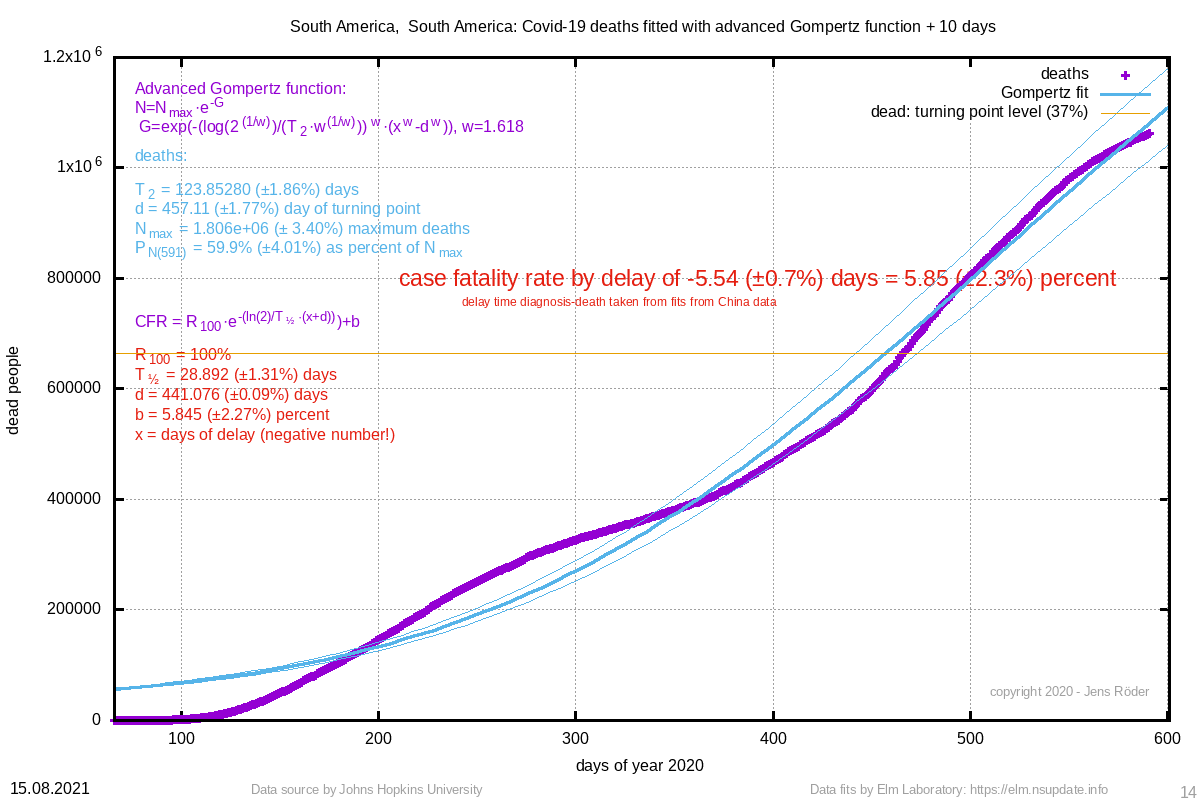 | 5.85 (±2.3%) | 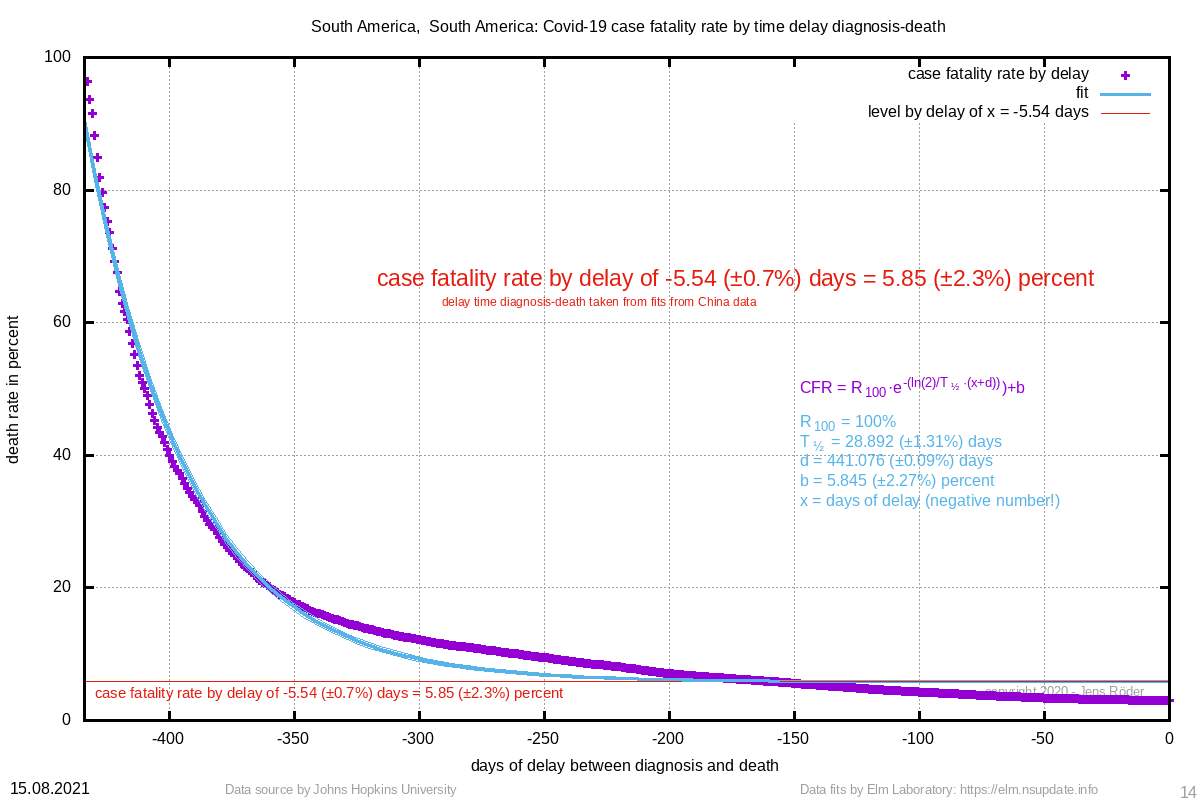 | 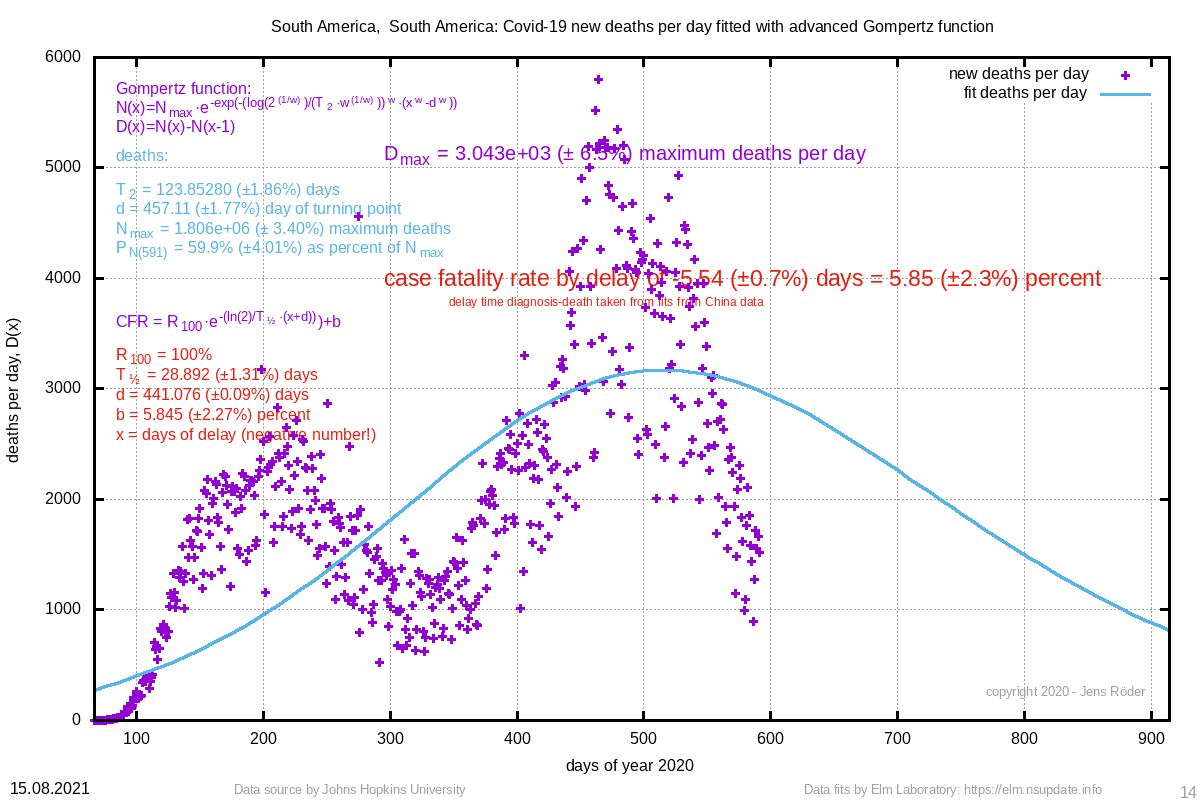 | 123.853 (±1.9%) | 457.11 (±1.8%) |
| 940090 North America, North America | 1047422 (±0.8%) | 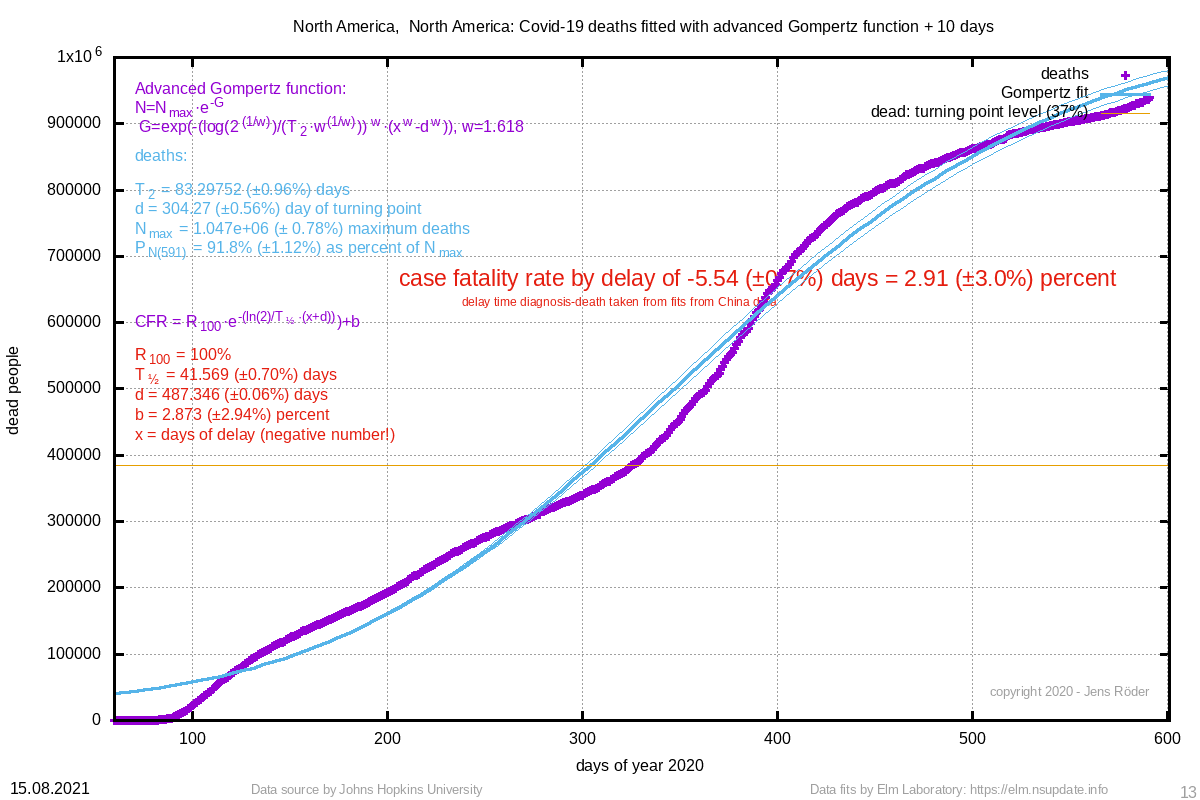 | 2.91 (±3.0%) | 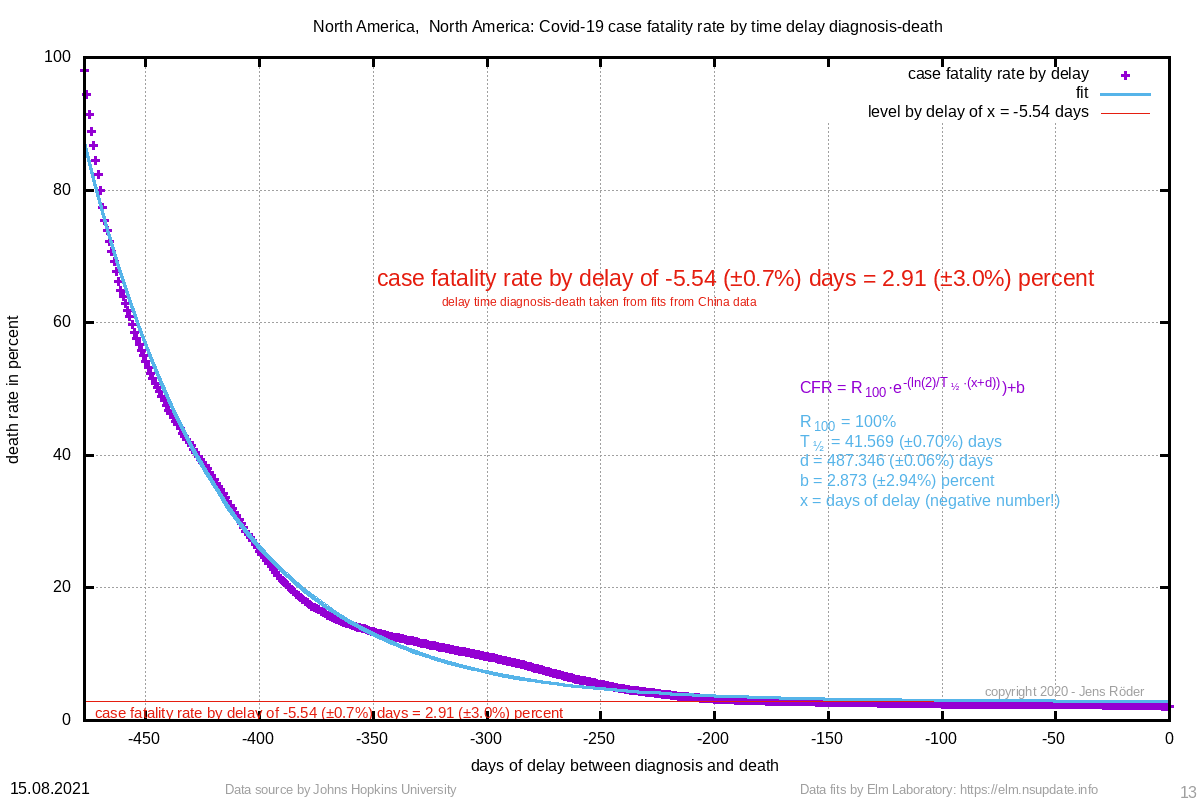 | 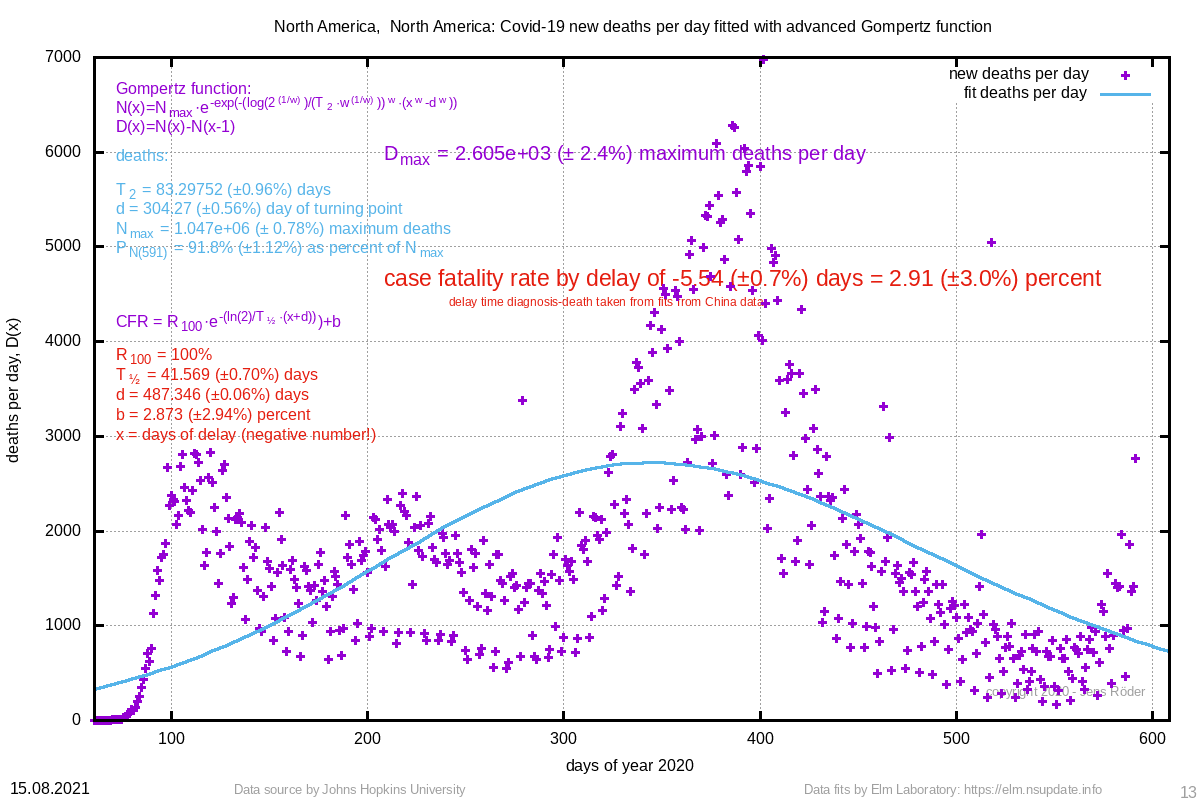 | 83.298 (±1.0%) | 304.27 (±0.6%) |
| 567862 Brazil | 1230322 (±4.9%) | 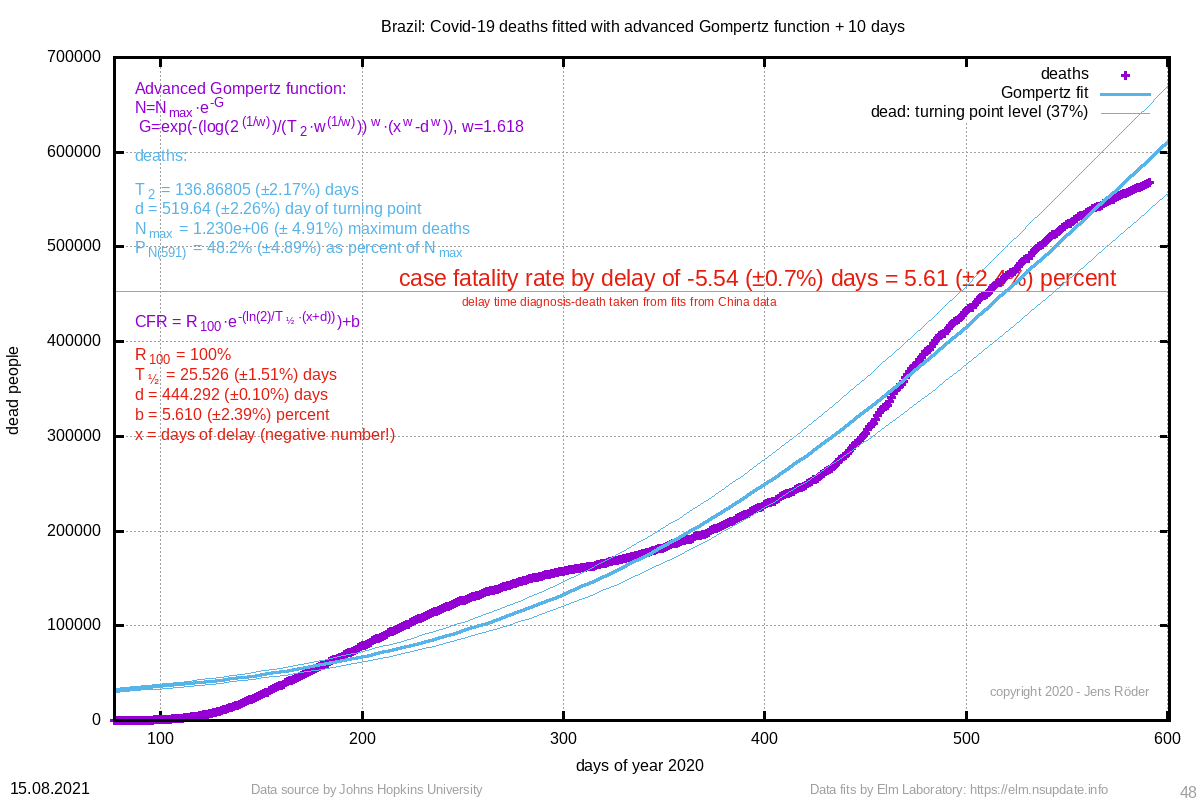 | 5.61 (±2.4%) | 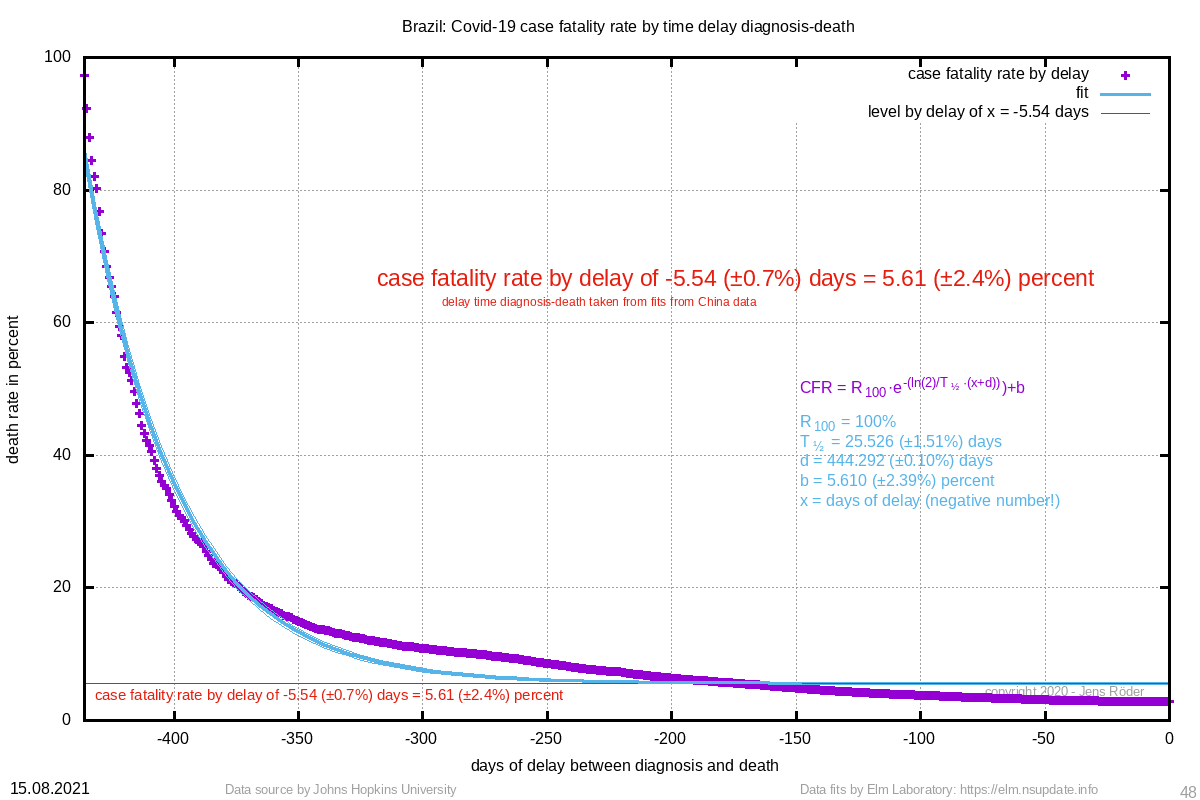 |  | 136.868 (±2.2%) | 519.64 (±2.3%) |
| 502121 South Asia, South Asia | 4400004 (±30.5%) | 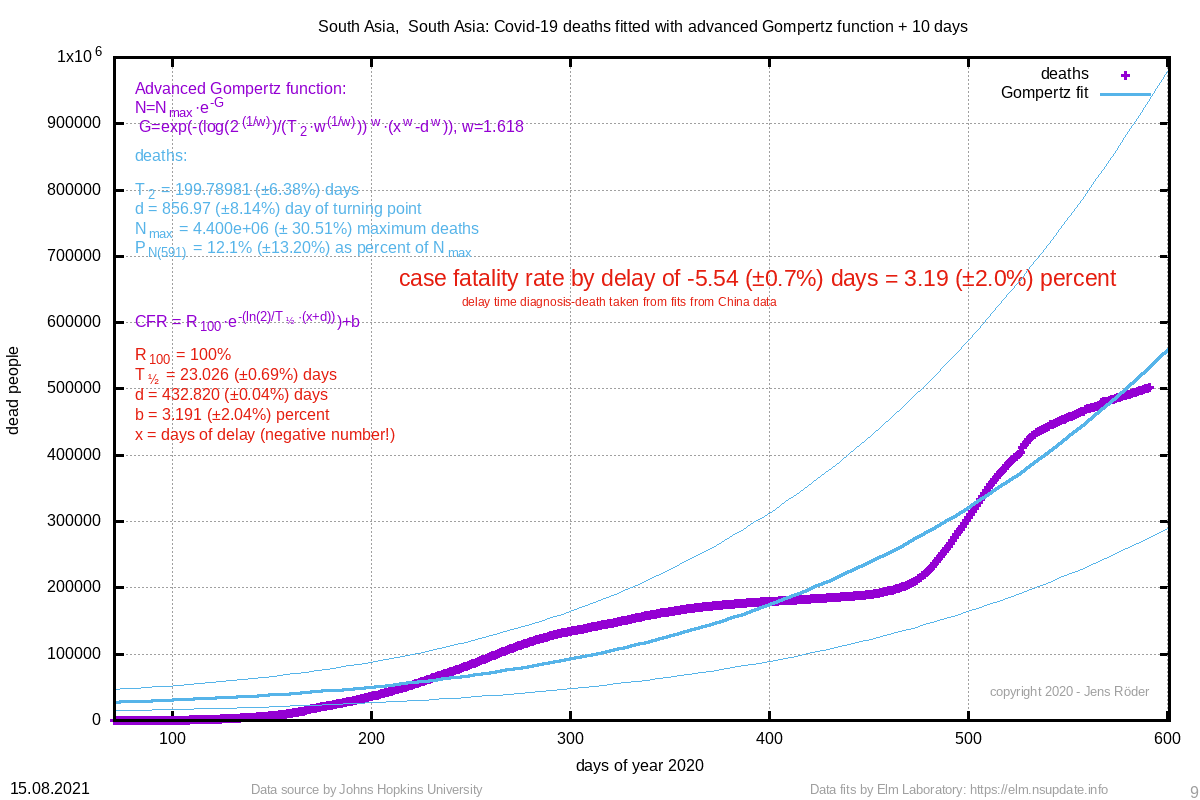 | 3.19 (±2.0%) | 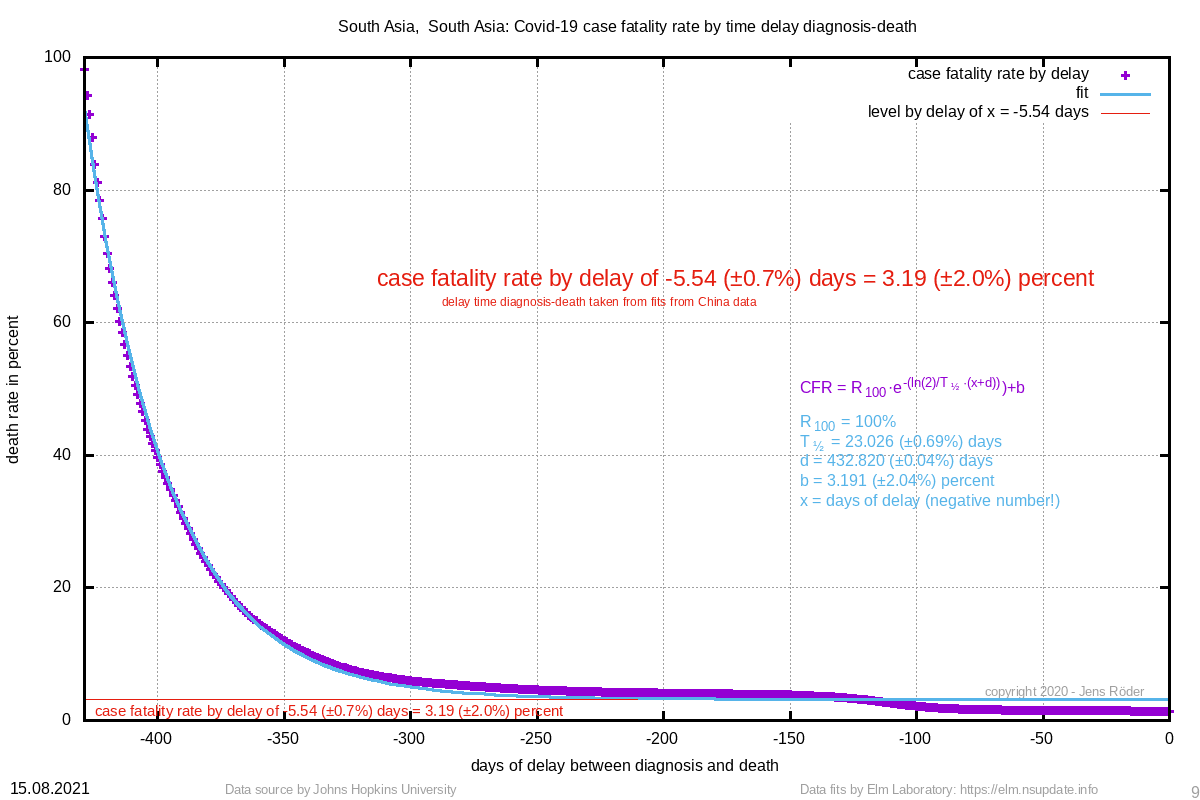 | 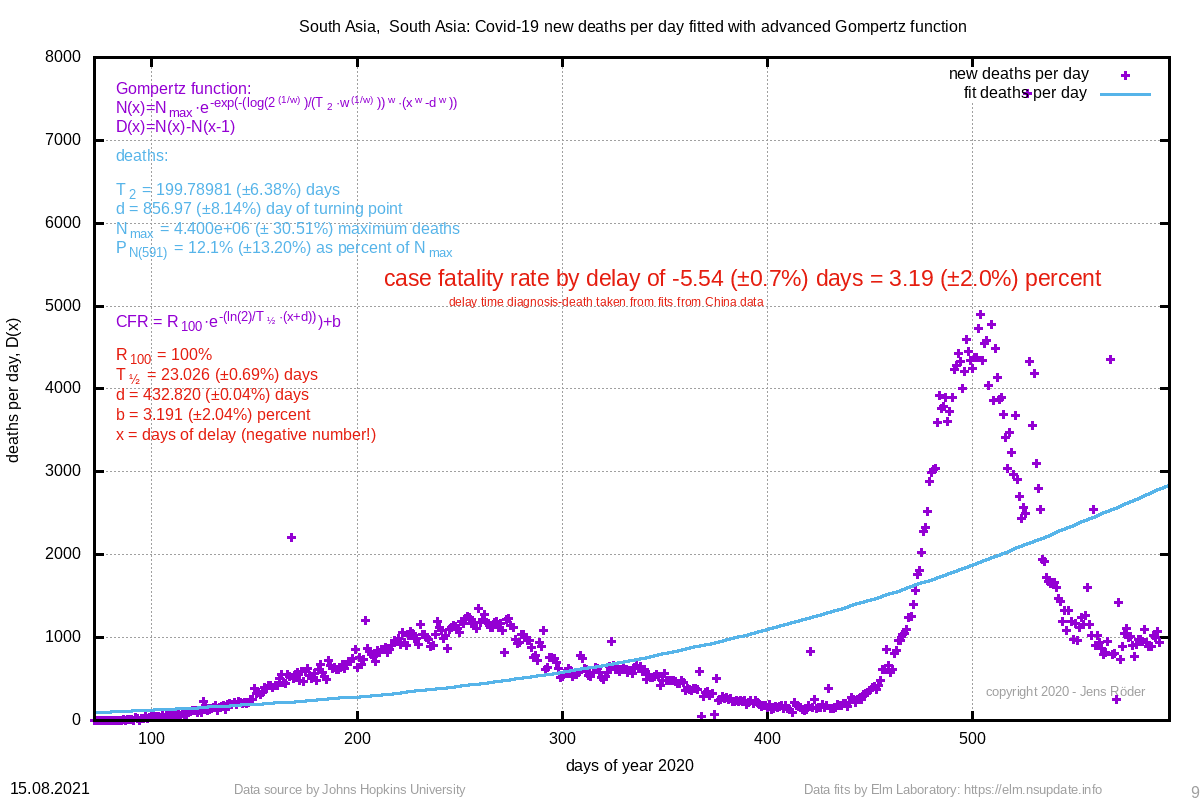 | 199.790 (±6.4%) | 856.97 (±8.1%) |
| 225663 East Europe, East Europe | 278892 (±0.6%) | 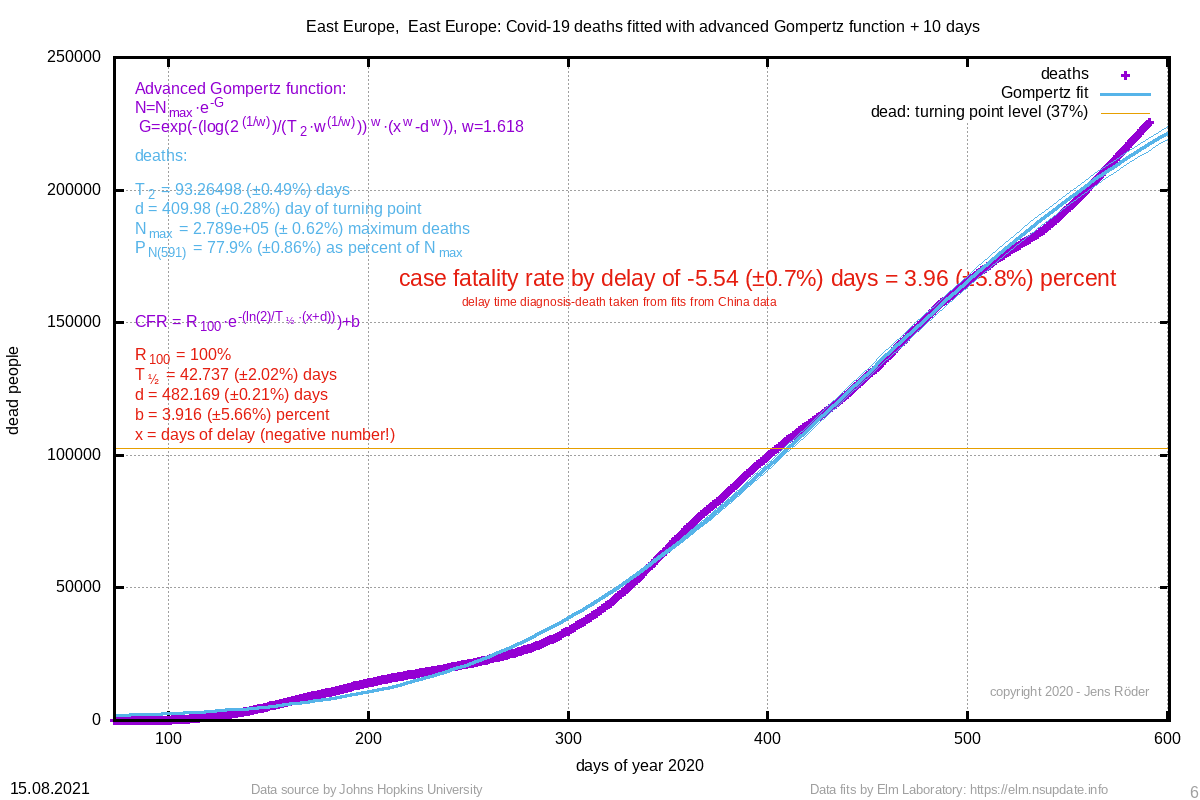 | 3.96 (±5.8%) |  | 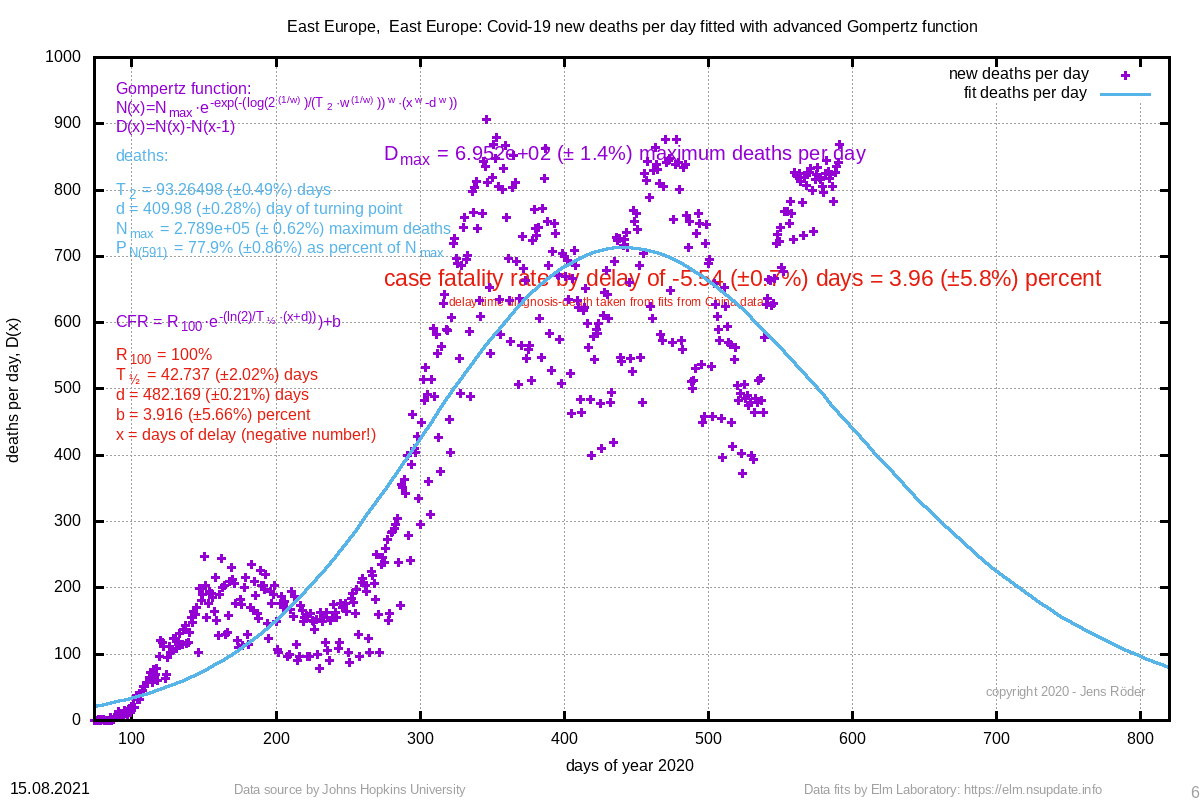 | 93.265 (±0.5%) | 409.98 (±0.3%) |
| 215962 Middle East, Middle East | 240270 (±0.7%) | 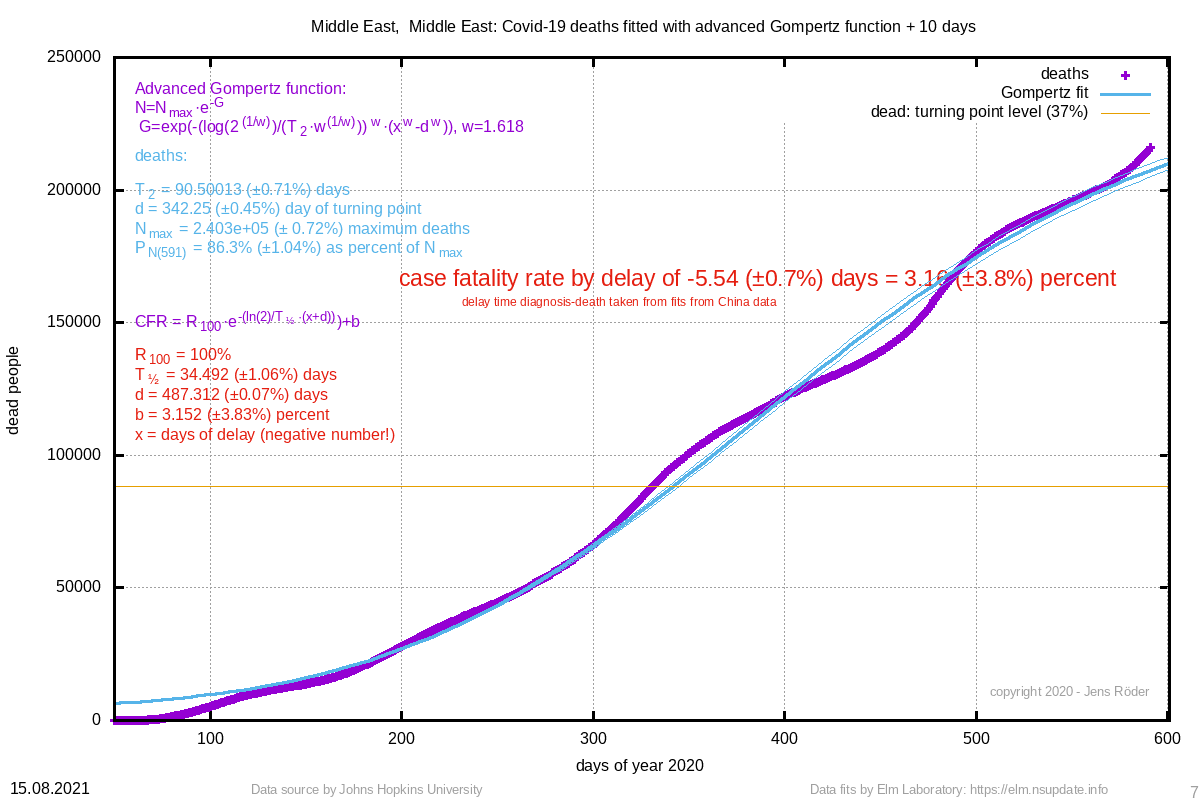 | 3.16 (±3.8%) | 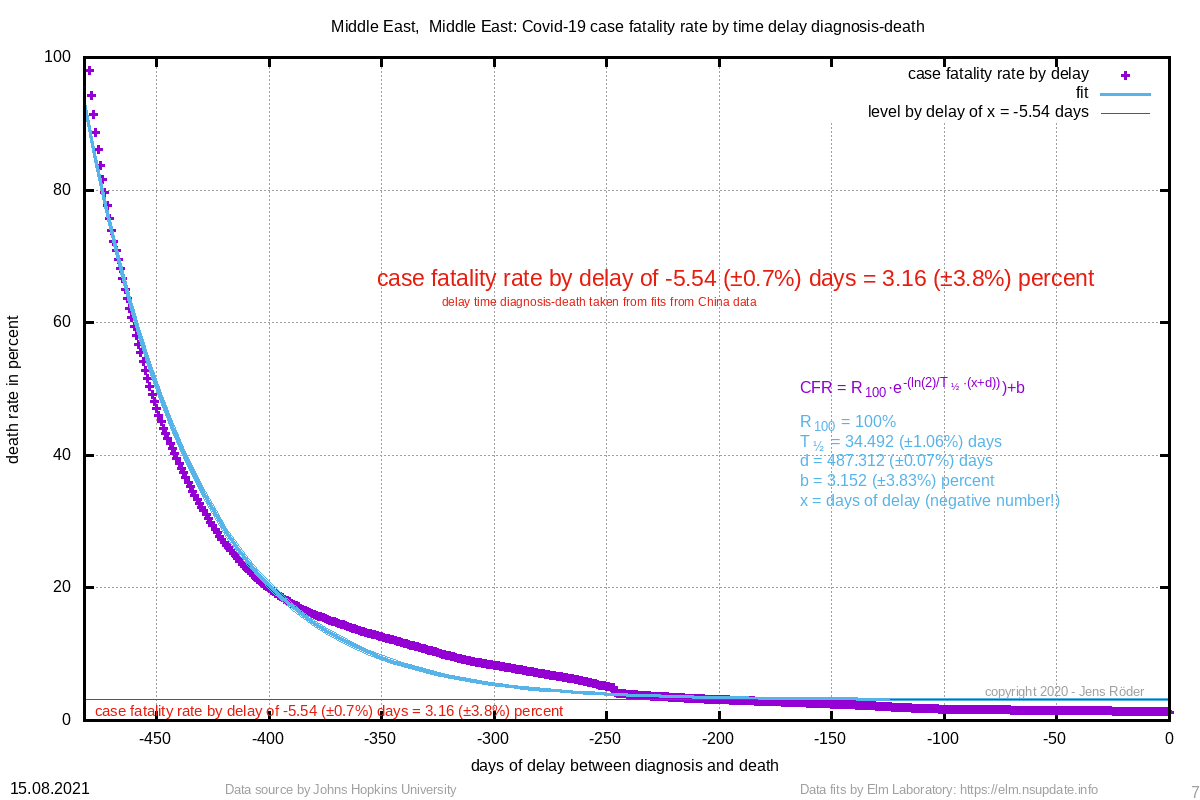 |  | 90.500 (±0.7%) | 342.25 (±0.4%) |
| 181879 Africa, Africa | 197583 (±1.3%) | 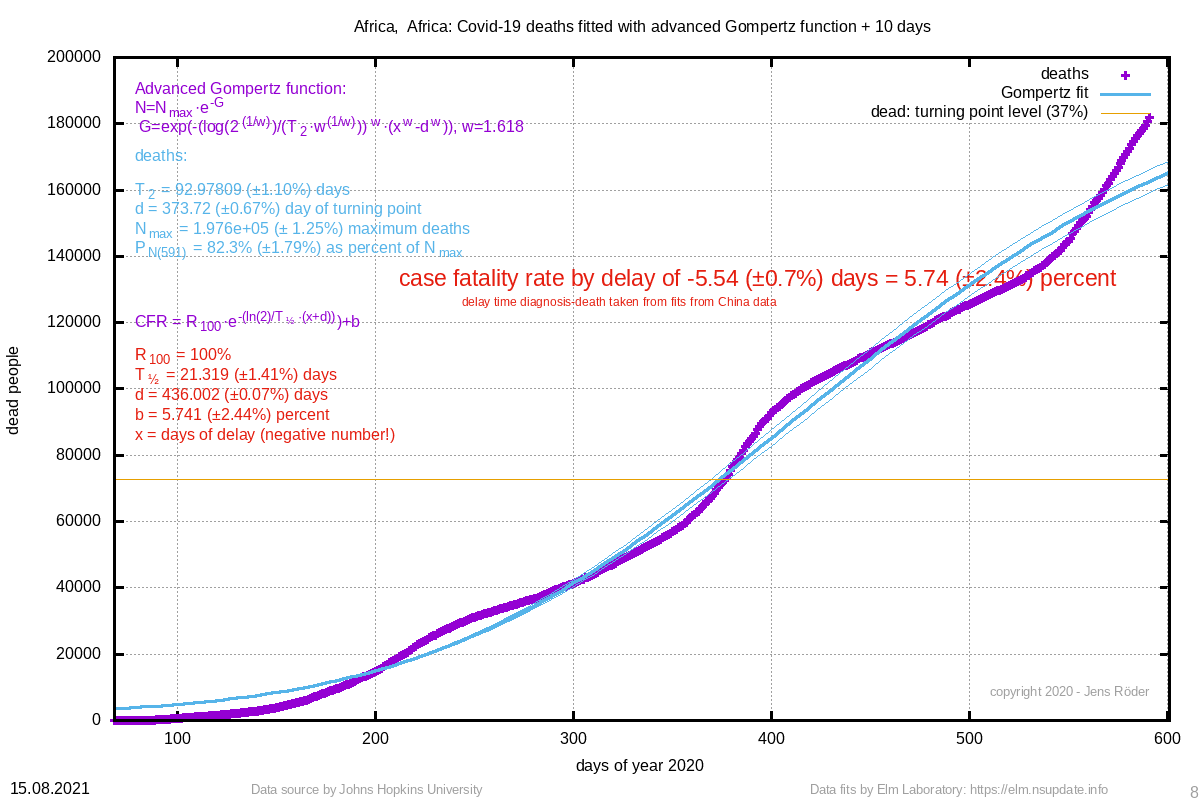 | 5.74 (±2.4%) |  | 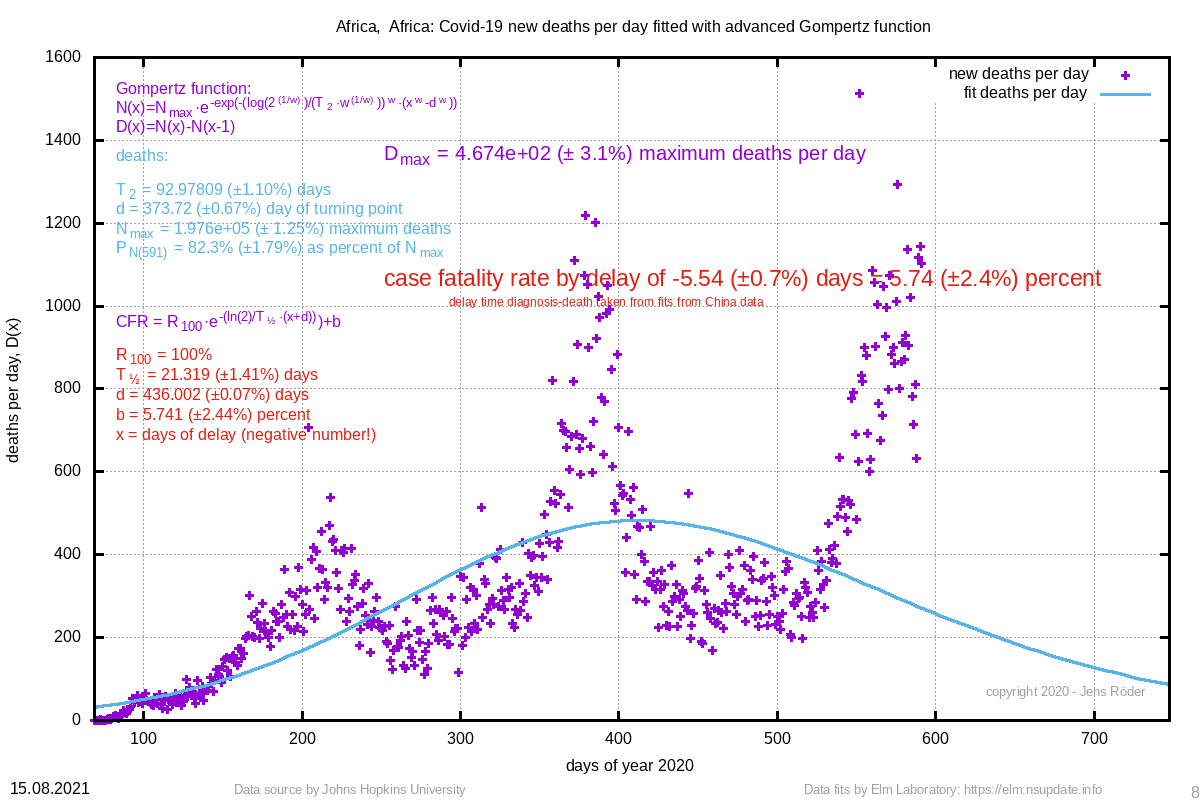 | 92.978 (±1.1%) | 373.72 (±0.7%) |
| 128379 Italy | 171979 (±2.4%) | 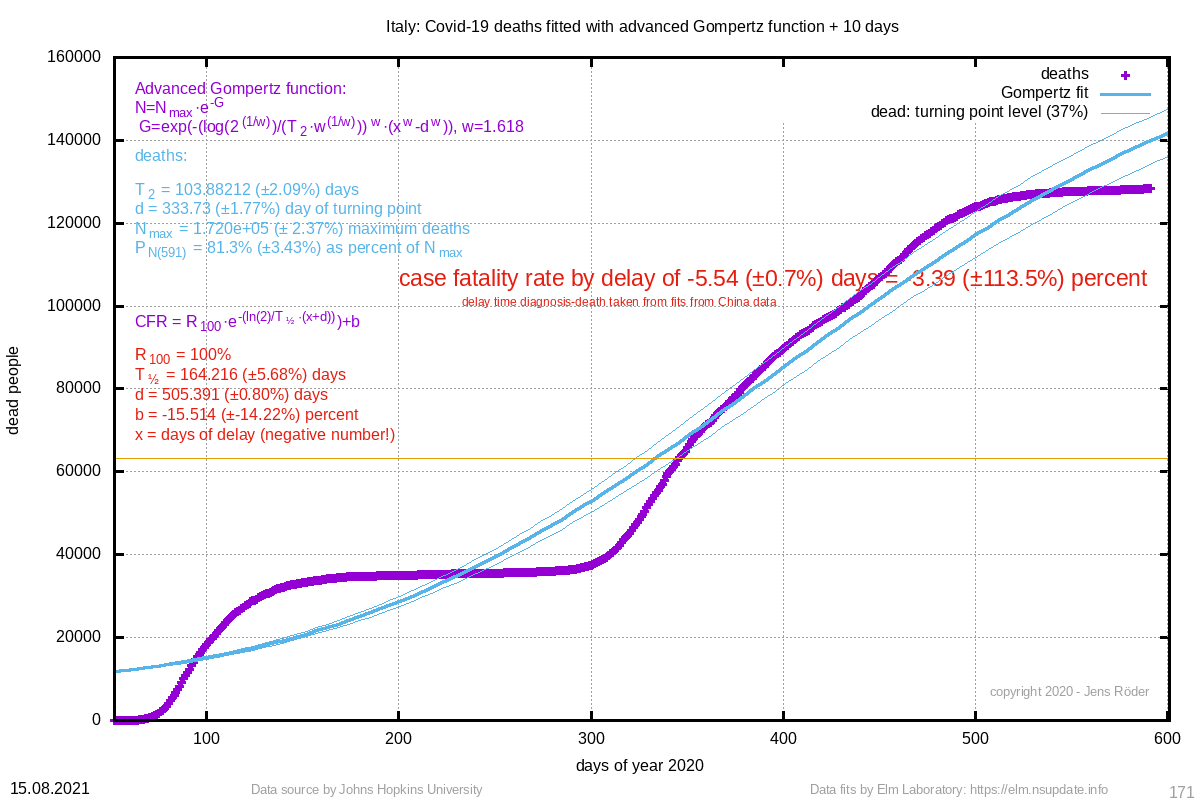 | fiterr (±err) | 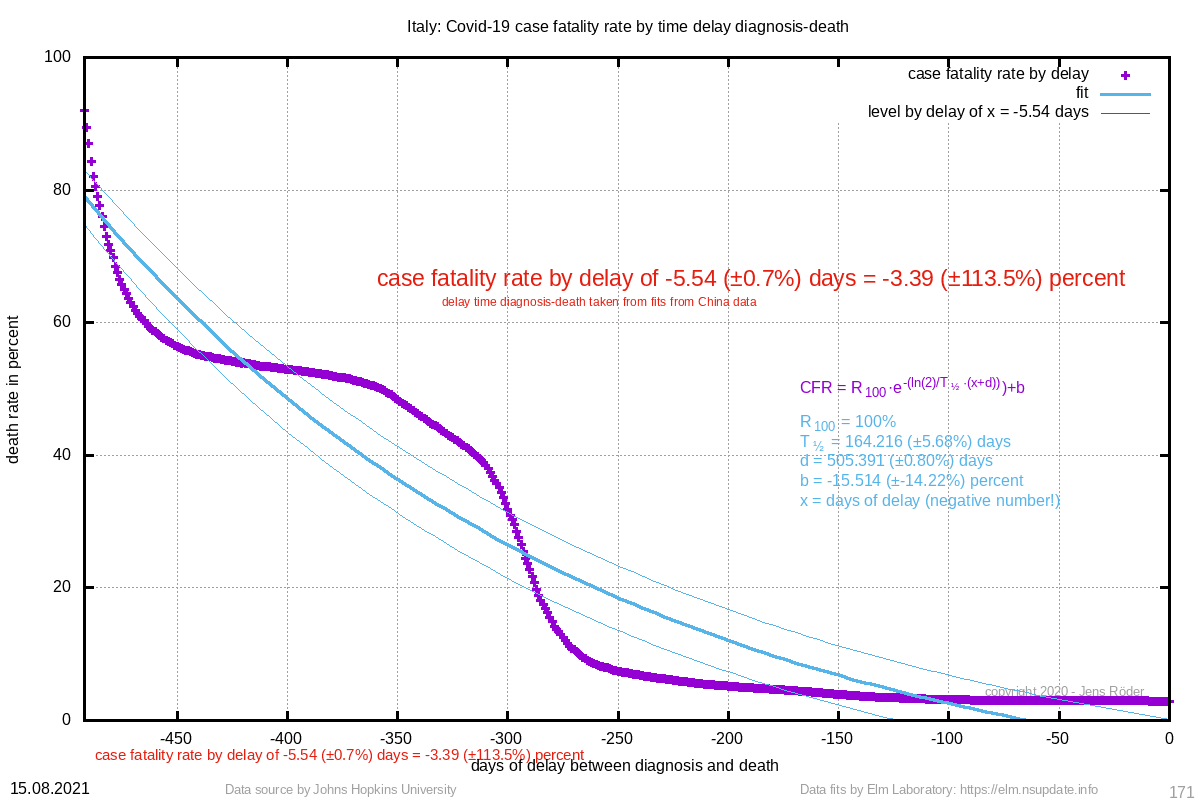 |  | 103.882 (±2.1%) | 333.73 (±1.8%) |
| 108815 Argentina | 146695 (±3.5%) | 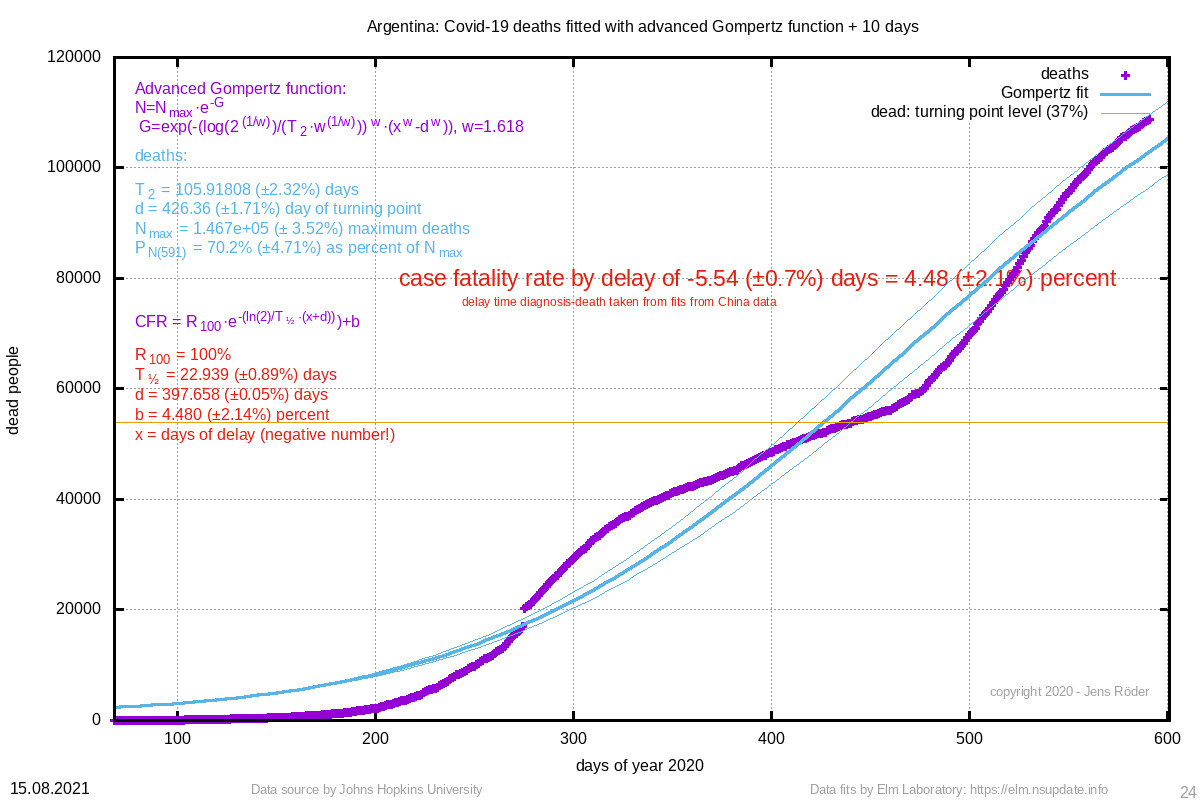 | 4.48 (±2.1%) | 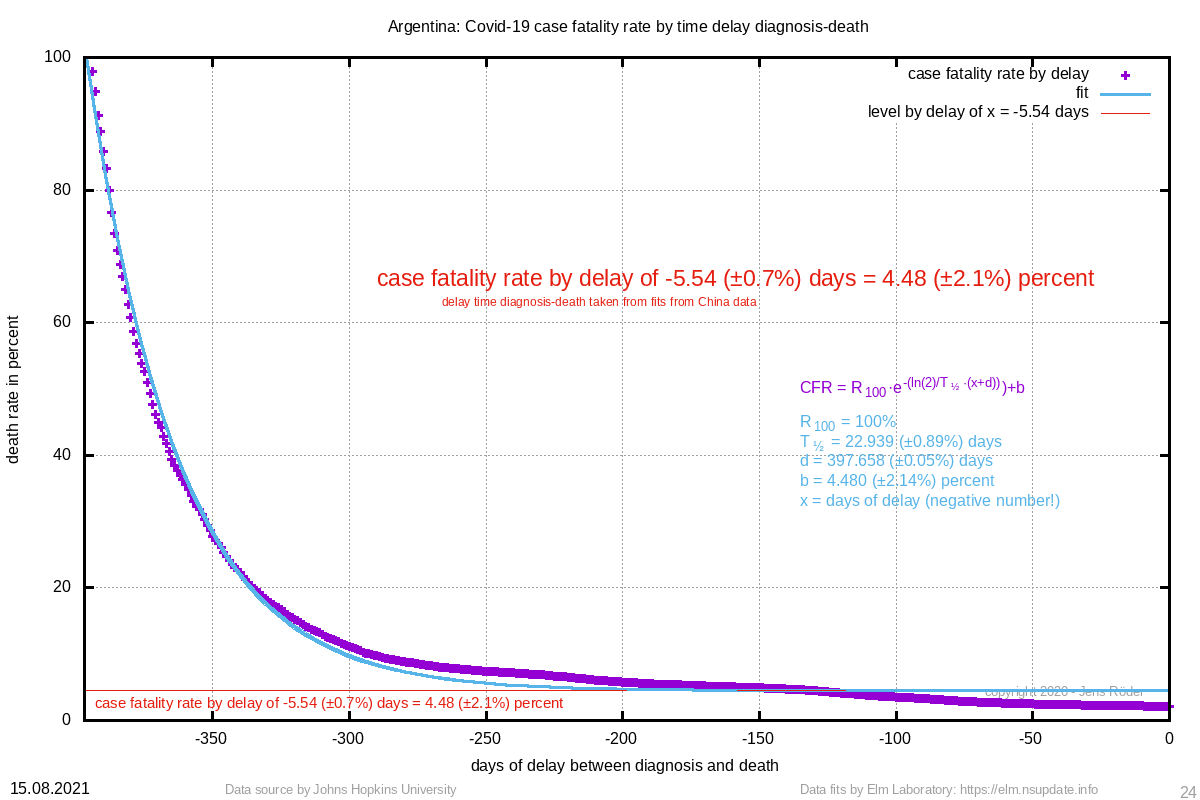 | 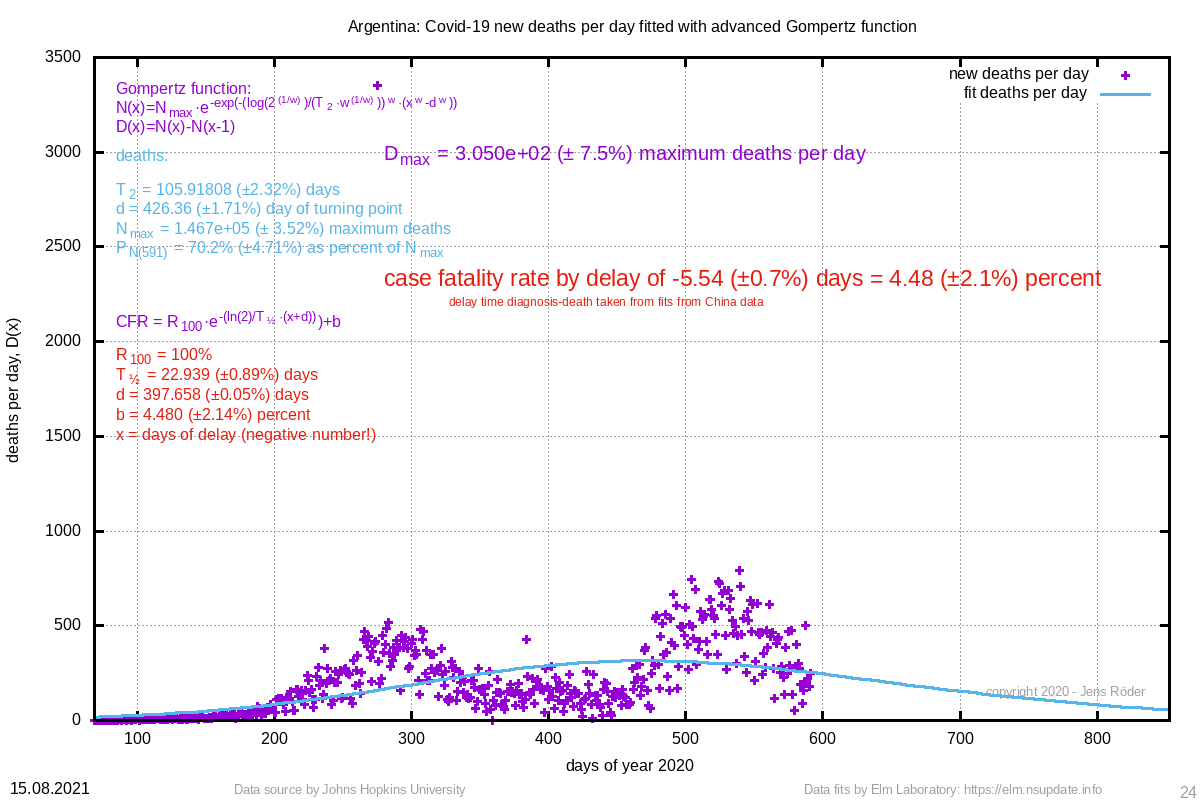 | 105.918 (±2.3%) | 426.36 (±1.7%) |
| 31870 Ecuador | 31820 (±4.0%) | 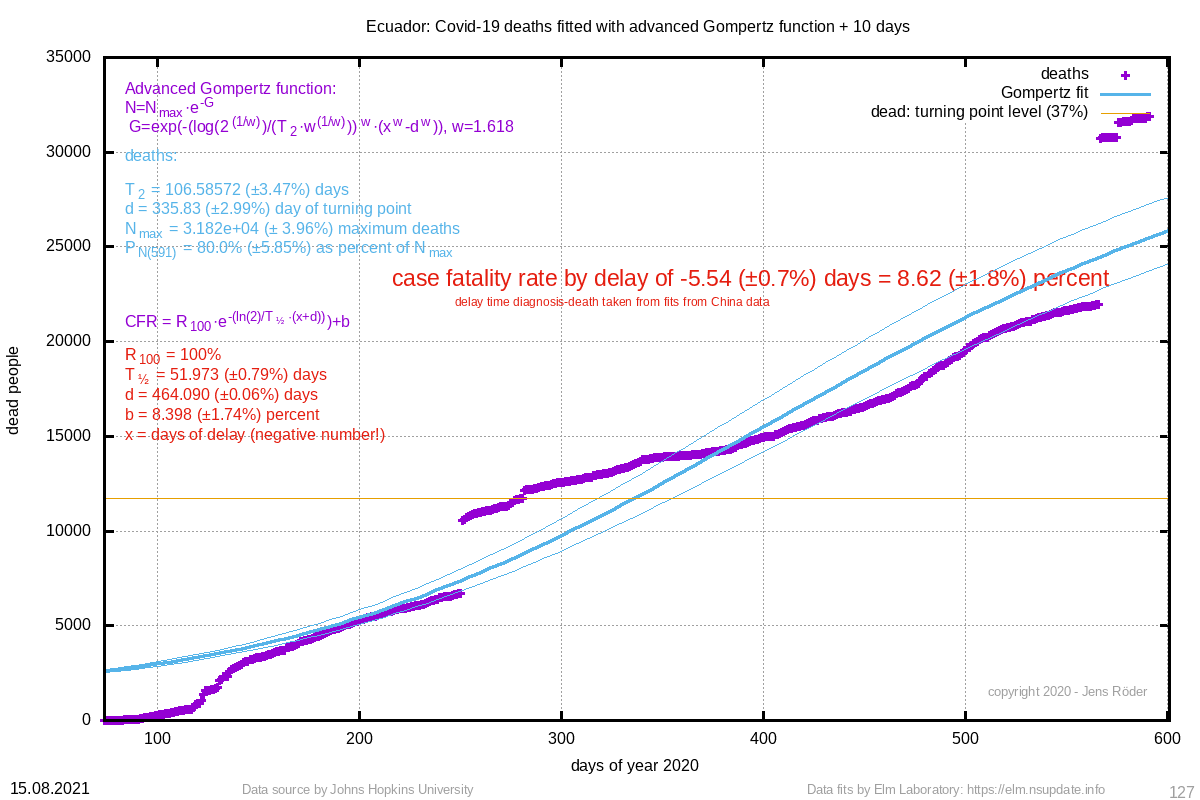 | 8.62 (±1.8%) |  | 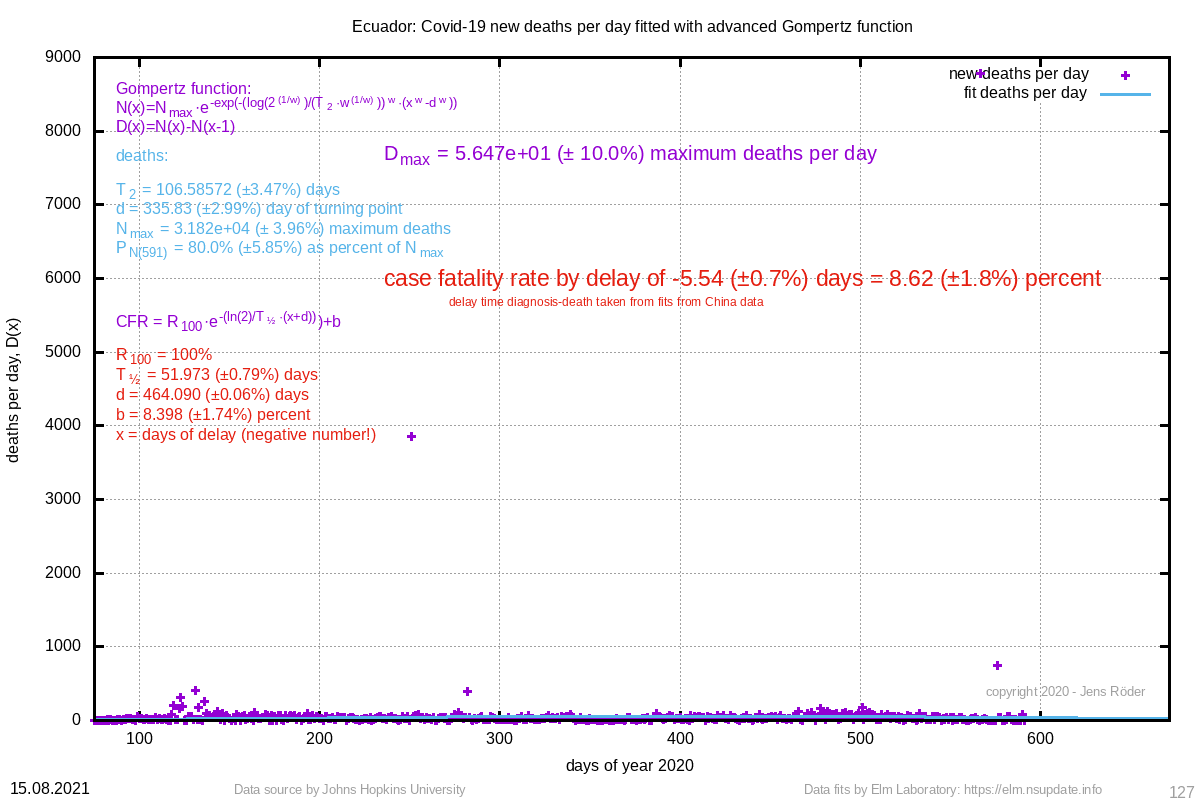 | 106.586 (±3.5%) | 335.83 (±3.0%) |
| 26654 Canada, Canada | 32019 (±1.9%) | 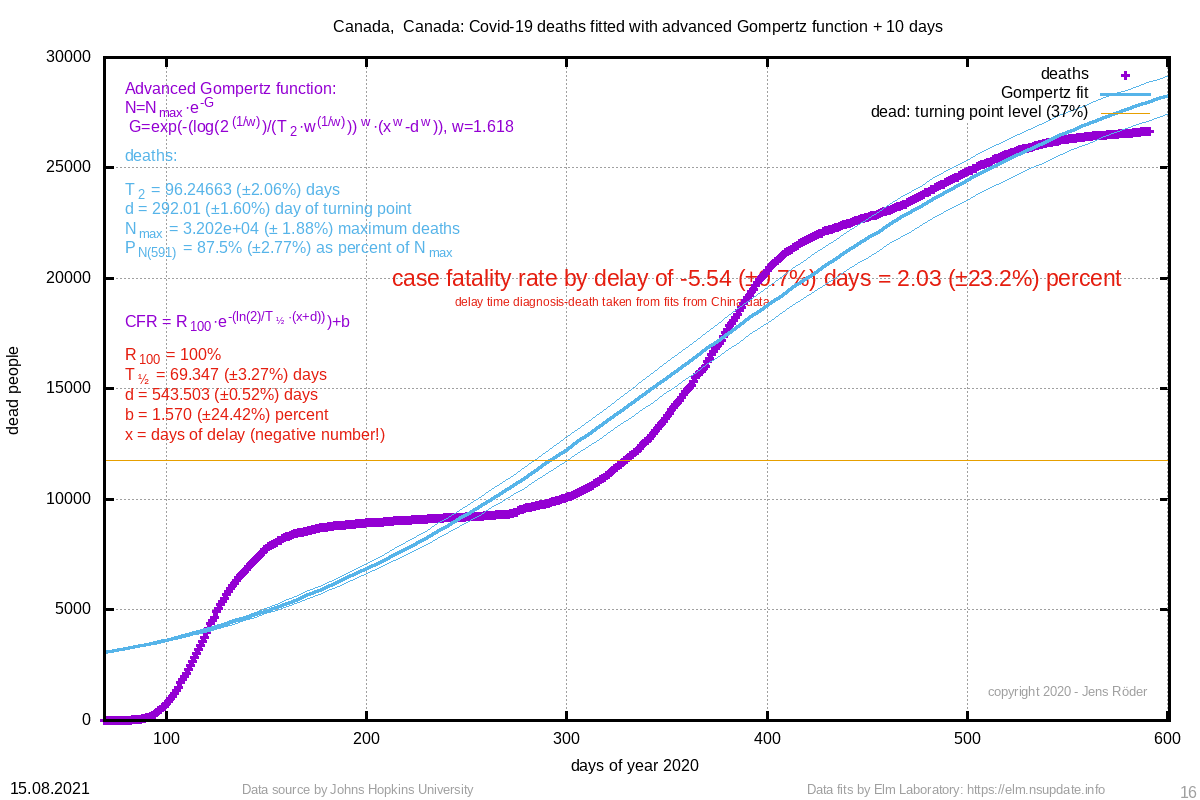 | 2.03 (±23.2%) | 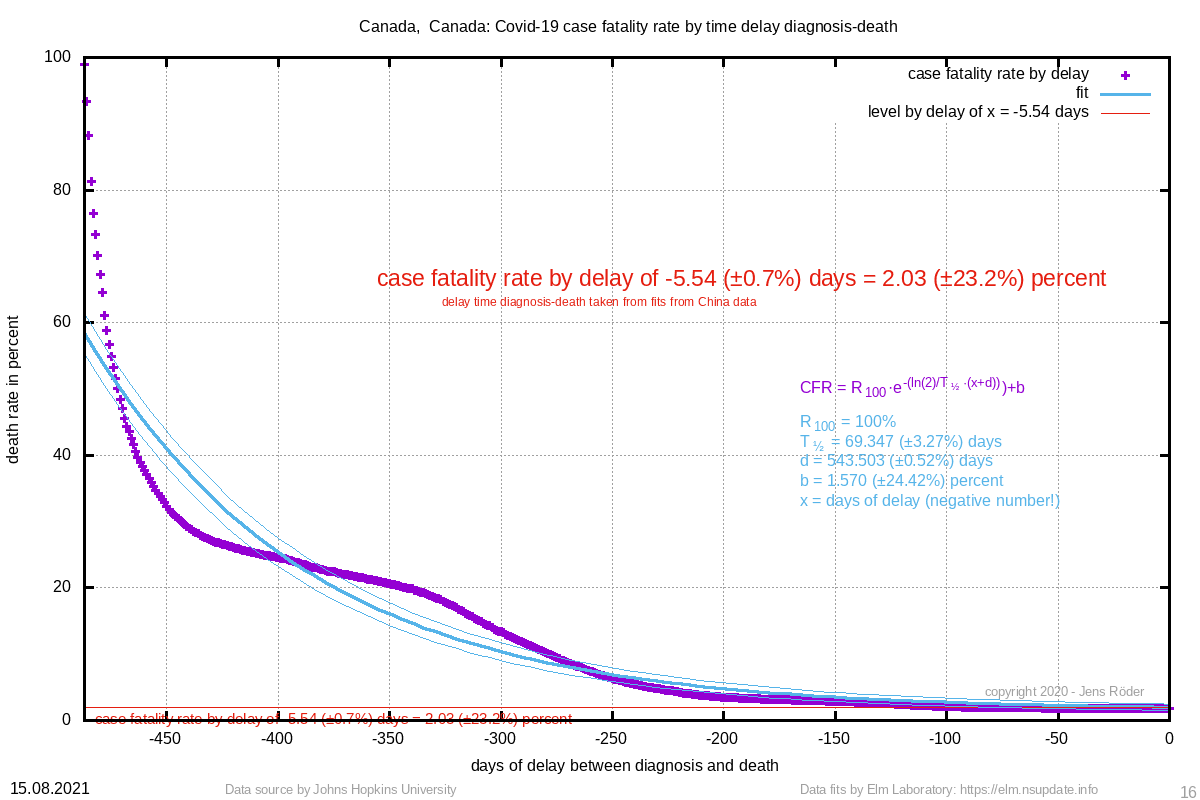 | 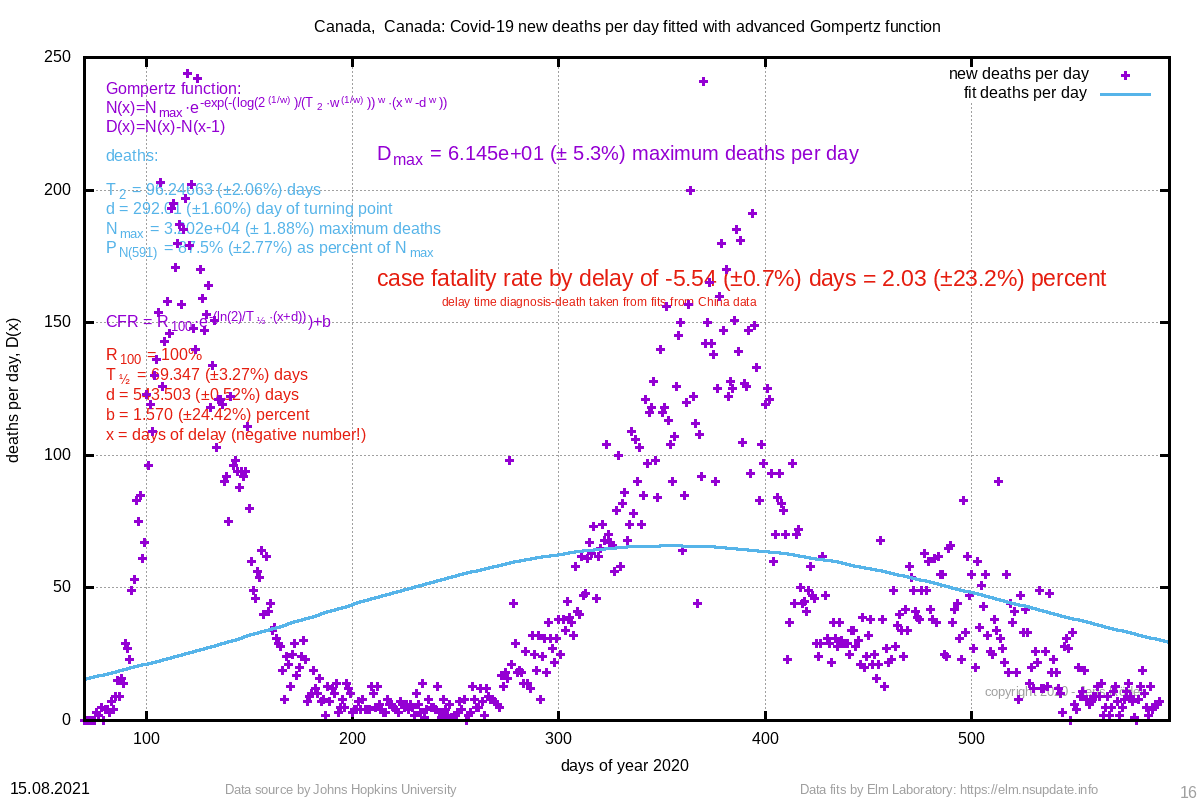 | 96.247 (±2.1%) | 292.01 (±1.6%) |
| 25287 Belgium | 28303 (±1.4%) | 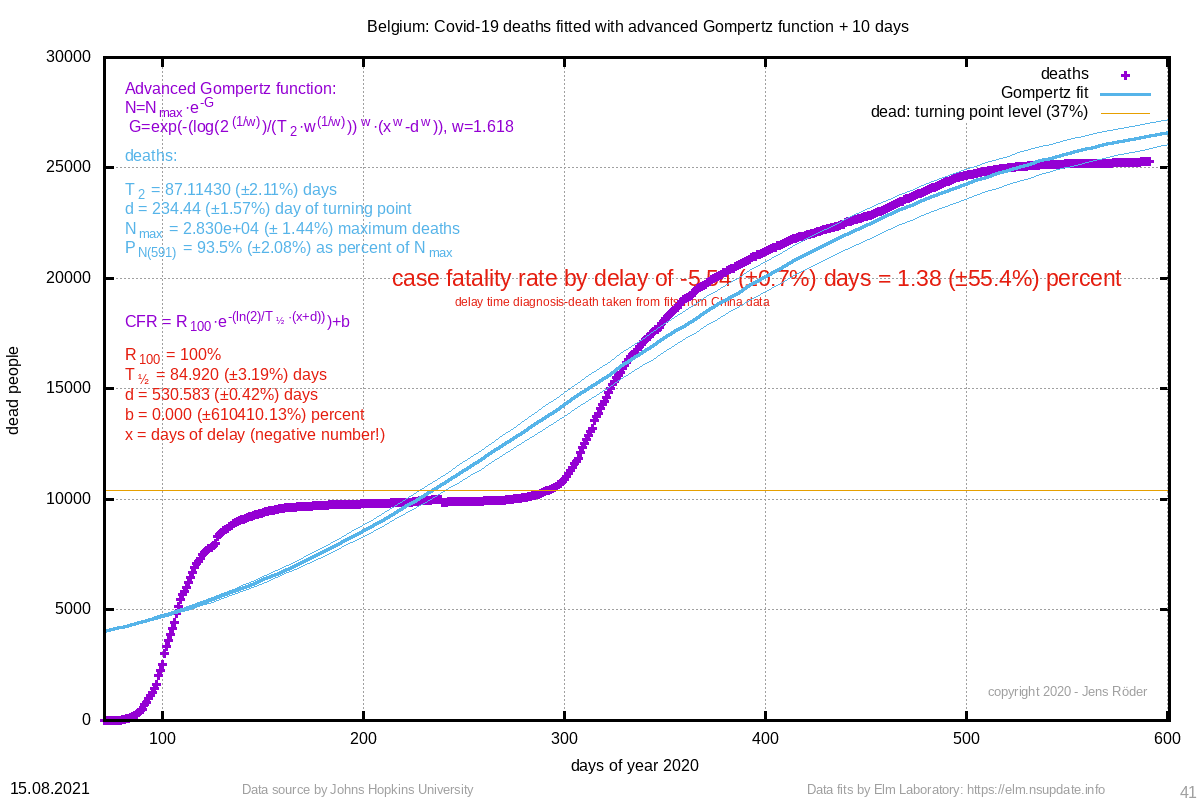 | 1.38 (±55.4%) |  | 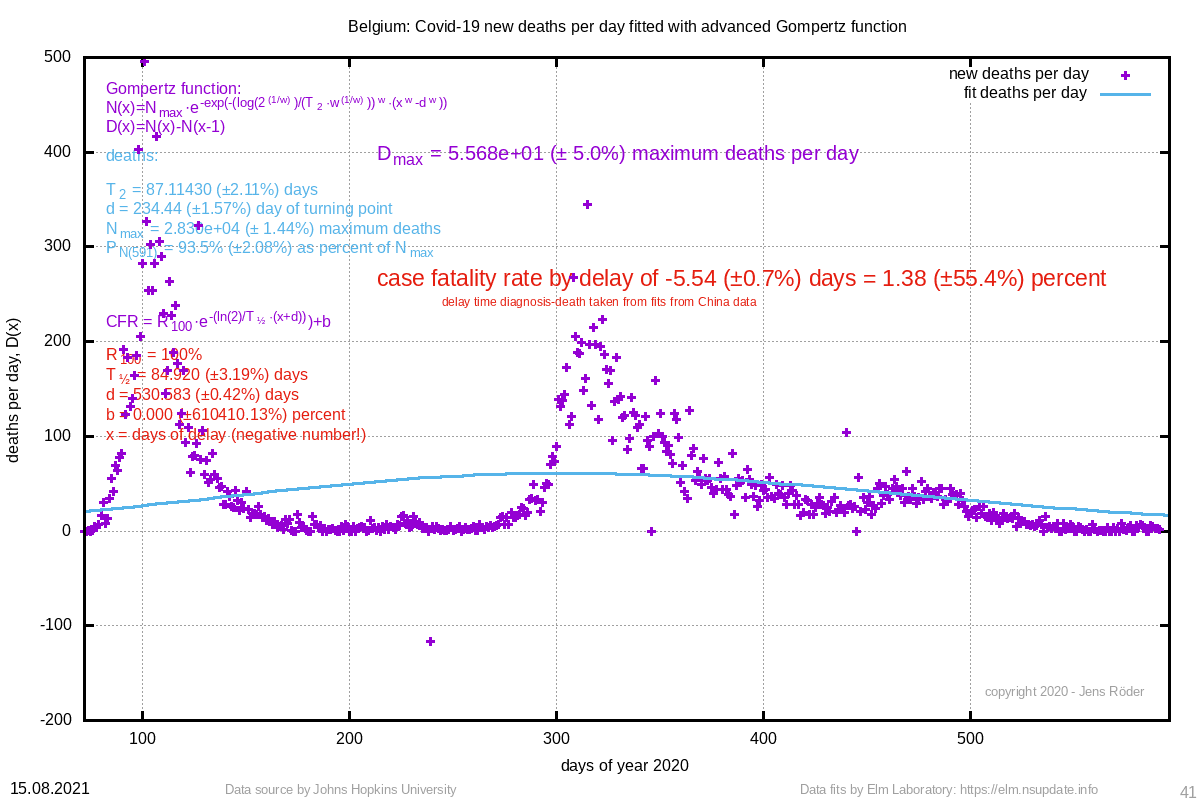 | 87.114 (±2.1%) | 234.44 (±1.6%) |
| 24339 Pakistan | 40303 (±3.8%) |  | 4.83 (±2.0%) | 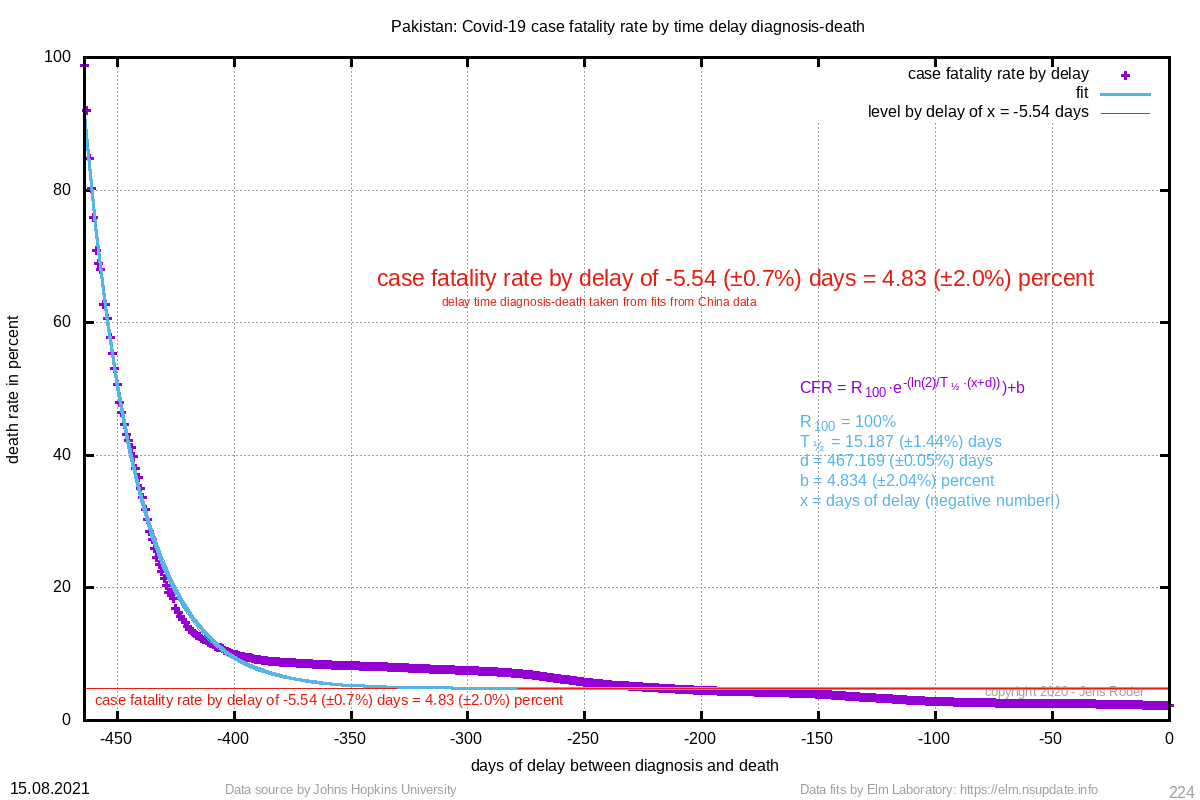 | 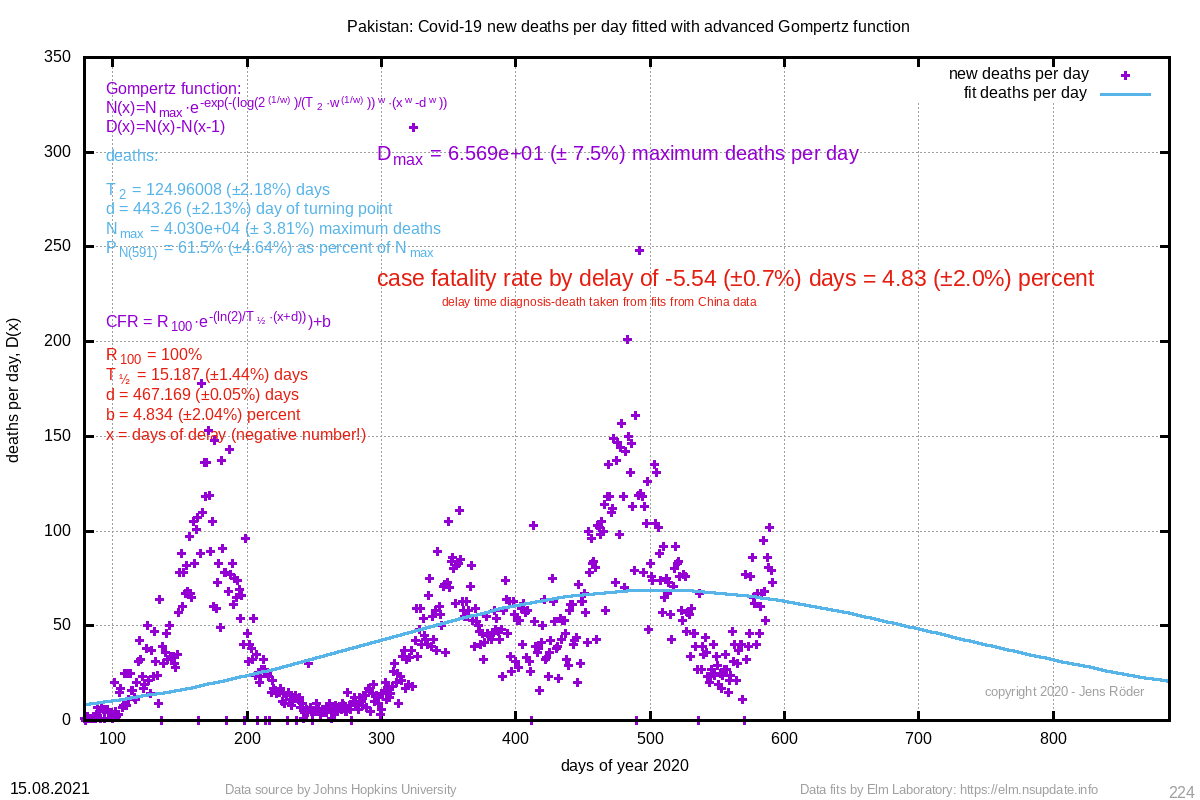 | 124.960 (±2.2%) | 443.26 (±2.1%) |
| 23810 Bangladesh | 169984 (±36.3%) | 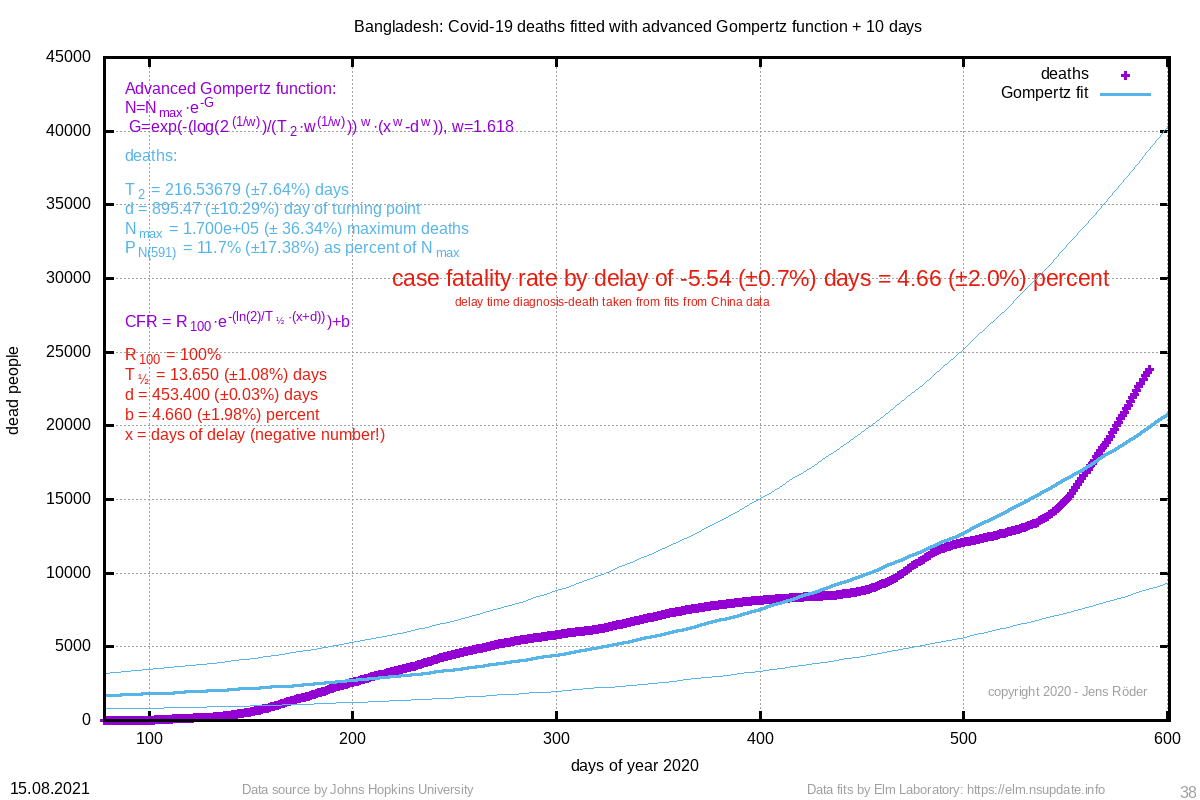 | 4.66 (±2.0%) | 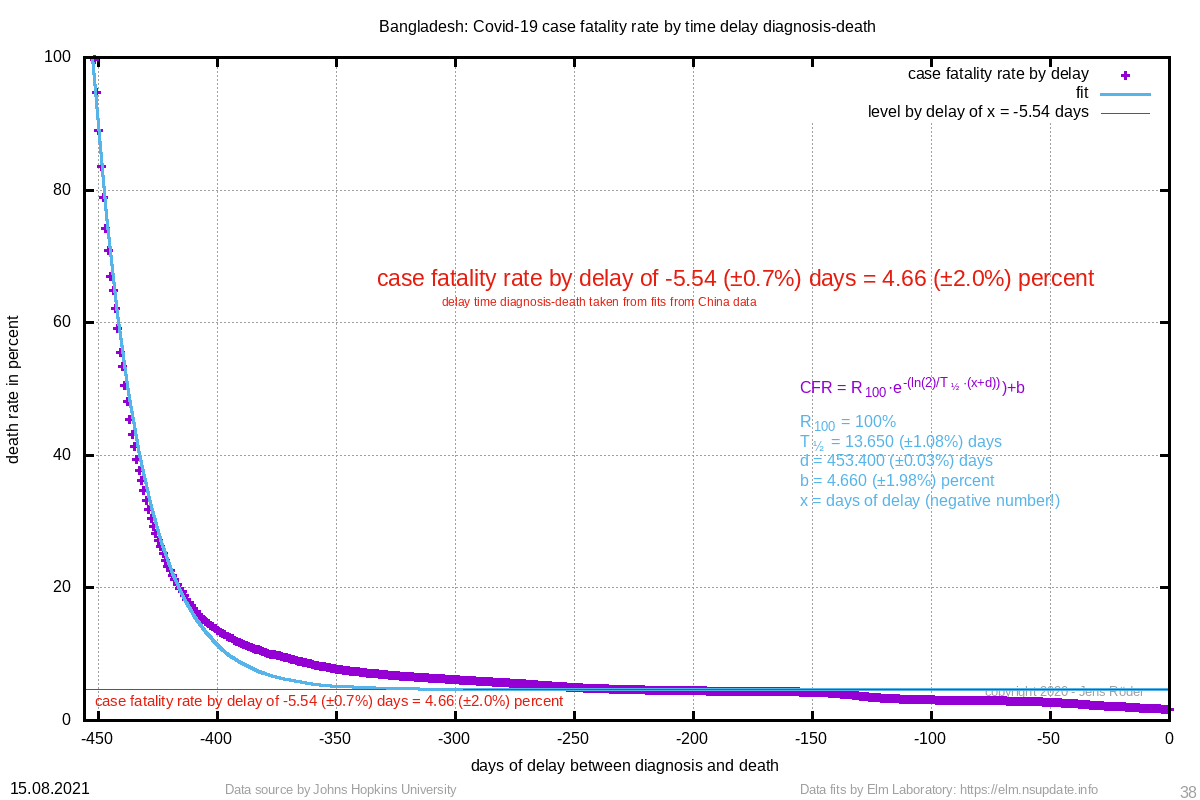 | 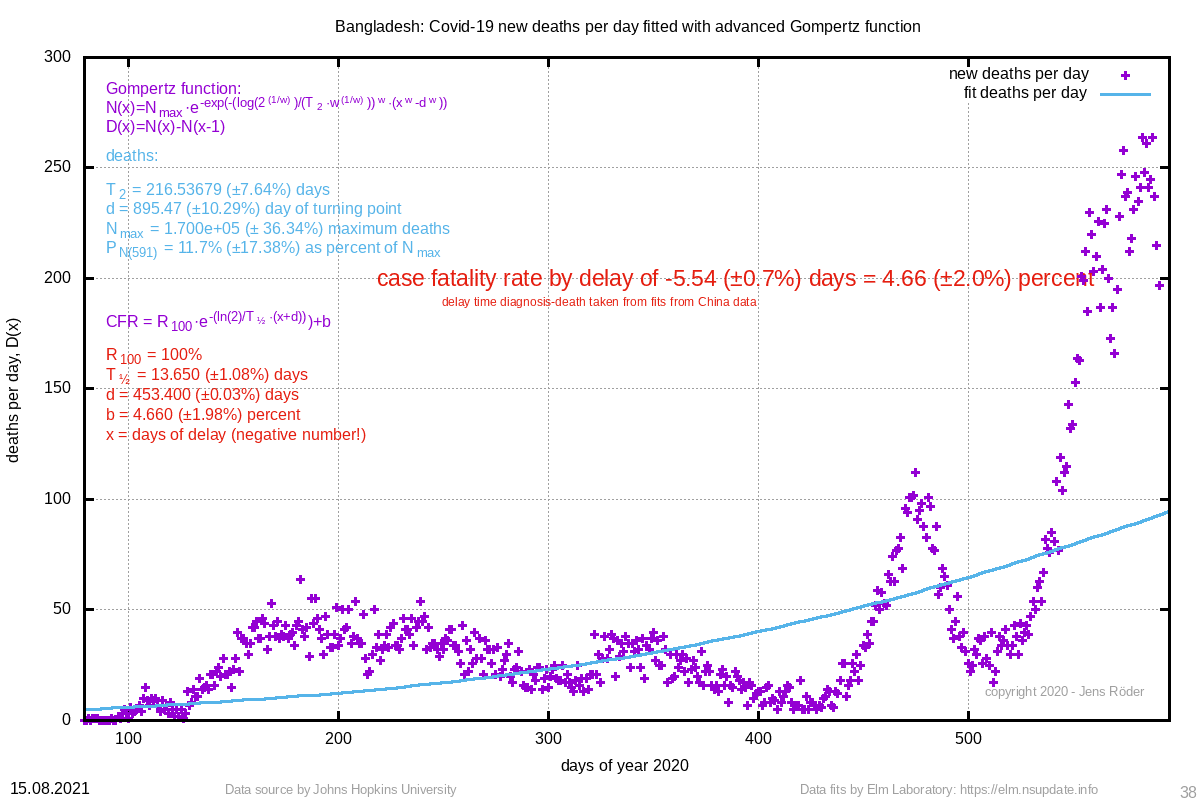 | 216.537 (±7.6%) | 895.47 (±10.3%) |
| 19541 Iraq | 16416 (±0.6%) | 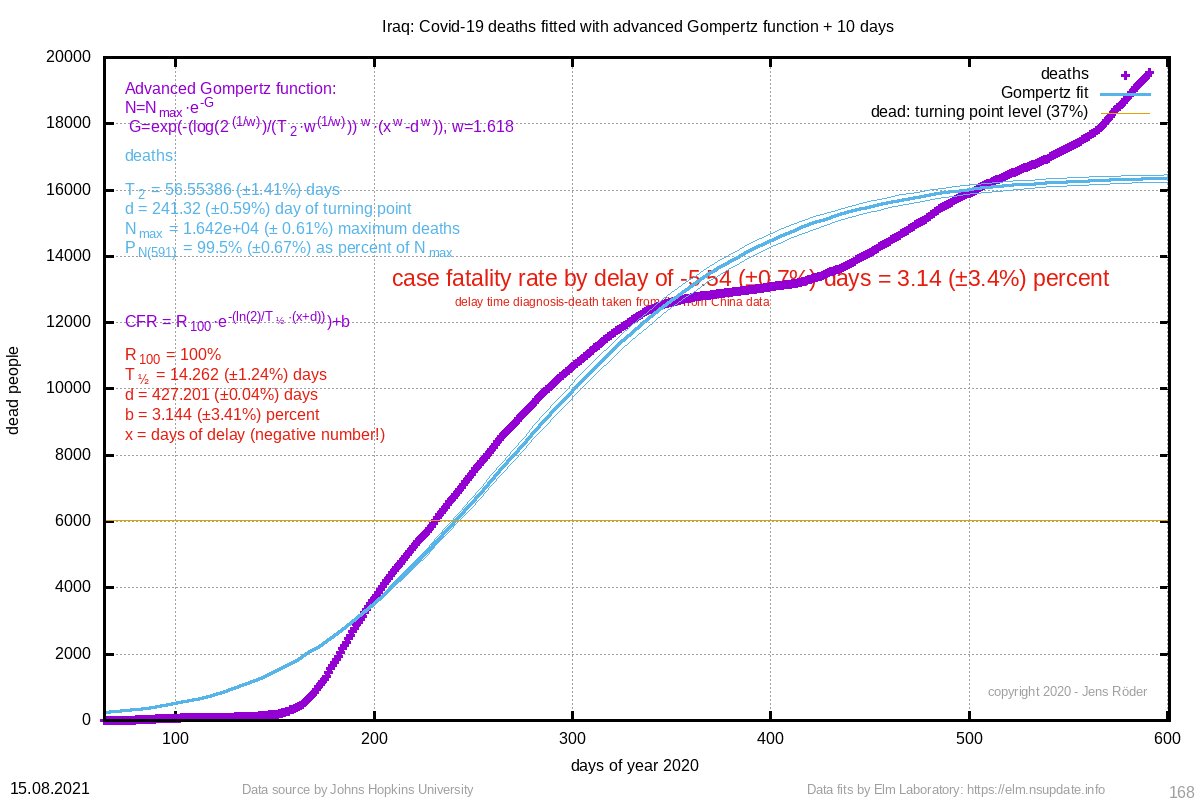 | 3.14 (±3.4%) | 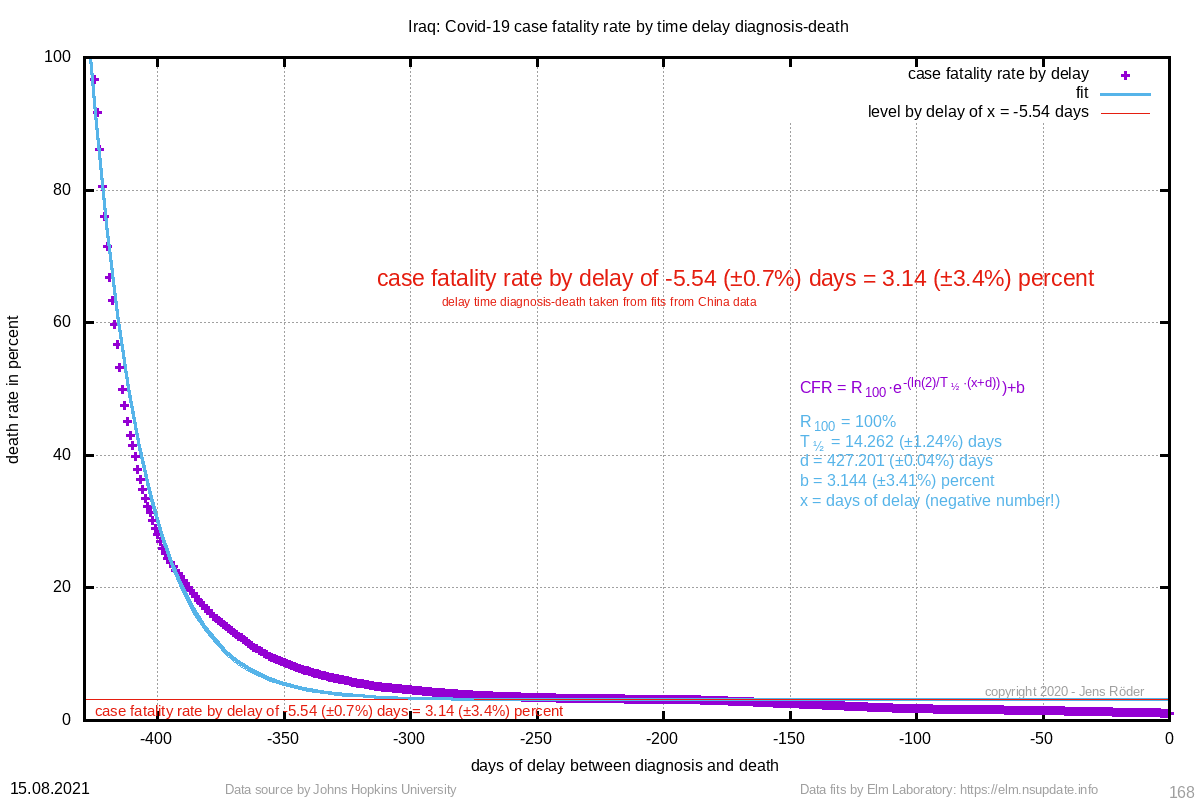 |  | 56.554 (±1.4%) | 241.32 (±0.6%) |
| 18332 Bulgaria | 20013 (±0.7%) |  | fiterr (±err) | 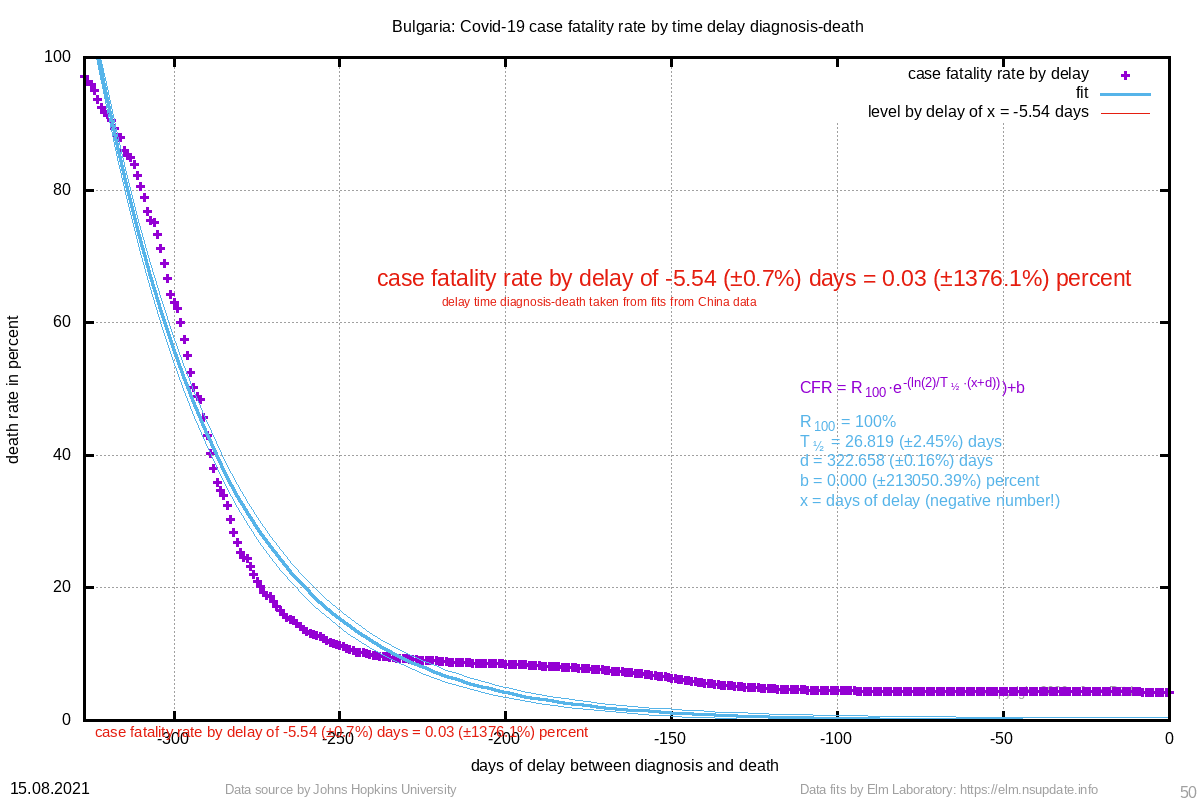 |  | 64.156 (±1.0%) | 377.58 (±0.2%) |
| 18152 Bolivia | 17406 (±1.6%) |  | 8.12 (±2.1%) |  | 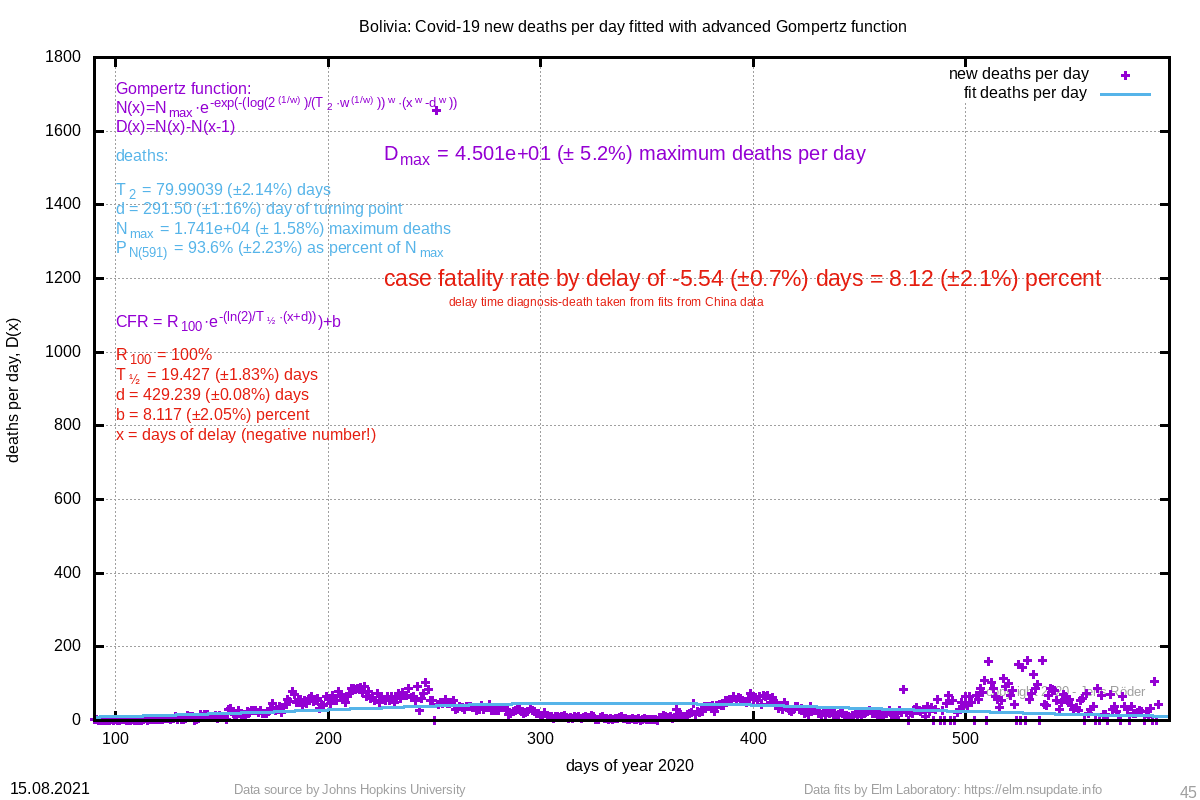 | 79.990 (±2.1%) | 291.50 (±1.2%) |
| 12544 Slovakia | 13074 (±0.2%) | 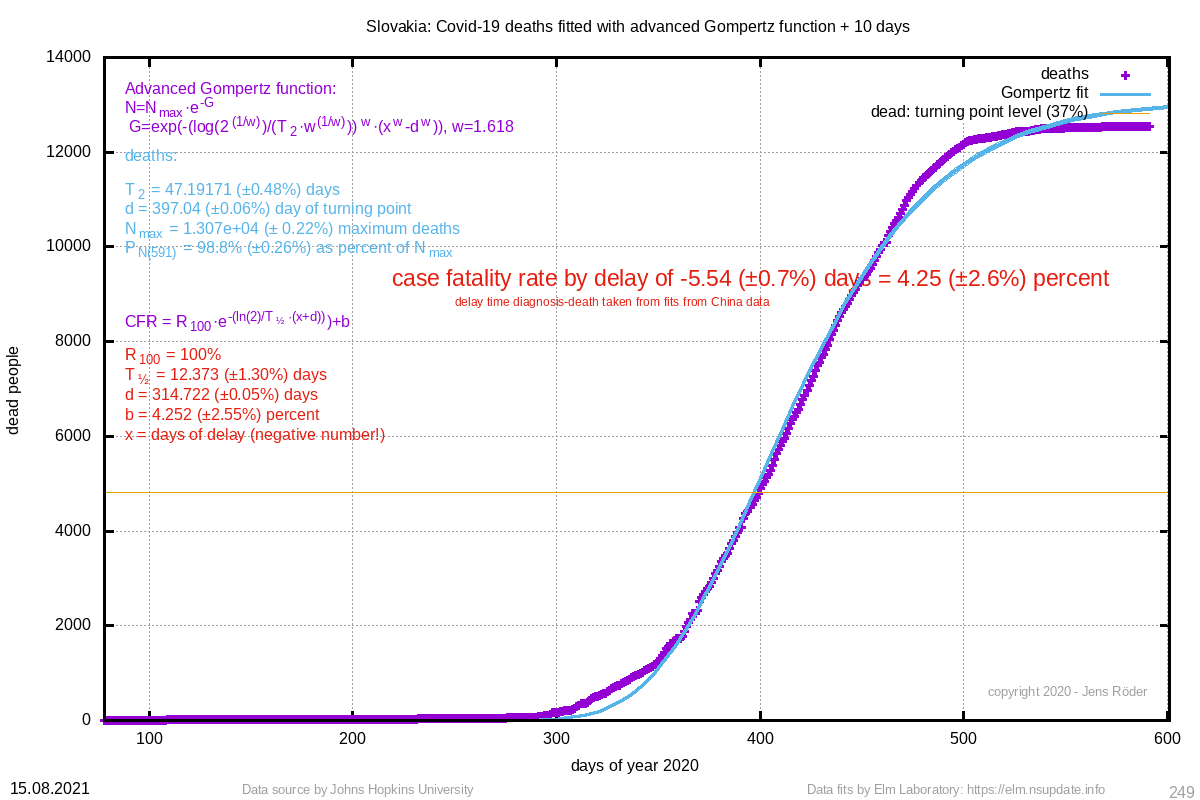 | 4.25 (±2.6%) |  | 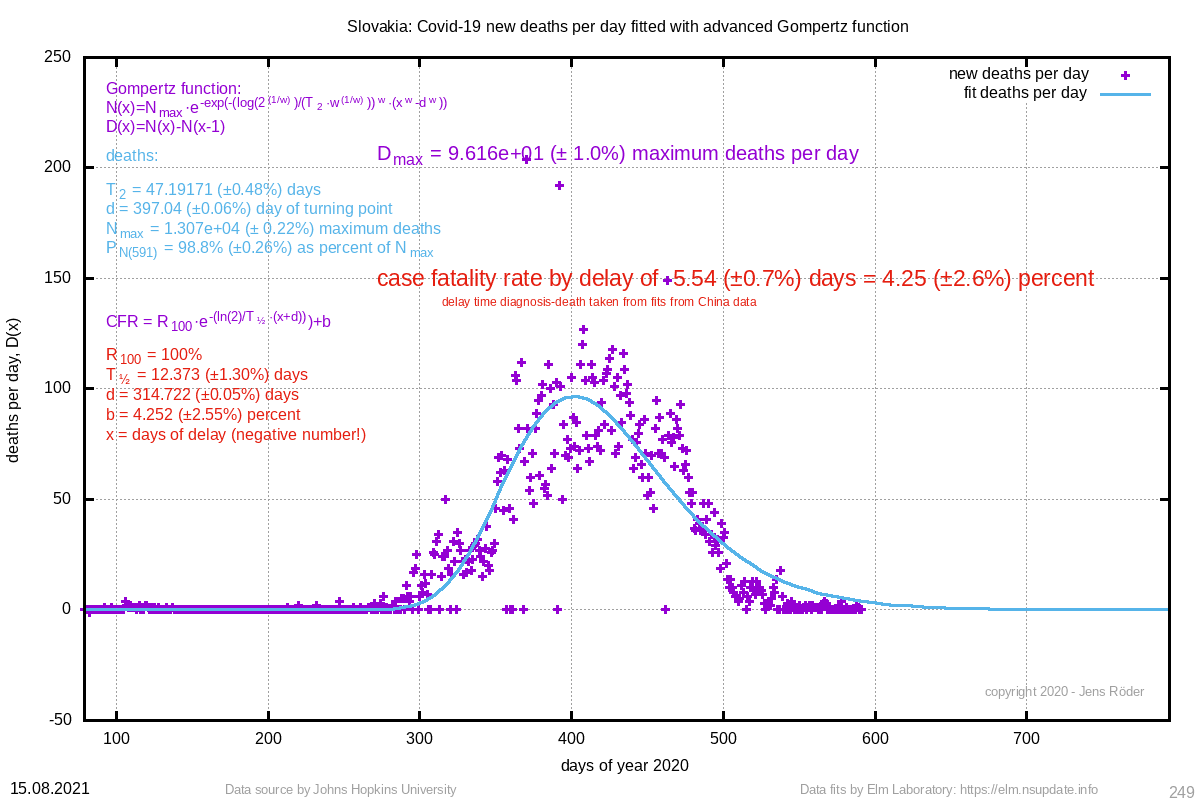 | 47.192 (±0.5%) | 397.04 (±0.1%) |
| 10791 Kazakhstan | 20508 (±7.4%) | 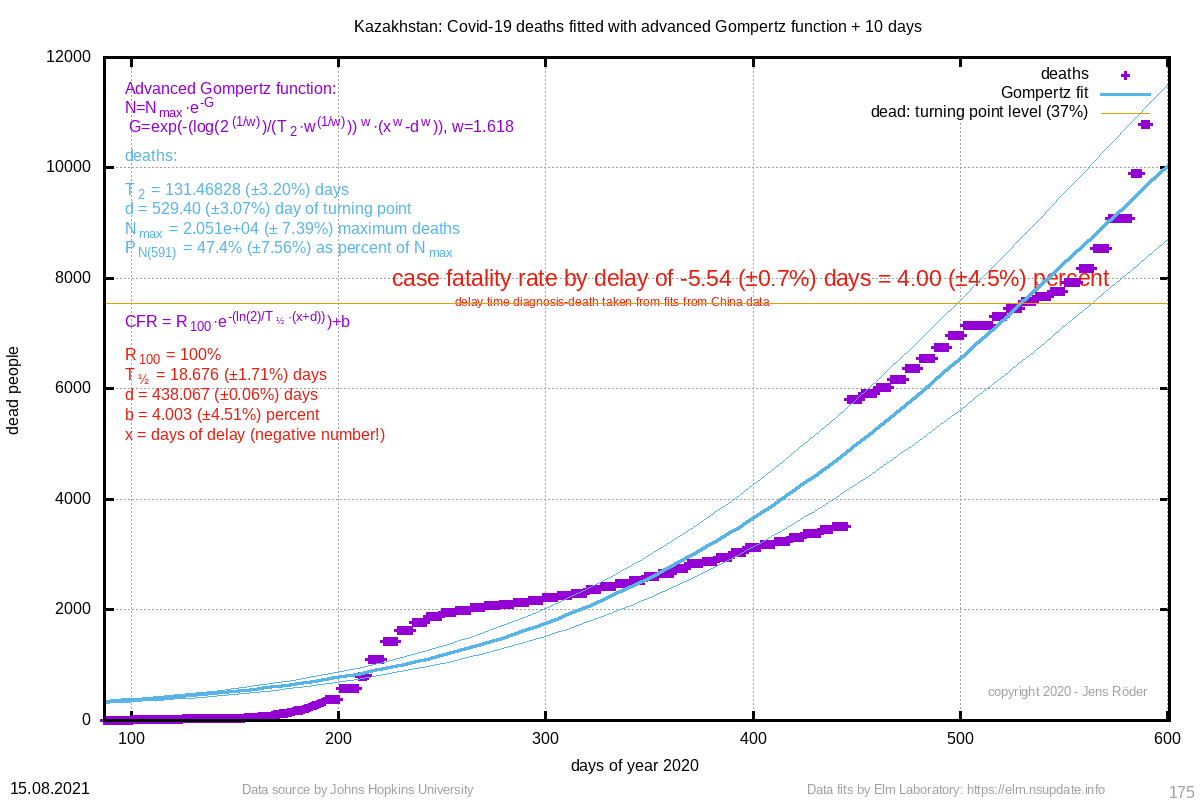 | 4.00 (±4.5%) | 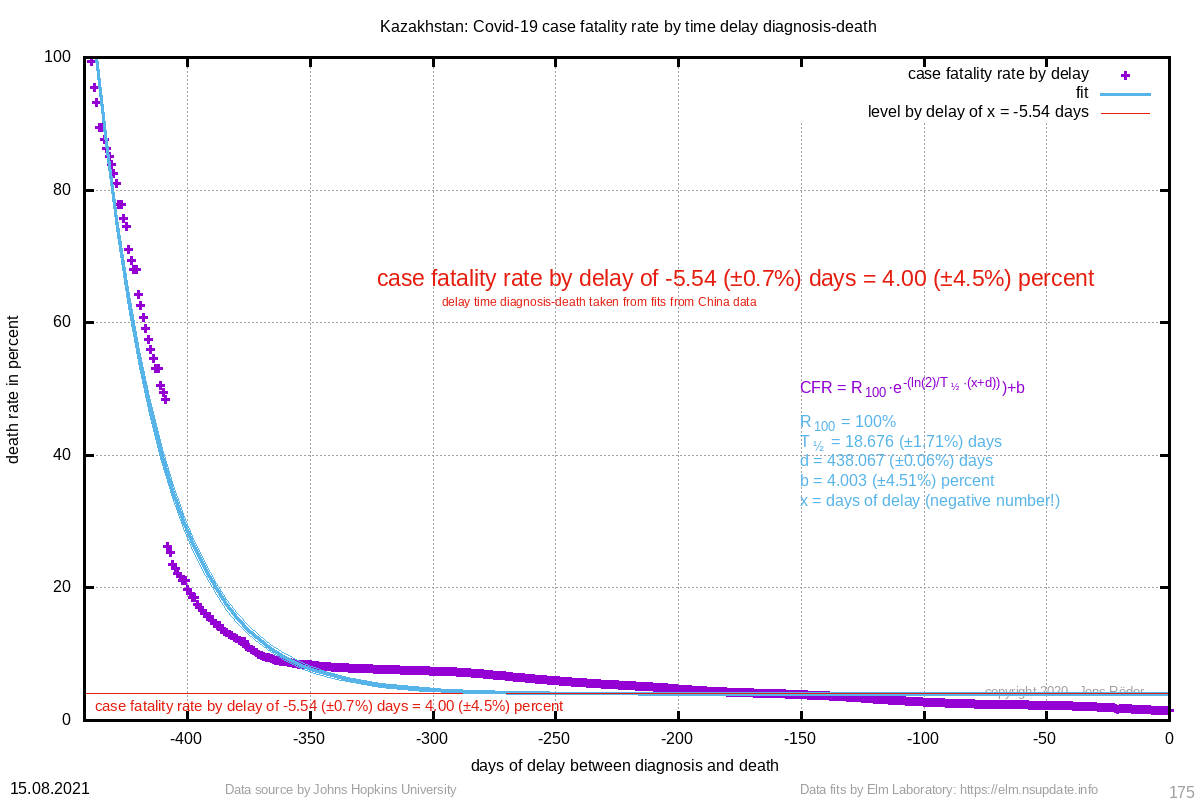 | 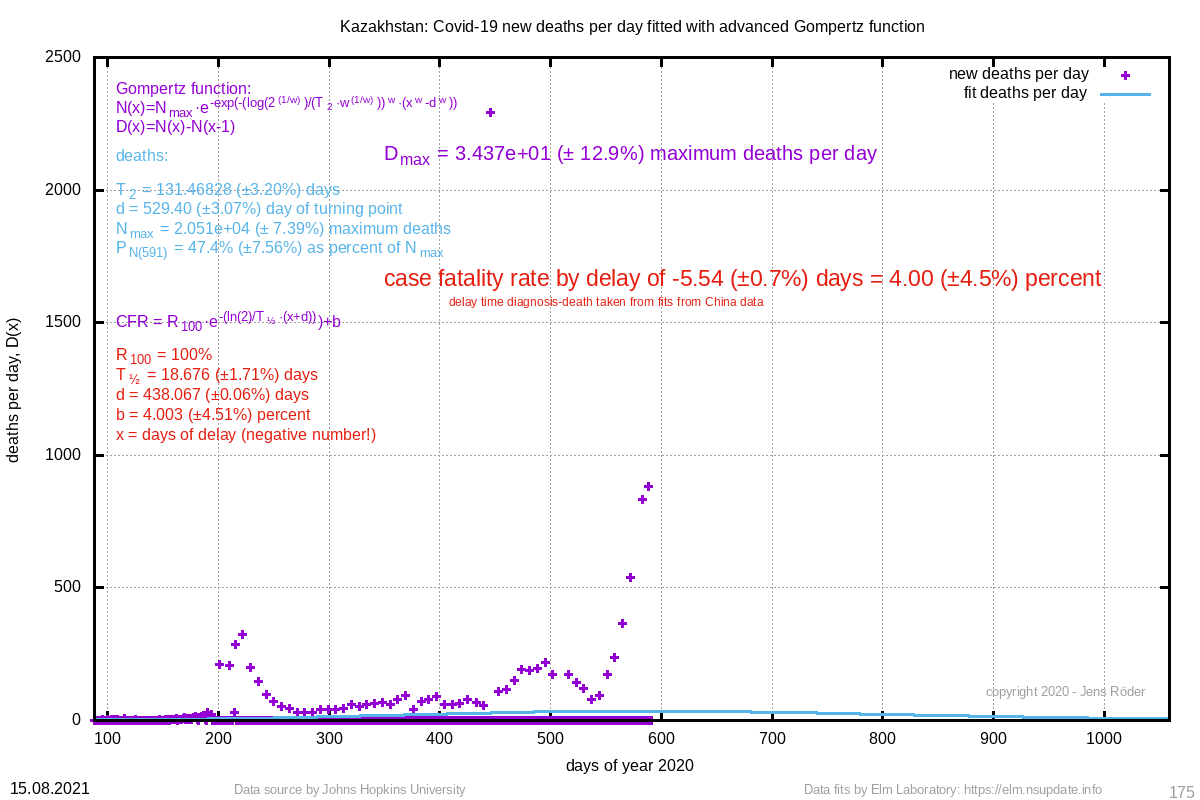 | 131.468 (±3.2%) | 529.40 (±3.1%) |
| 10753 Austria | 7794927072 (±1368.2%) | 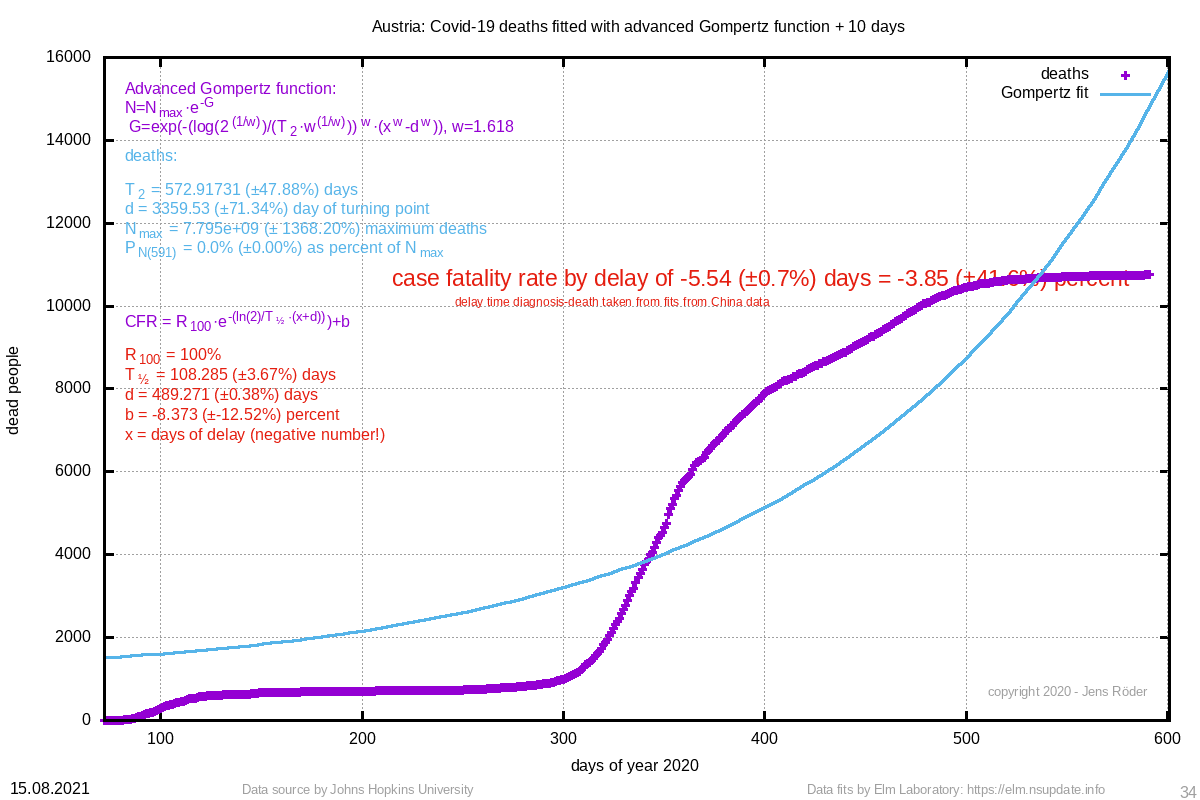 | fiterr (±err) |  | 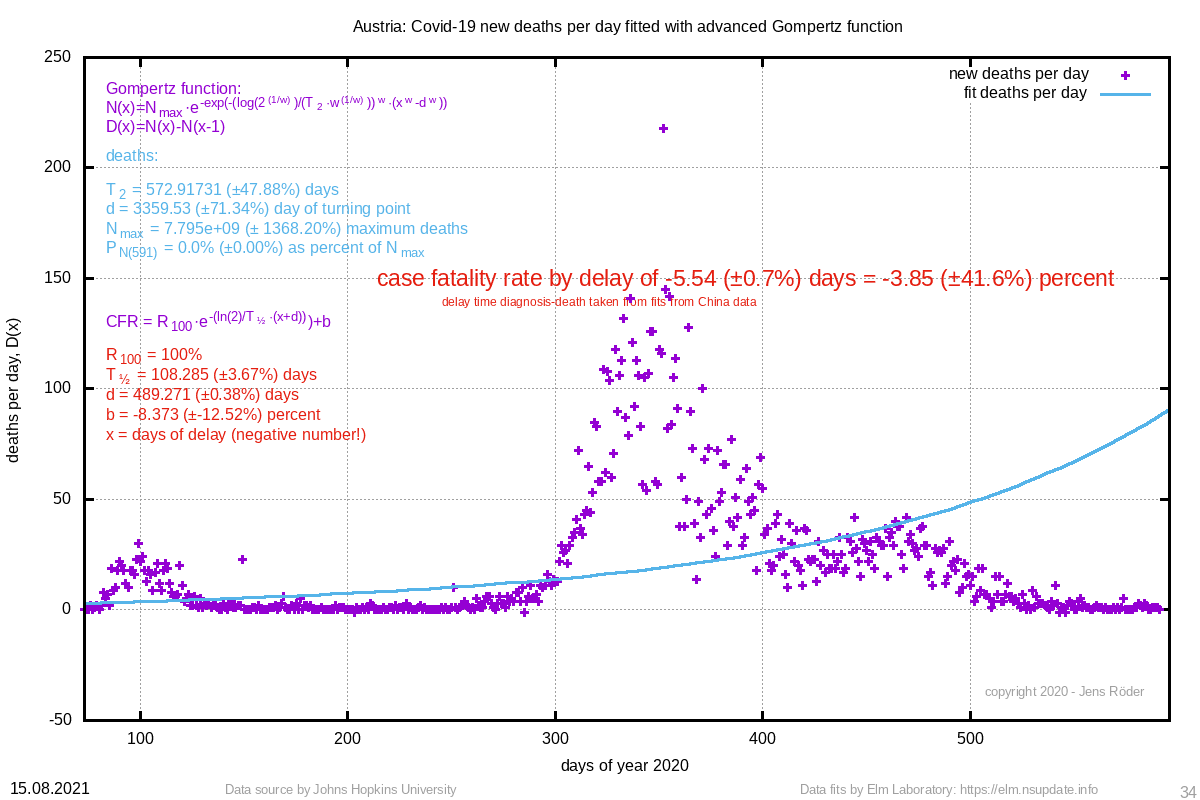 | 572.917 (±47.9%) | 3359.53 (±71.3%) |
| 10187 Jordan | 11478 (±1.2%) | 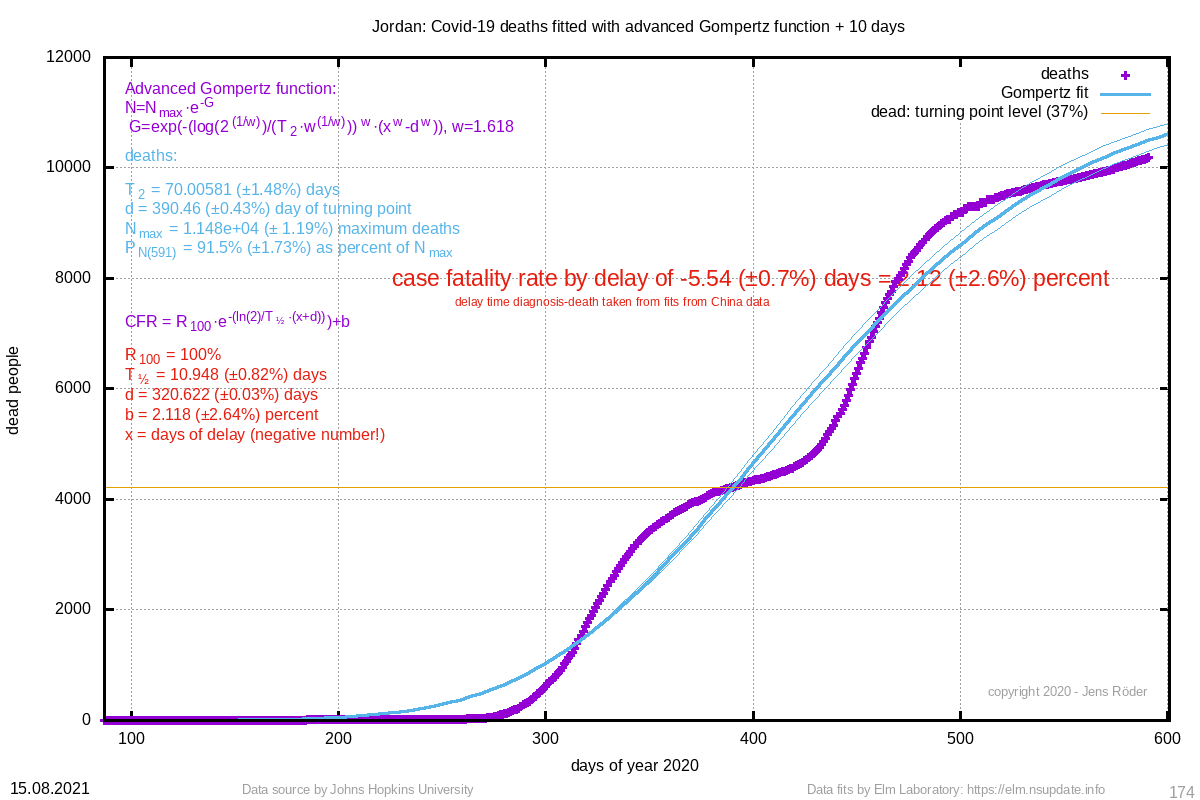 | 2.12 (±2.6%) | 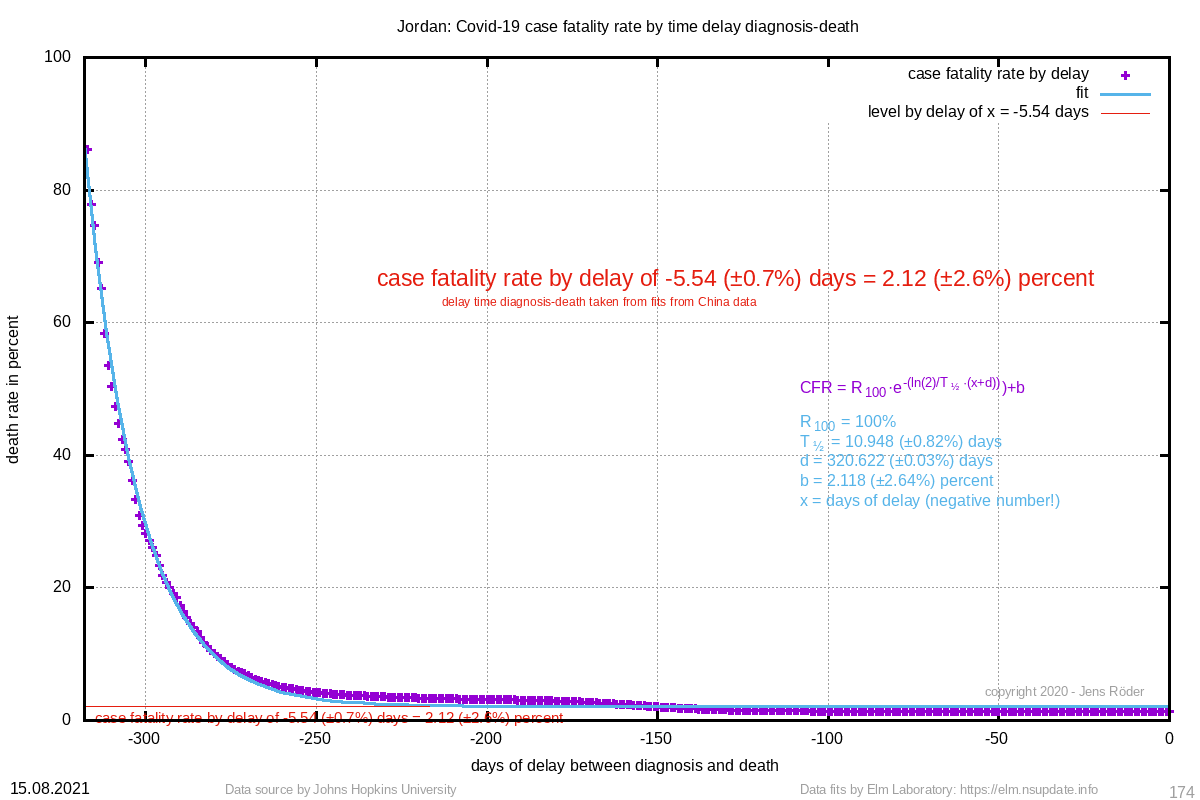 | 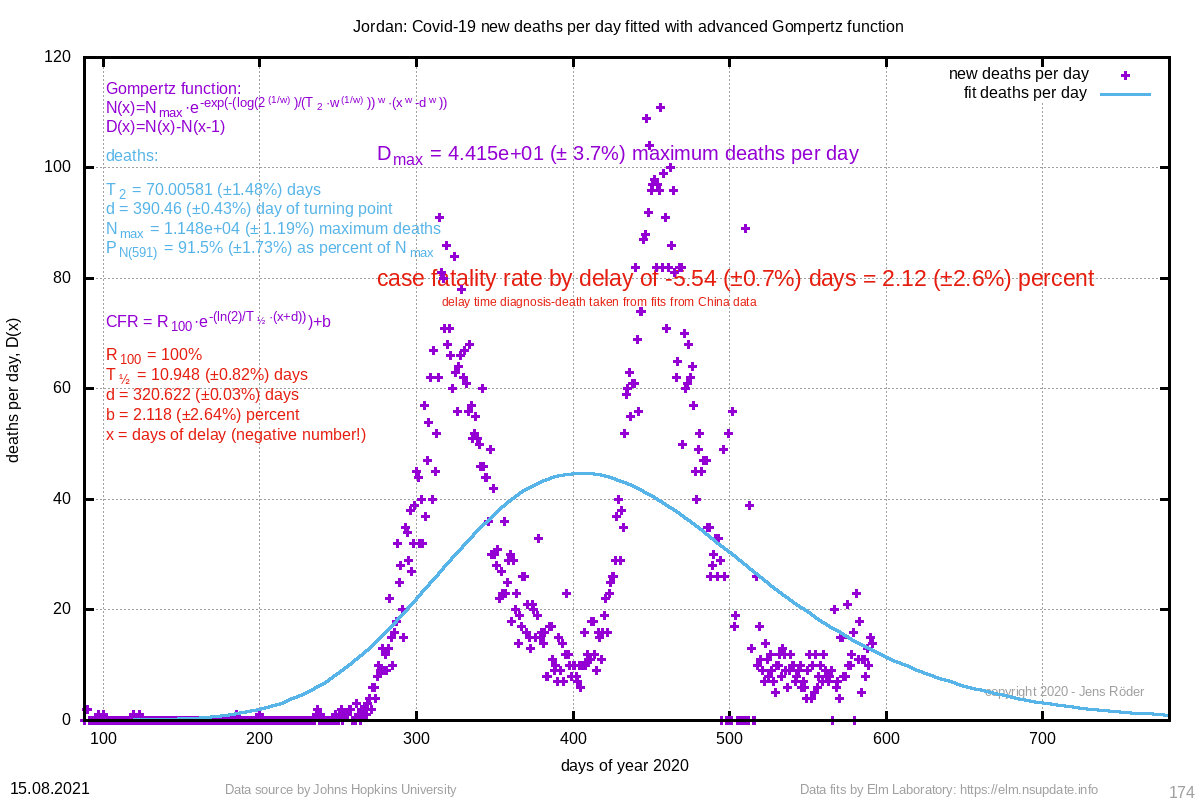 | 70.006 (±1.5%) | 390.46 (±0.4%) |
| 9701 Bosnia and Herzegovina | 11548 (±1.0%) | 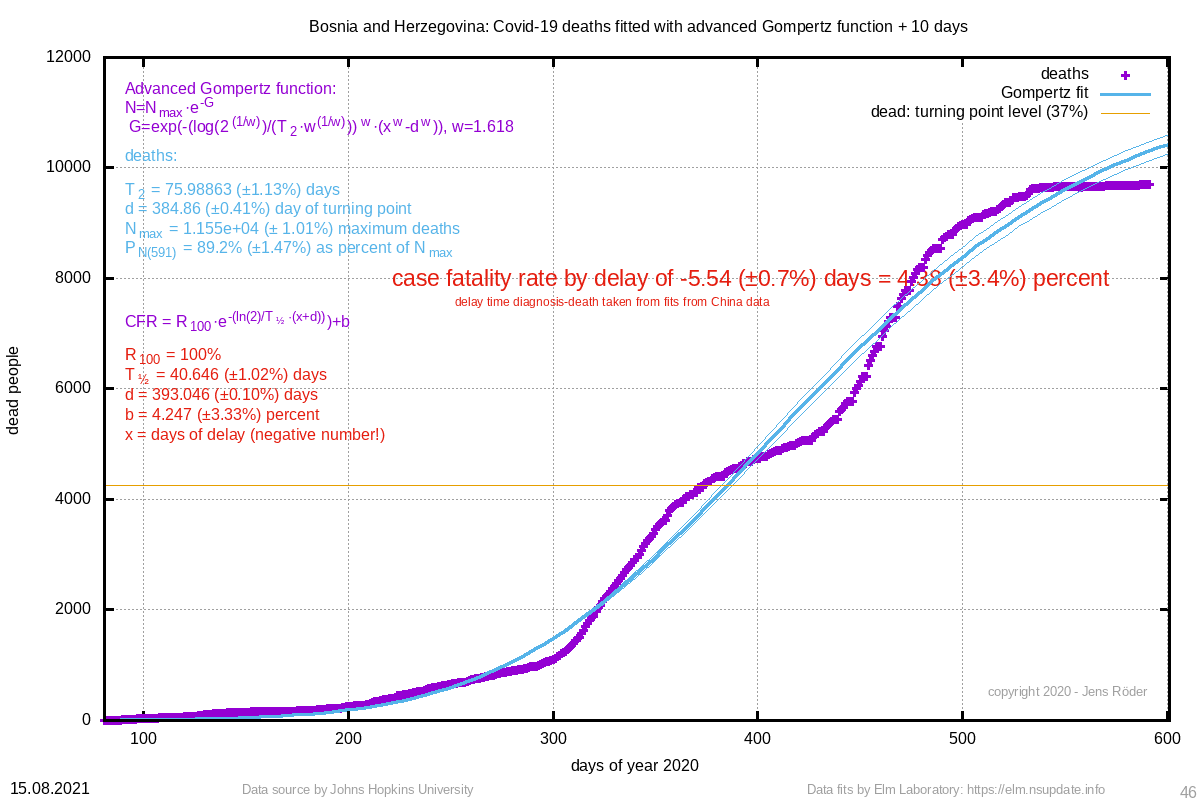 | 4.38 (±3.4%) | 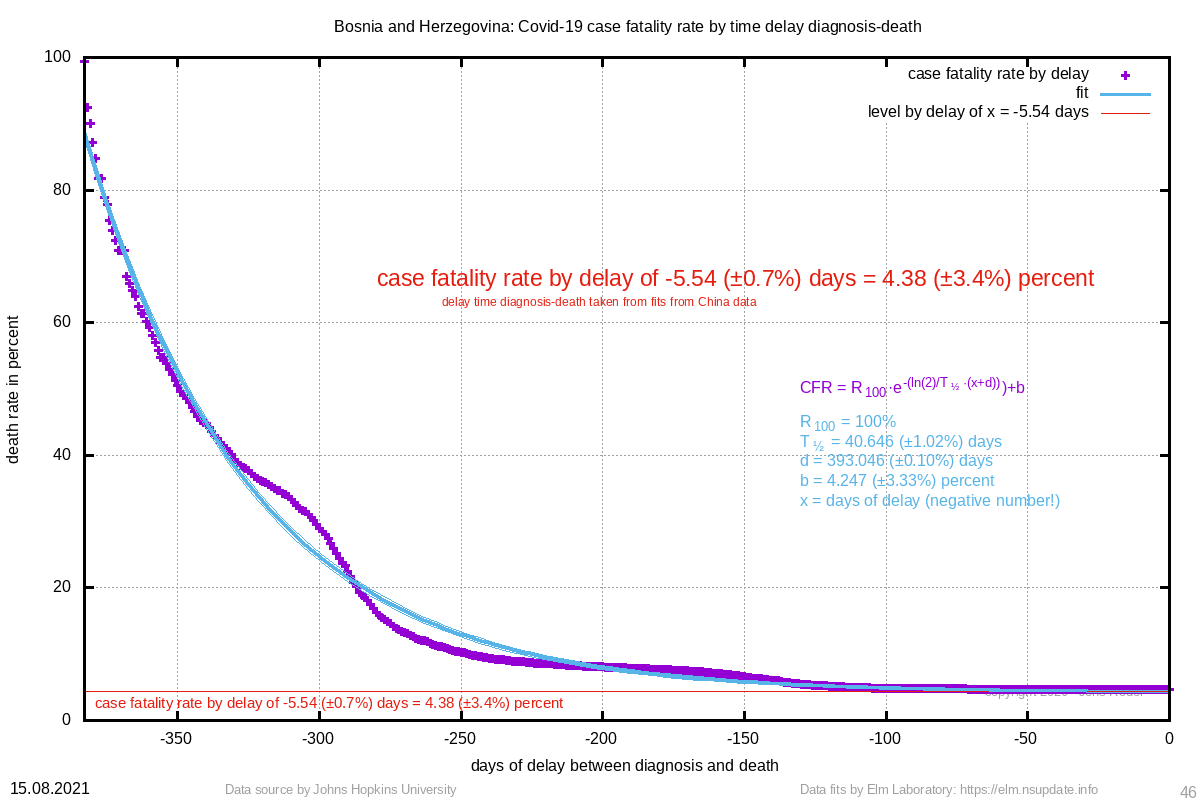 | 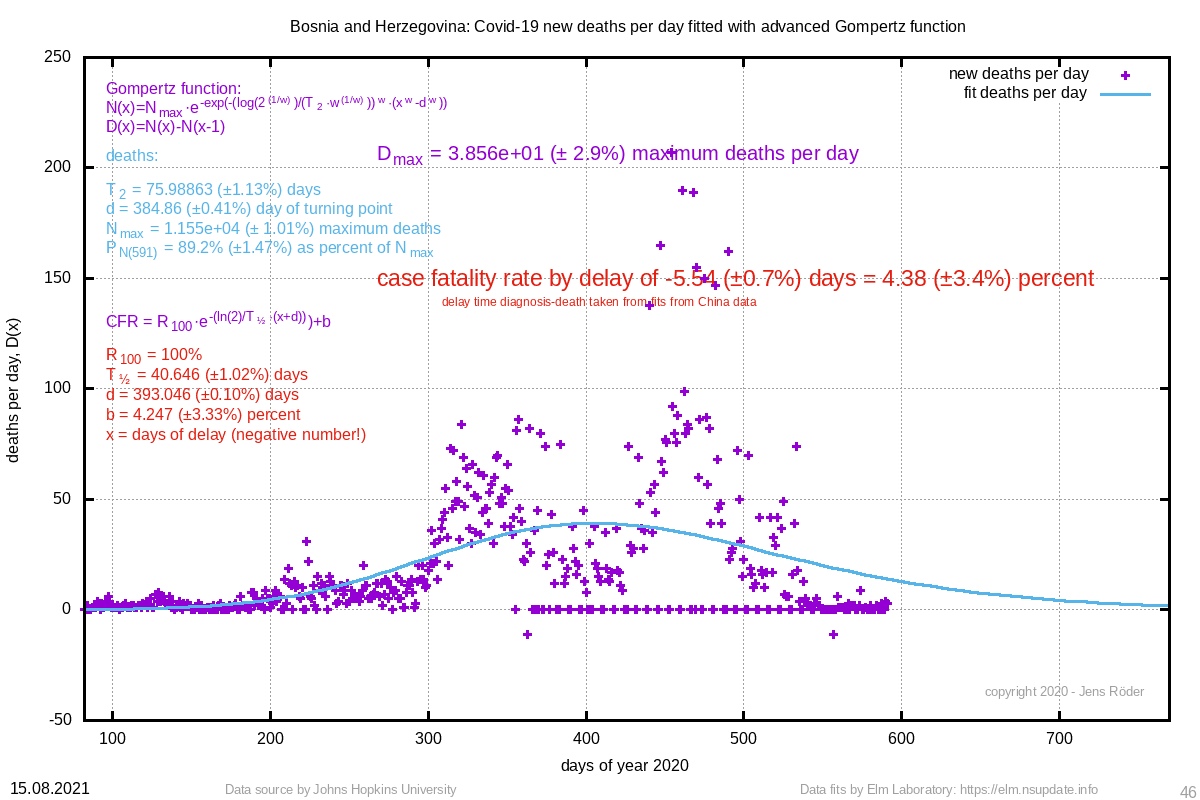 | 75.989 (±1.1%) | 384.86 (±0.4%) |
| 7000 Afghanistan | 160987727 (±538.3%) | 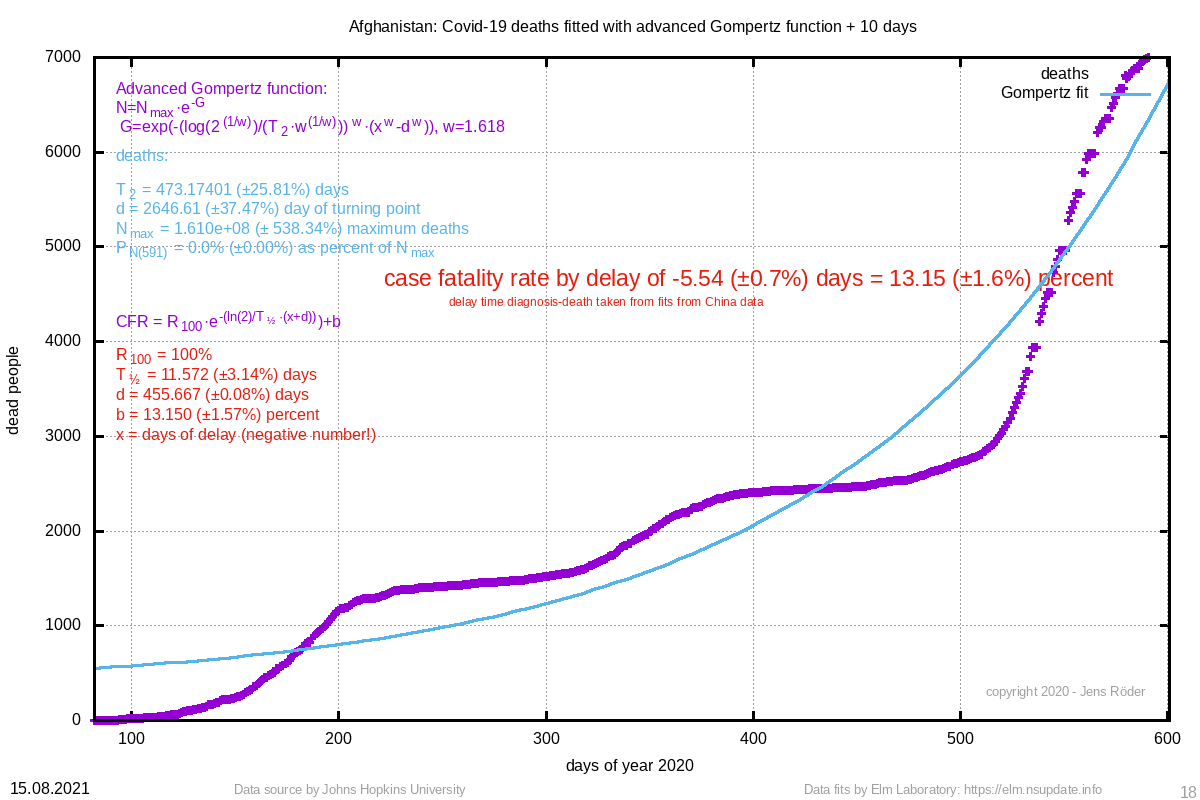 | 13.15 (±1.6%) | 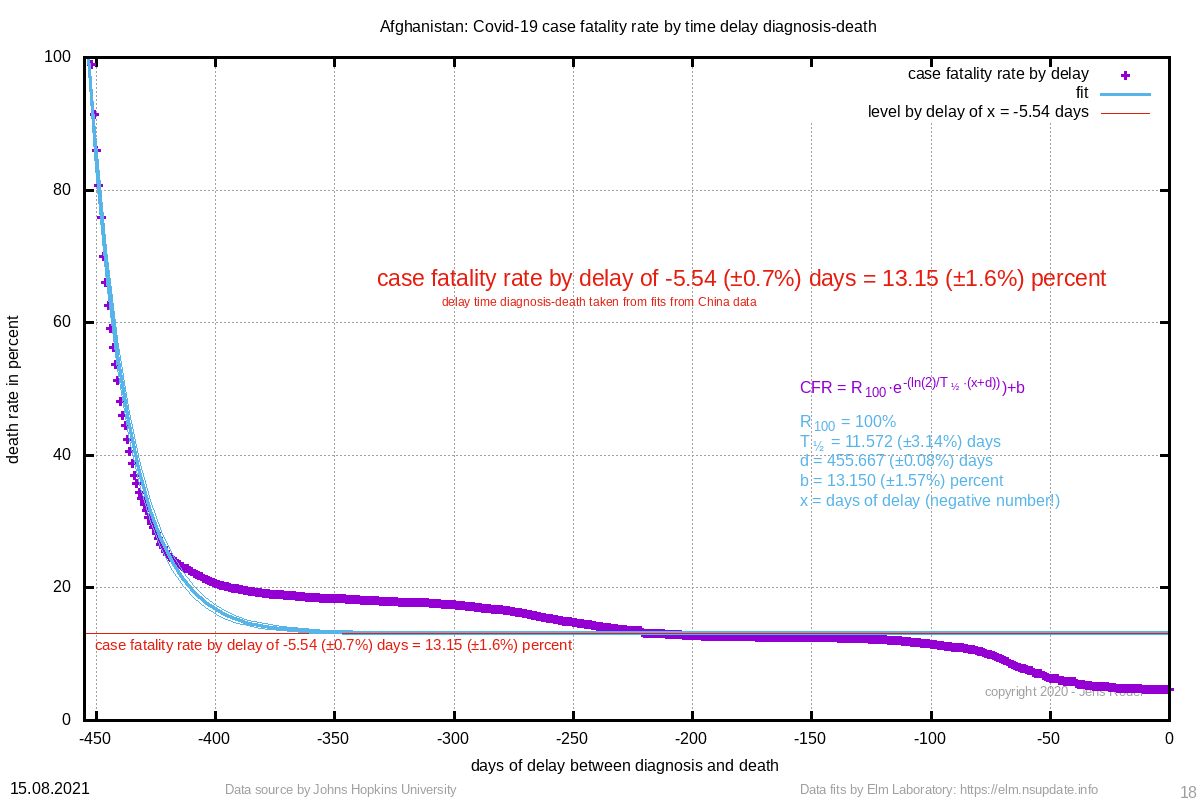 | 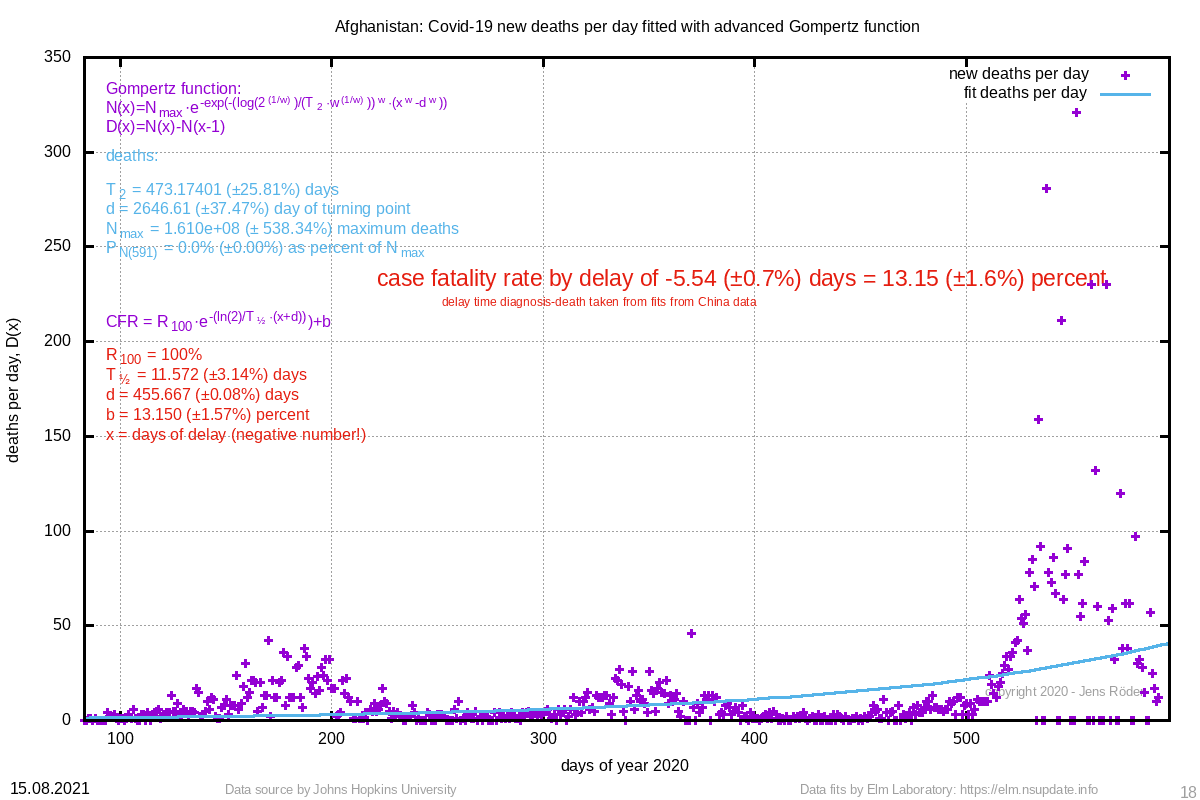 | 473.174 (±25.8%) | 2646.61 (±37.5%) |
| 5532 North Macedonia | 6818 (±1.1%) |  | 2.54 (±8.8%) |  | 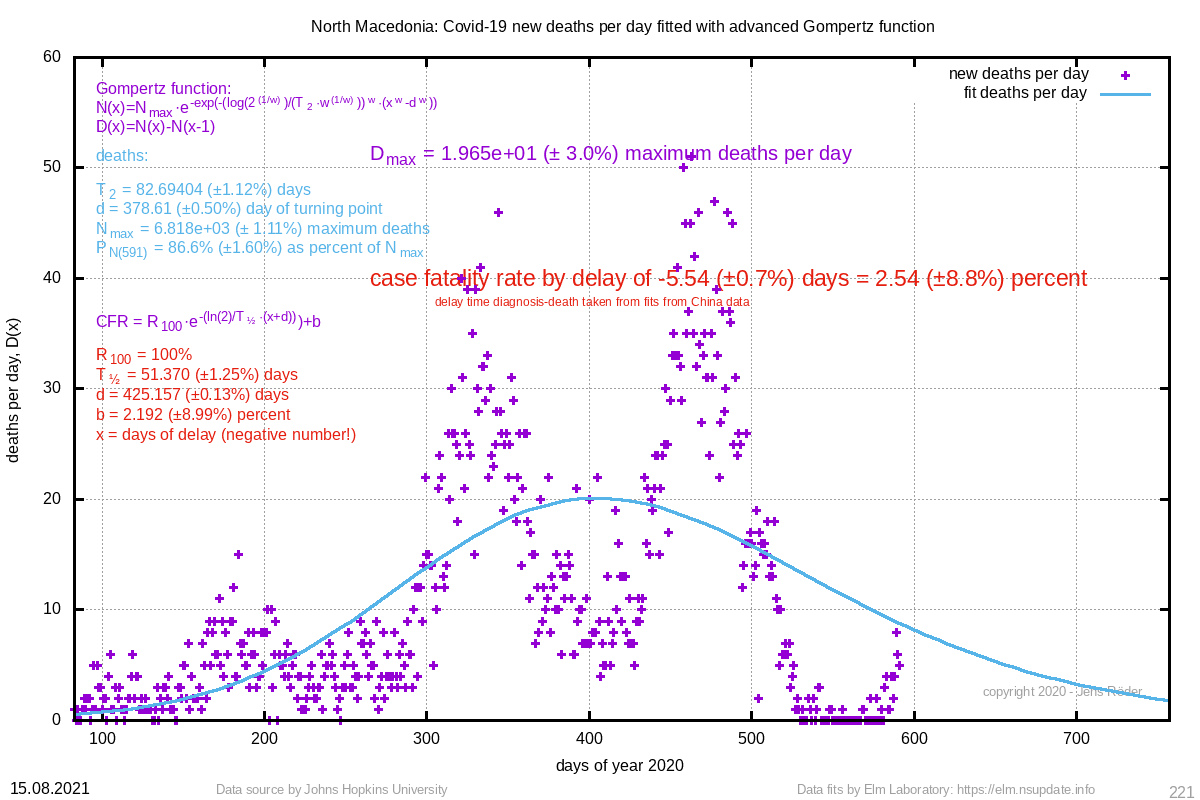 | 82.694 (±1.1%) | 378.61 (±0.5%) |
| 5125 Azerbaijan | 5578 (±0.9%) | 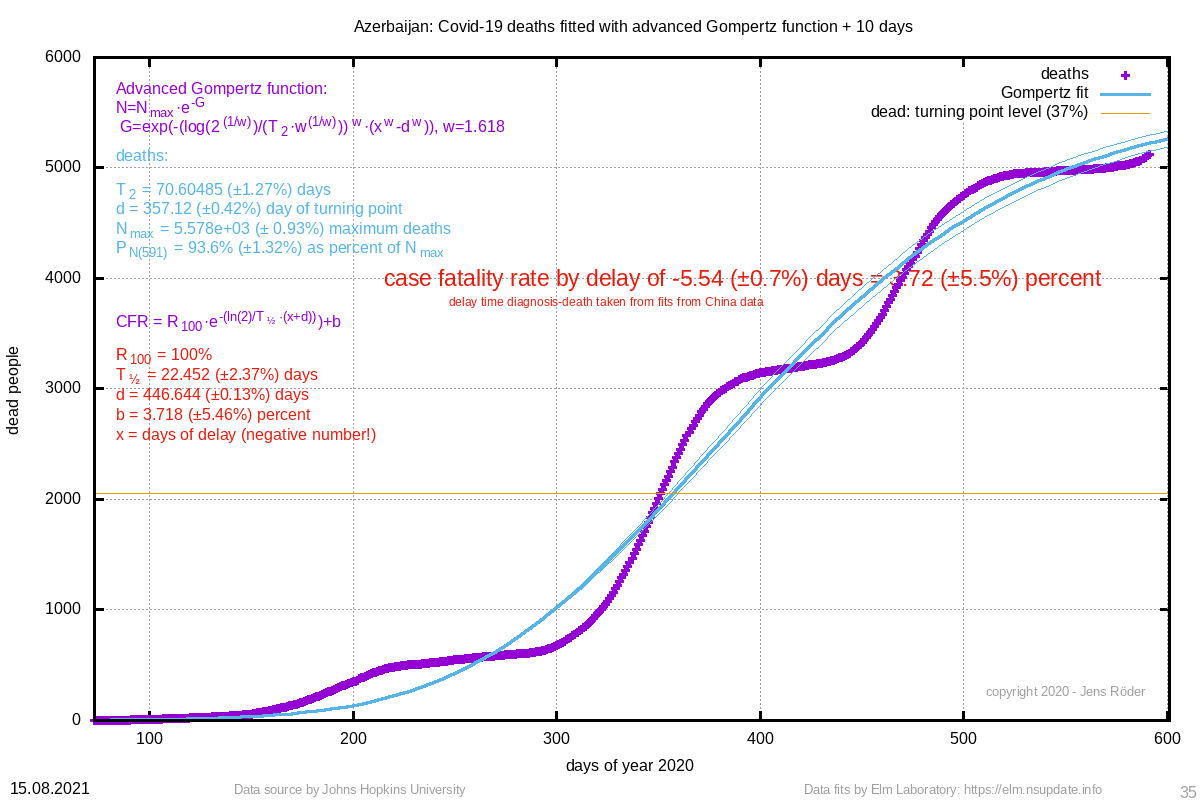 | 3.72 (±5.5%) | 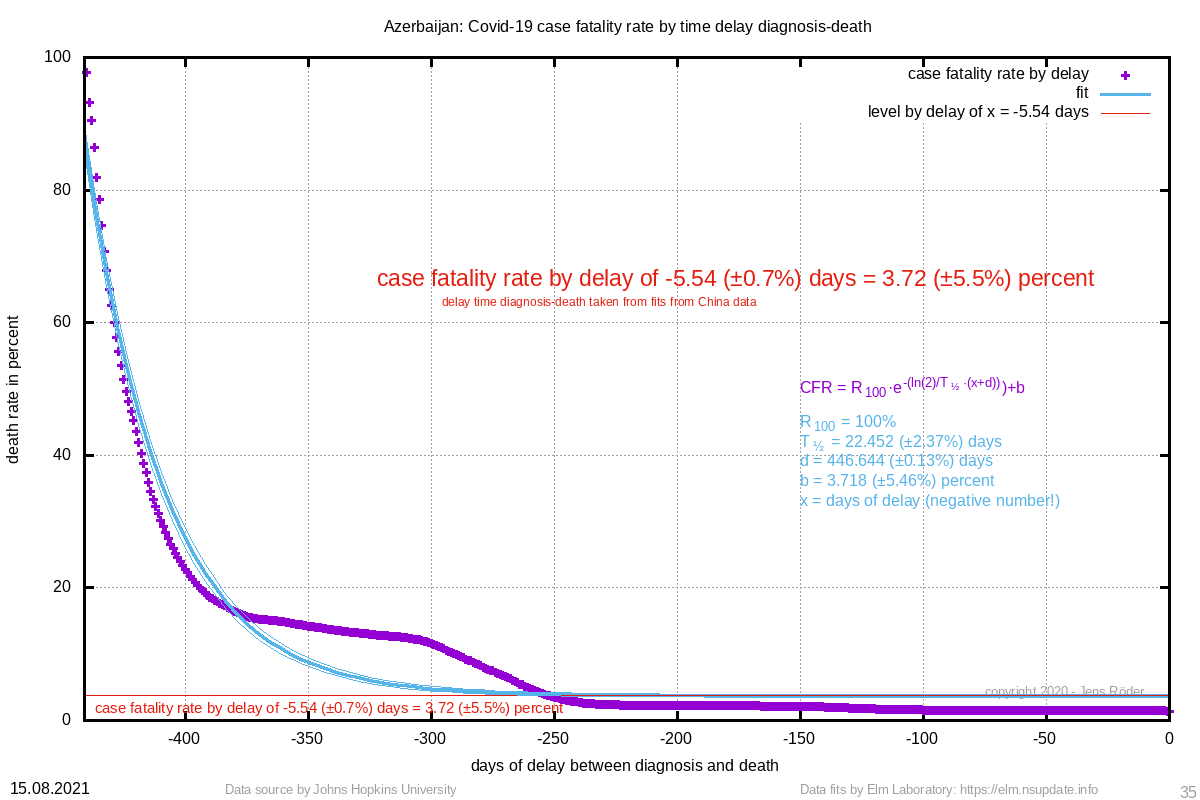 | 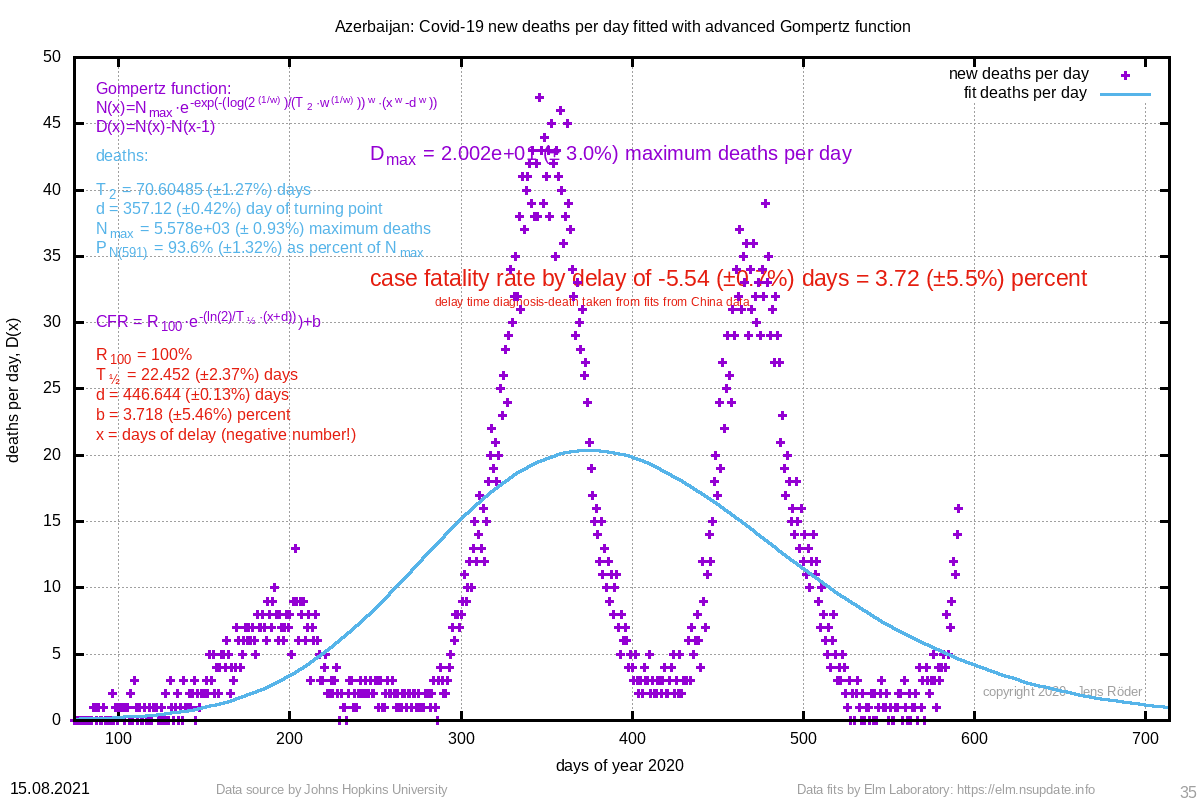 | 70.605 (±1.3%) | 357.12 (±0.4%) |
| 4730 Algeria | 4030 (±0.8%) | 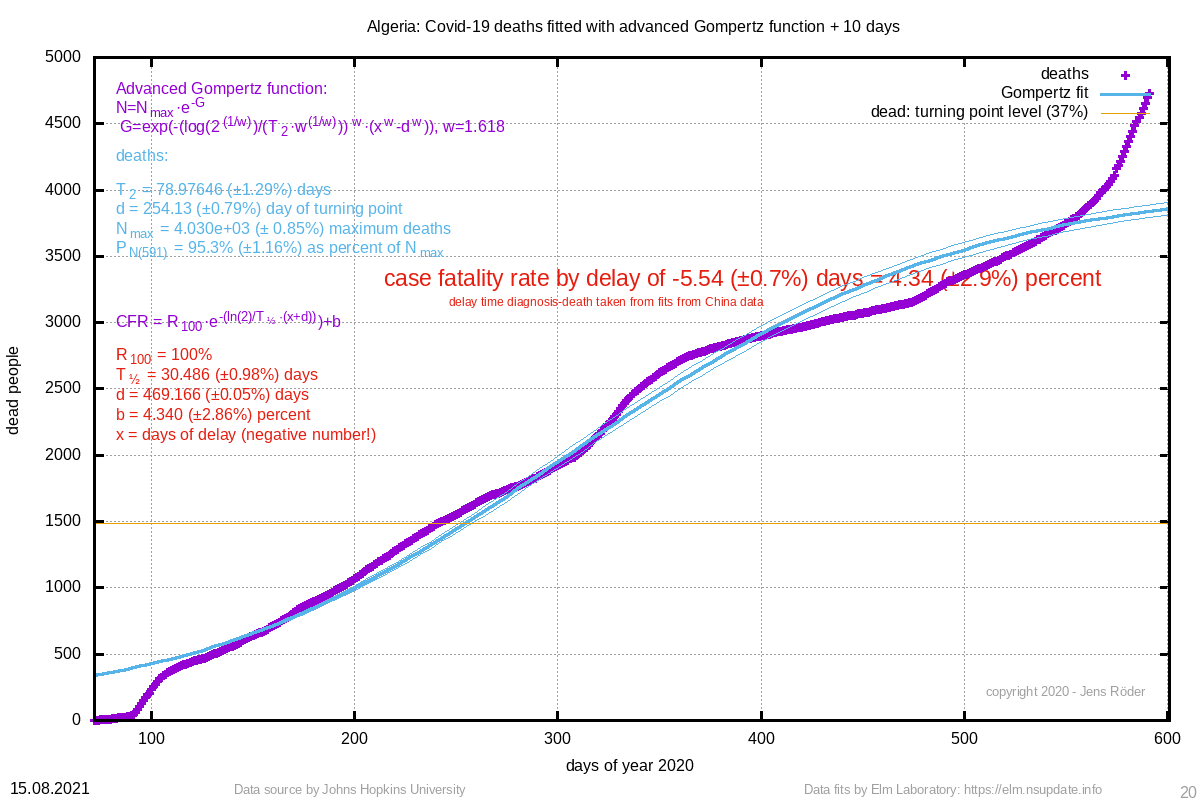 | 4.34 (±2.9%) | 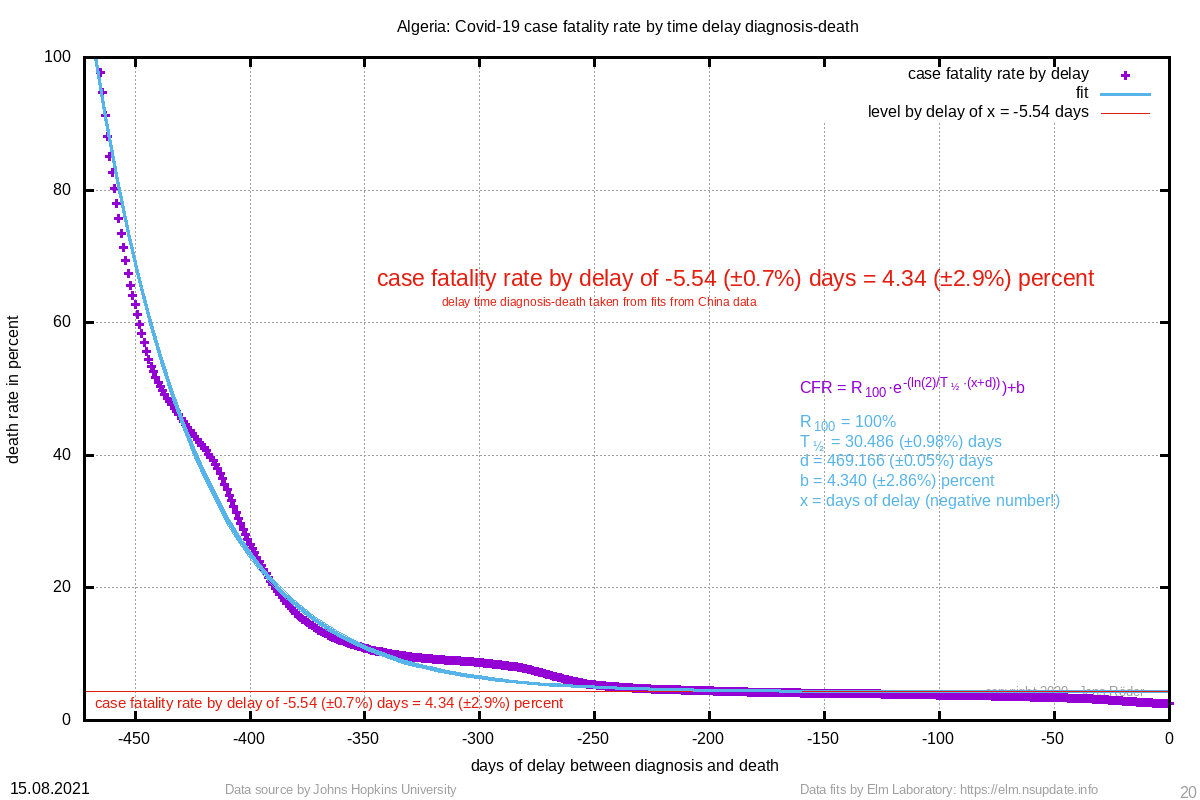 | 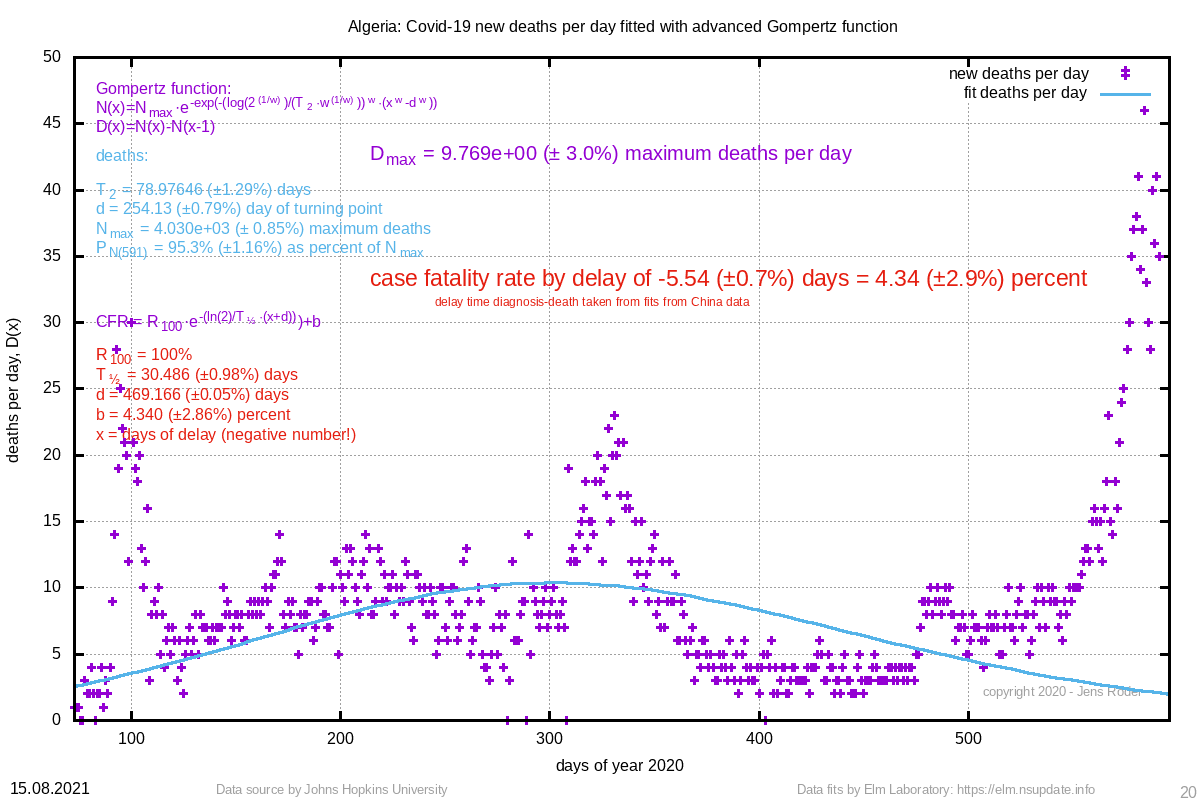 | 78.976 (±1.3%) | 254.13 (±0.8%) |
| 4678 Armenia | 5013 (±0.7%) | 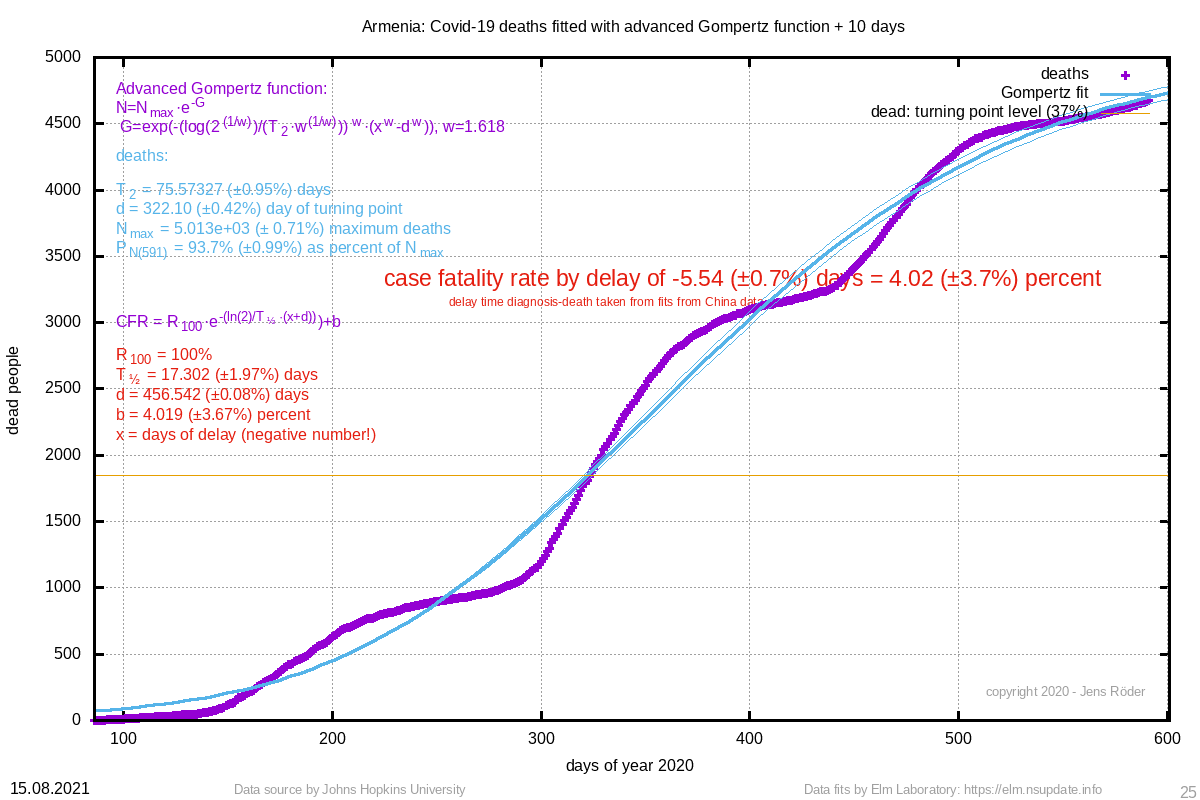 | 4.02 (±3.7%) | 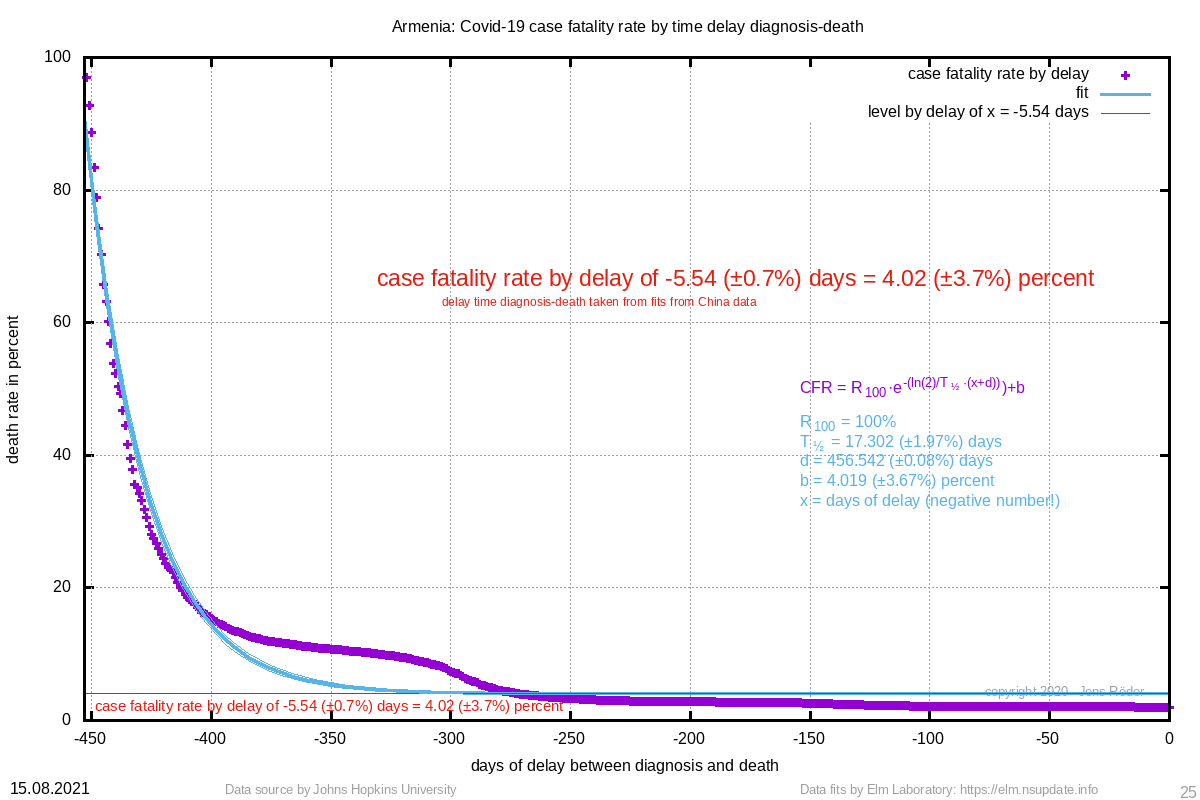 |  | 75.573 (±0.9%) | 322.10 (±0.4%) |
| 4460 Ethiopia | 5763 (±2.0%) | 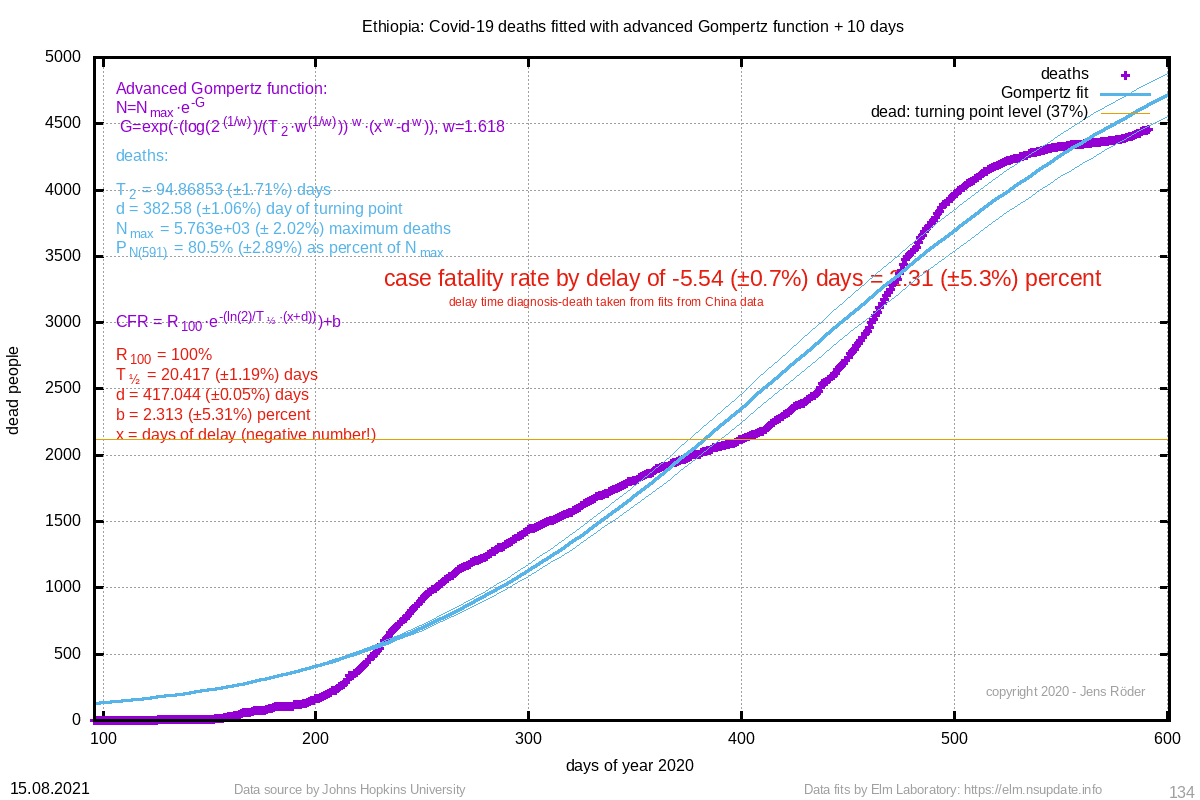 | 2.31 (±5.3%) | 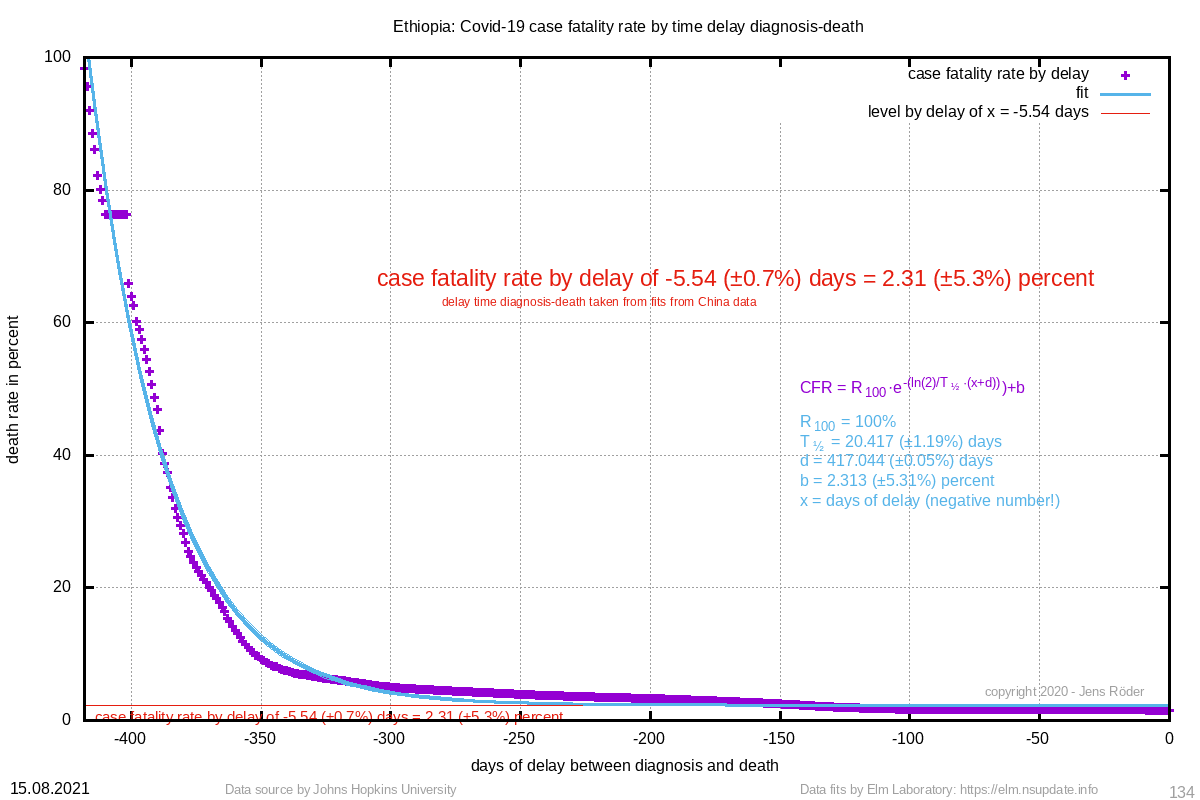 | 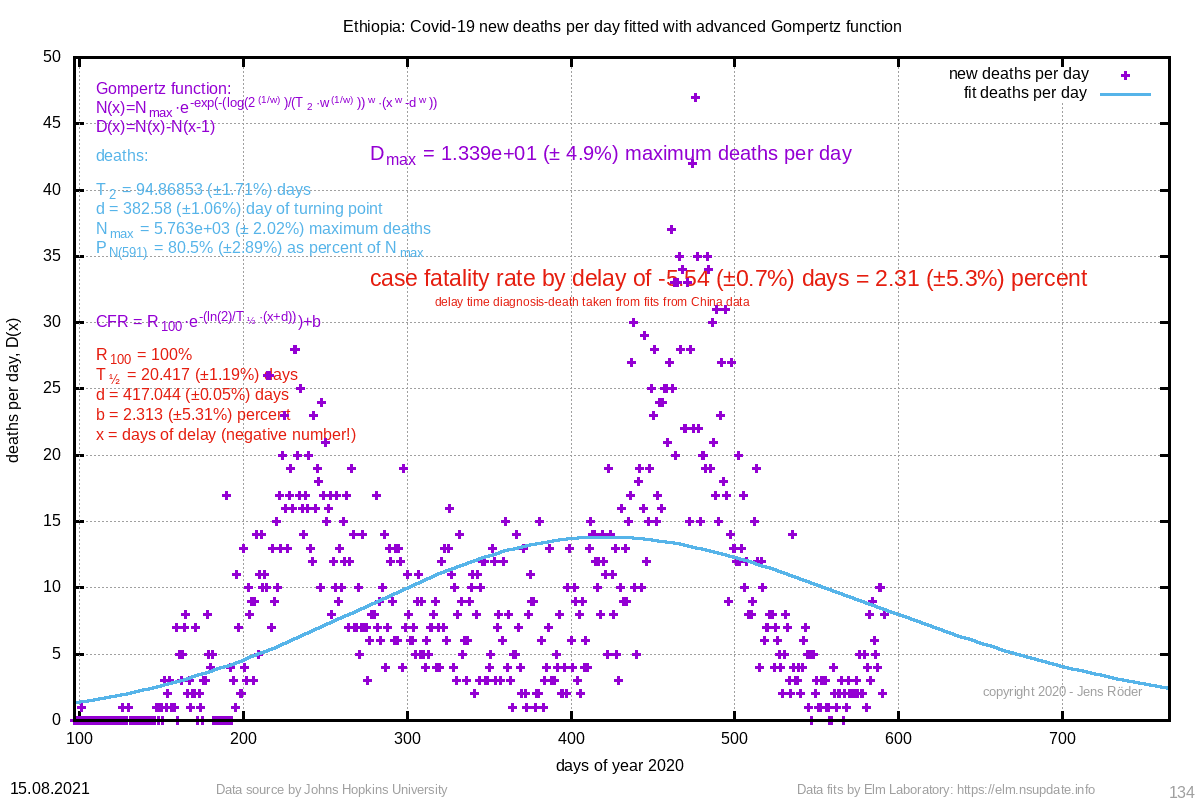 | 94.869 (±1.7%) | 382.58 (±1.1%) |
| 3976 Dominican Republic | 3922 (±0.8%) | 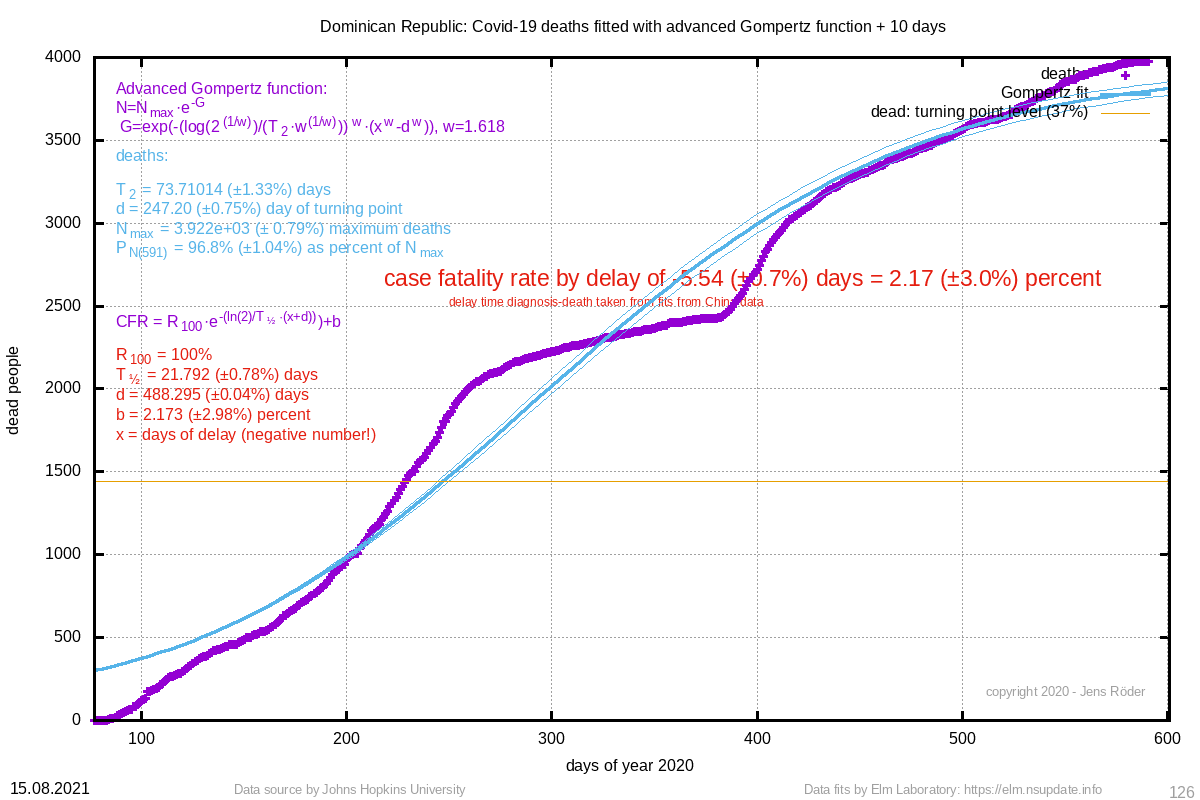 | 2.17 (±3.0%) |  | 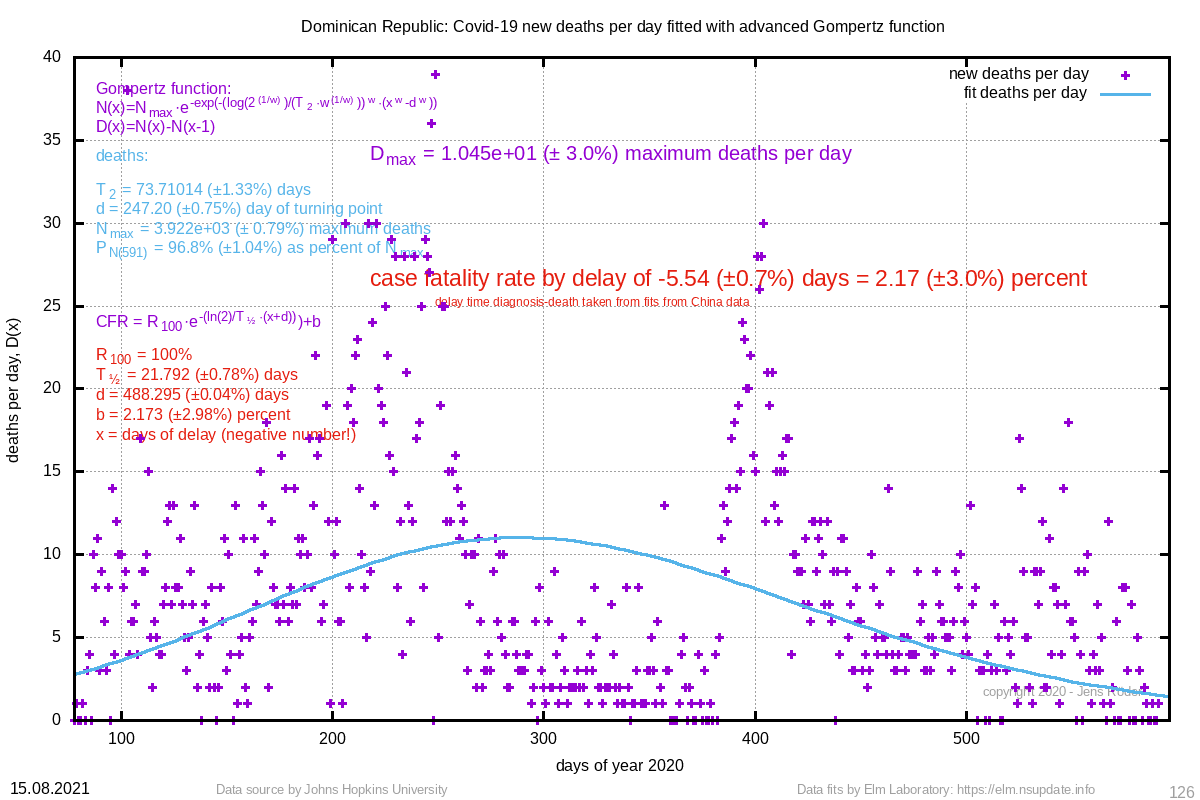 | 73.710 (±1.3%) | 247.20 (±0.8%) |
| 3842 Cuba | 3515509483 (±448.0%) | 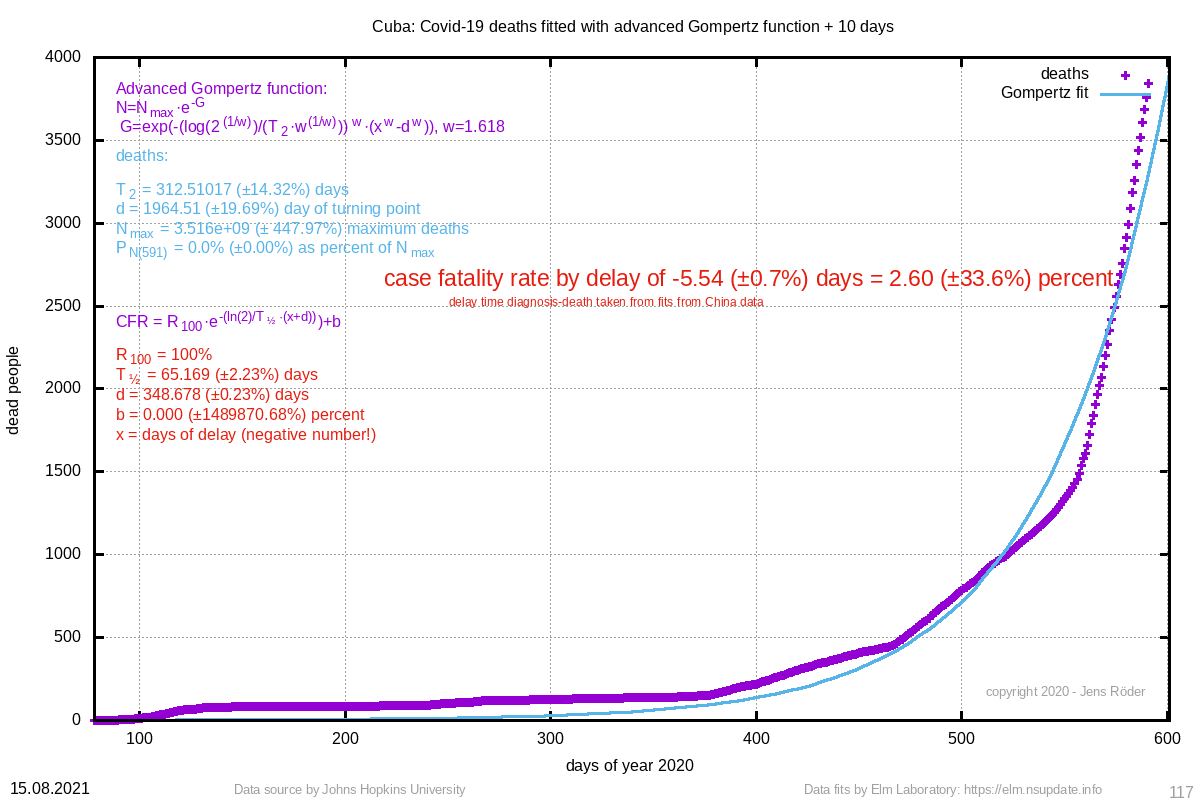 | 2.60 (±33.6%) | 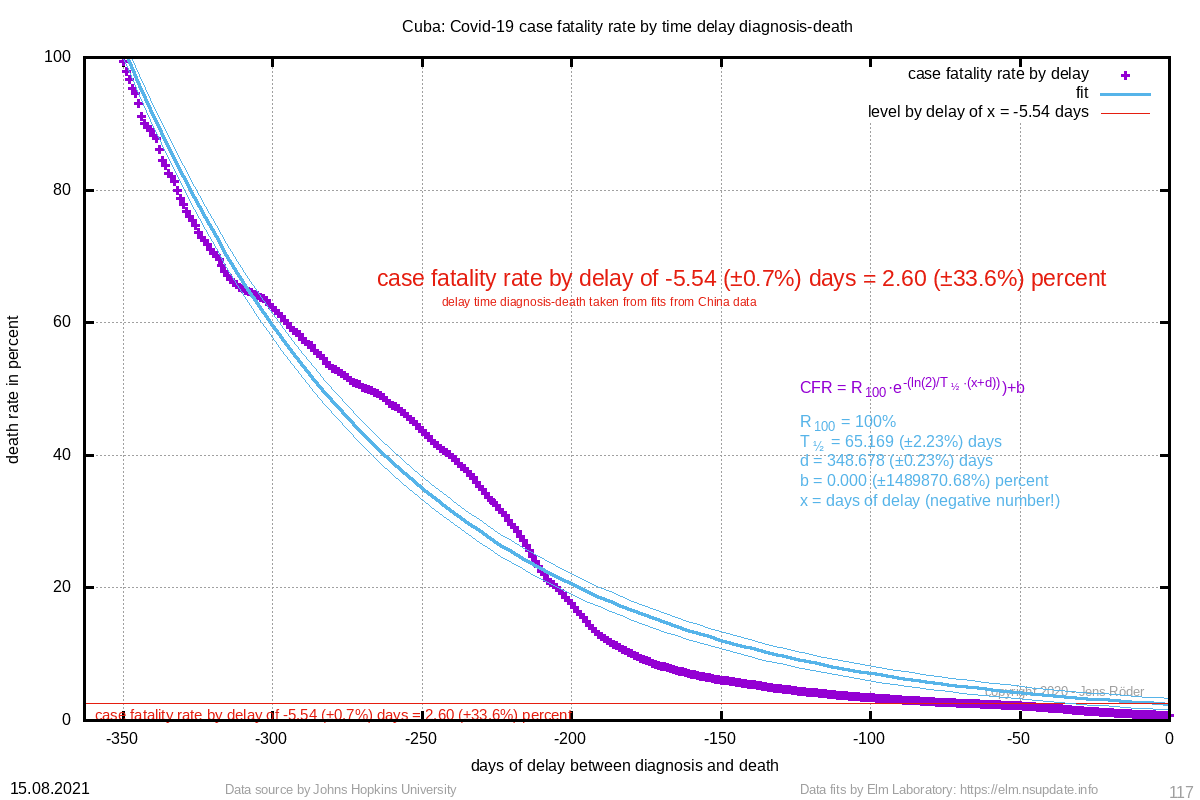 | 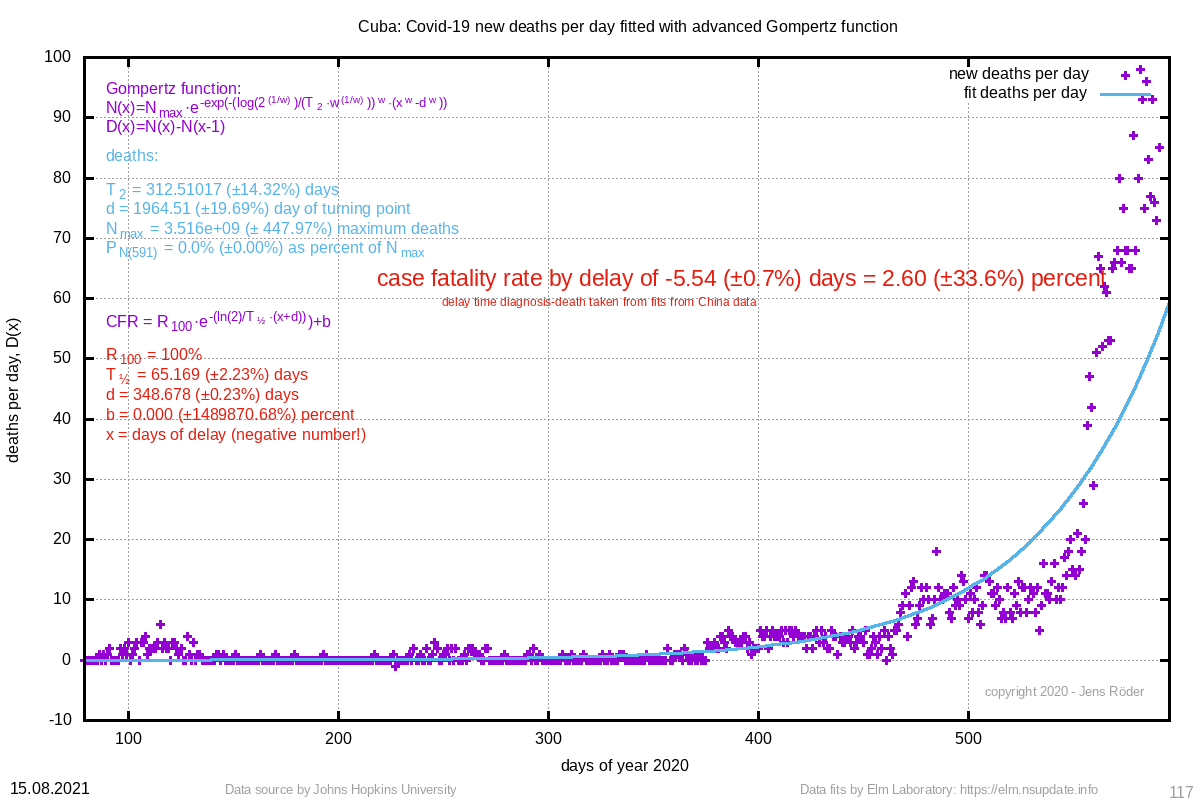 | 312.510 (±14.3%) | 1964.51 (±19.7%) |
| 3582 Belarus | 4983 (±1.1%) | 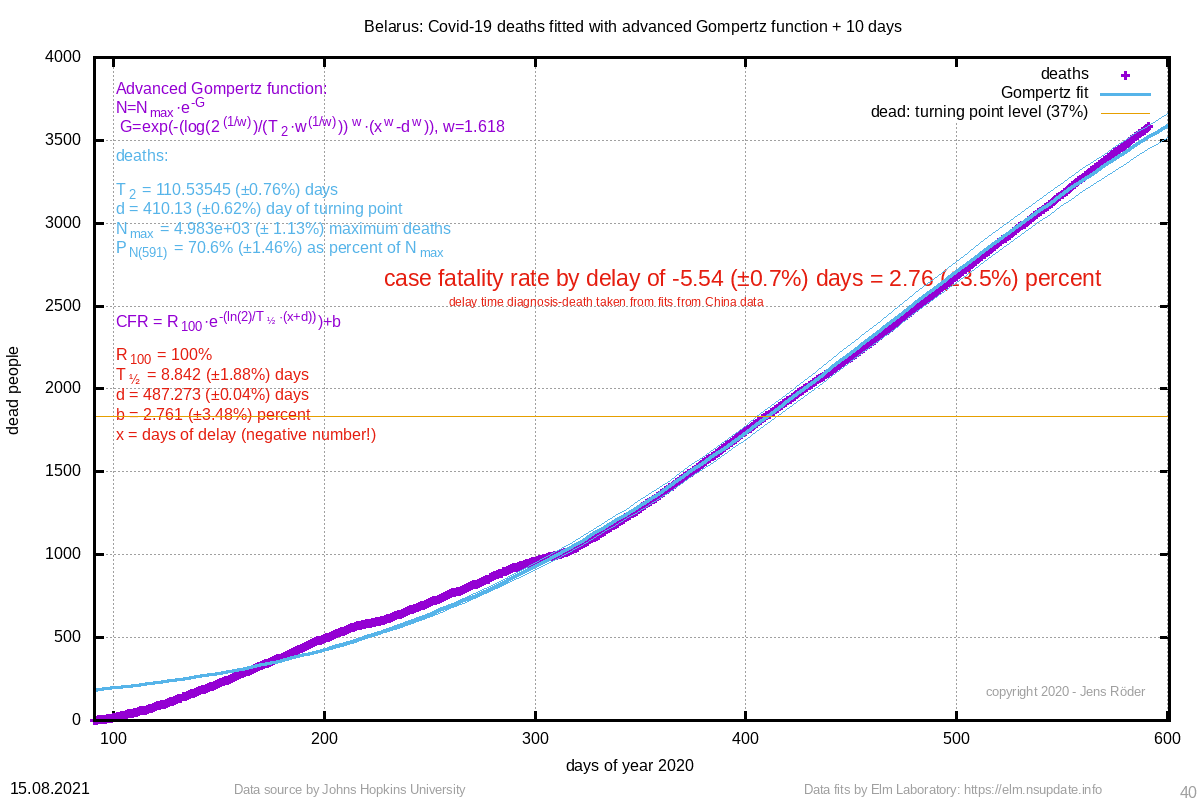 | 2.76 (±3.5%) | 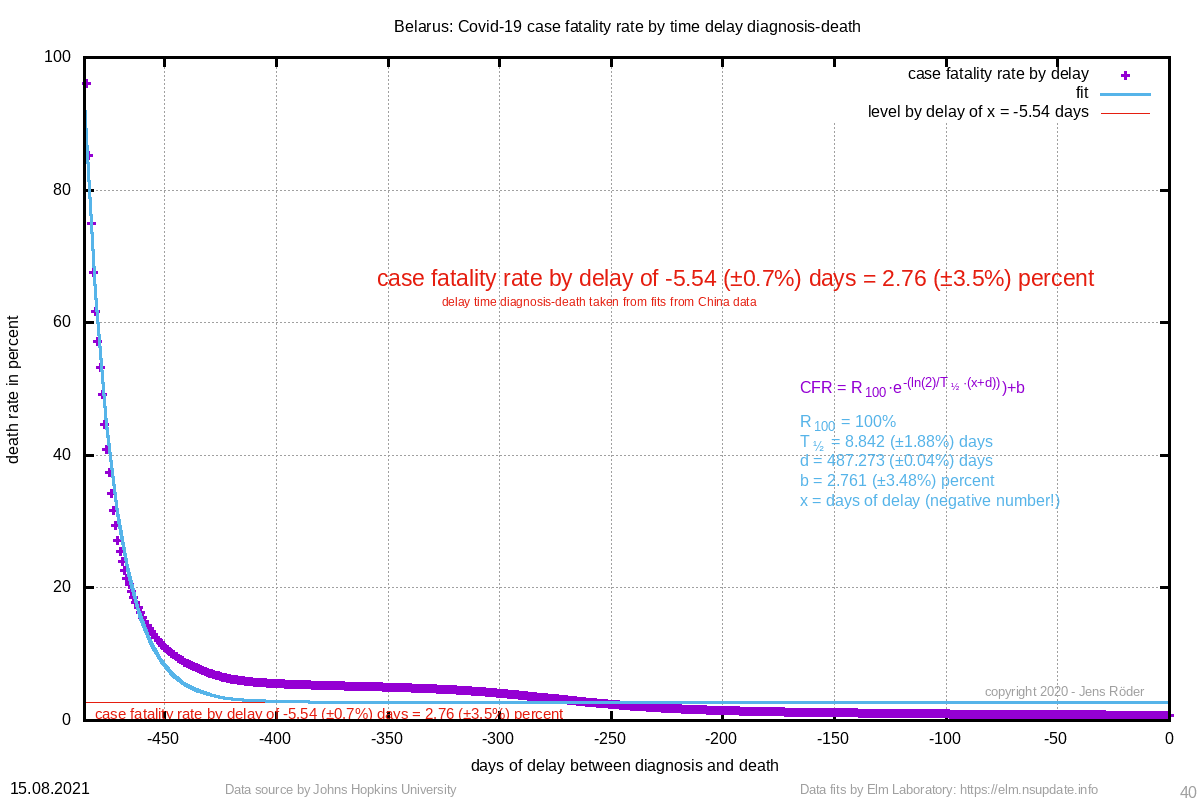 | 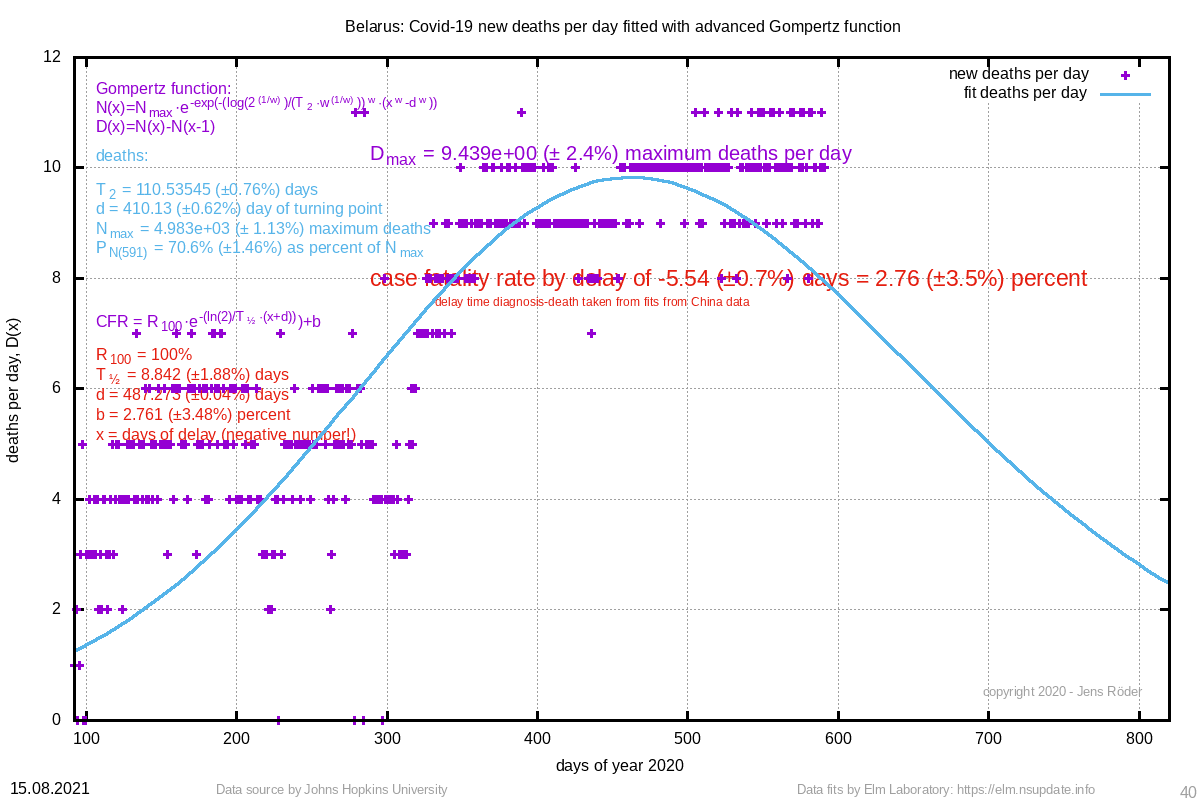 | 110.535 (±0.8%) | 410.13 (±0.6%) |
| 2558 Denmark | 3174 (±2.5%) | 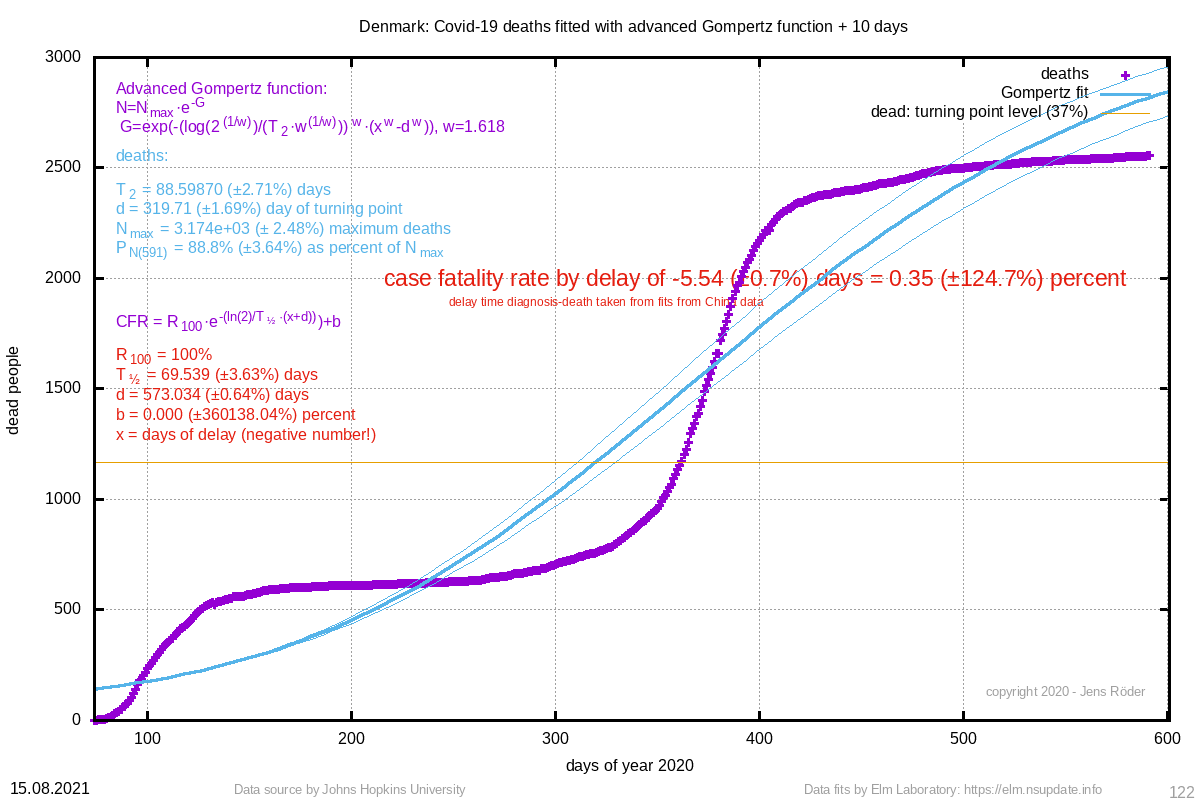 | fiterr (±err) |  |  | 88.599 (±2.7%) | 319.71 (±1.7%) |
| 2461 Albania | 2724 (±0.6%) |  | 2.13 (±4.4%) | 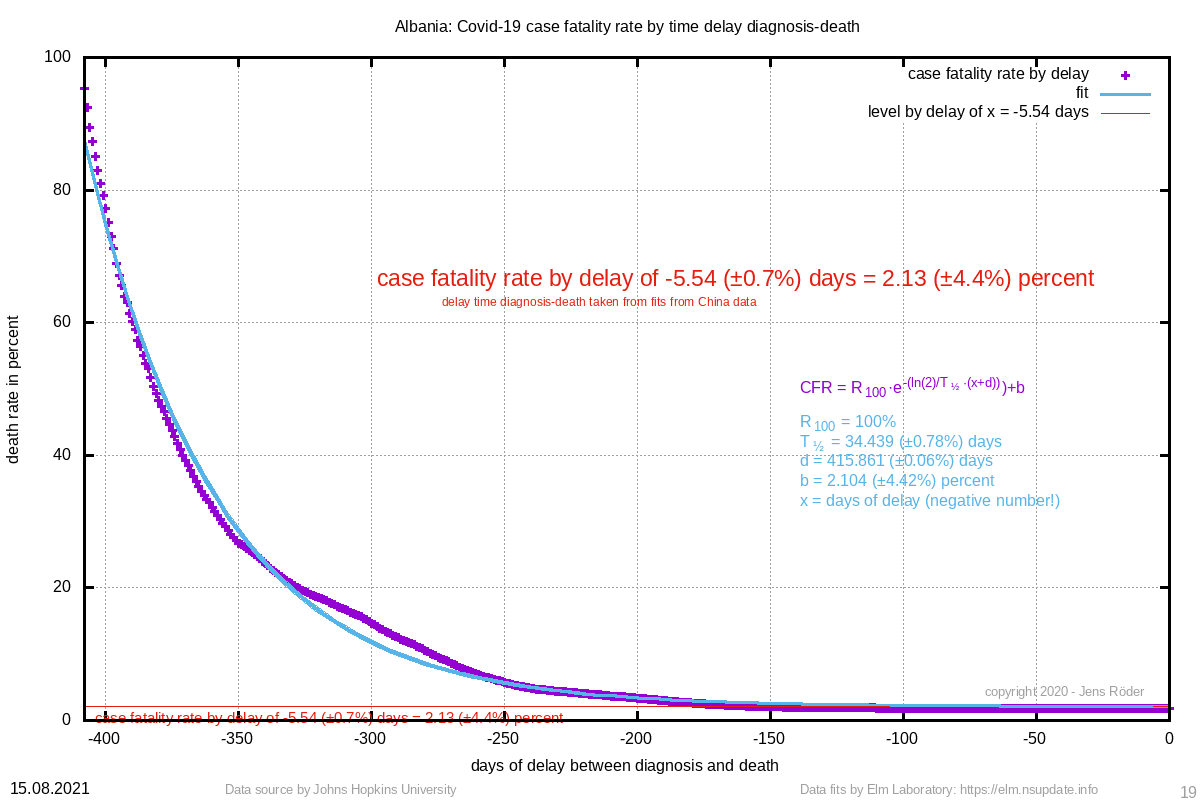 | 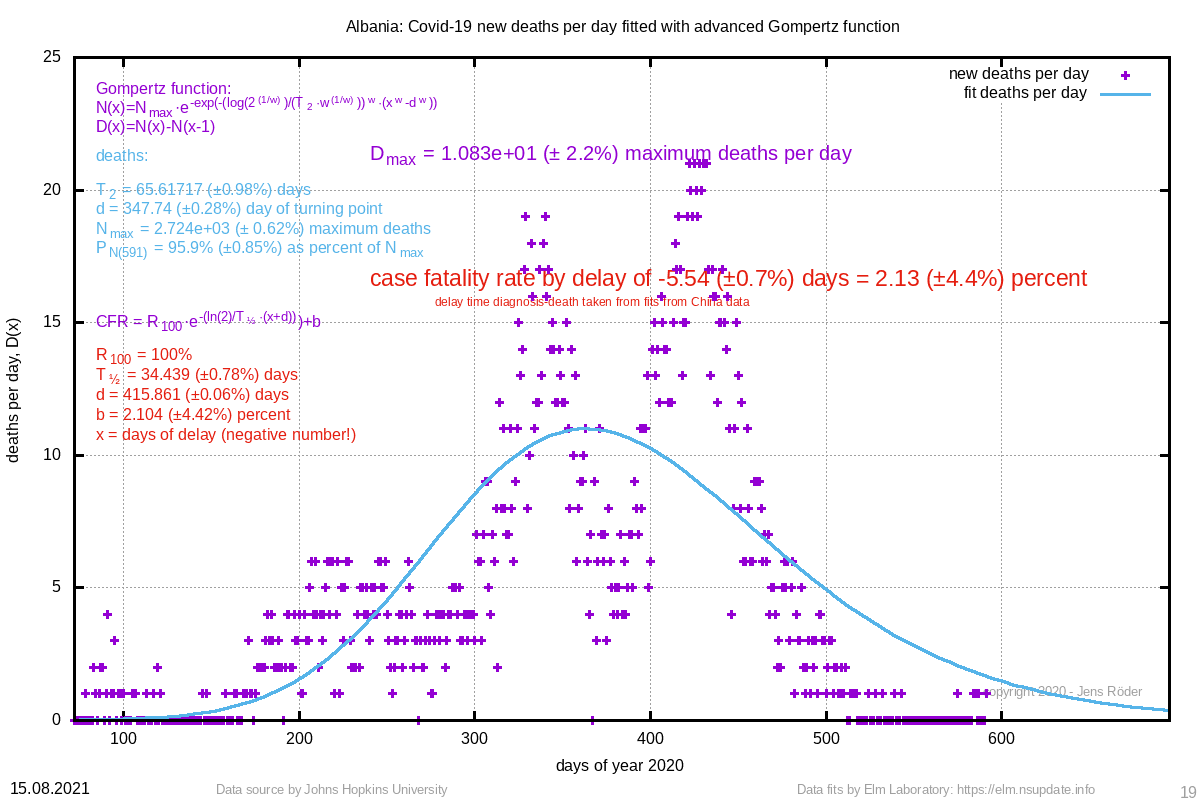 | 65.617 (±1.0%) | 347.74 (±0.3%) |
| 2332 Alberta, Canada | 2356 (±0.6%) | 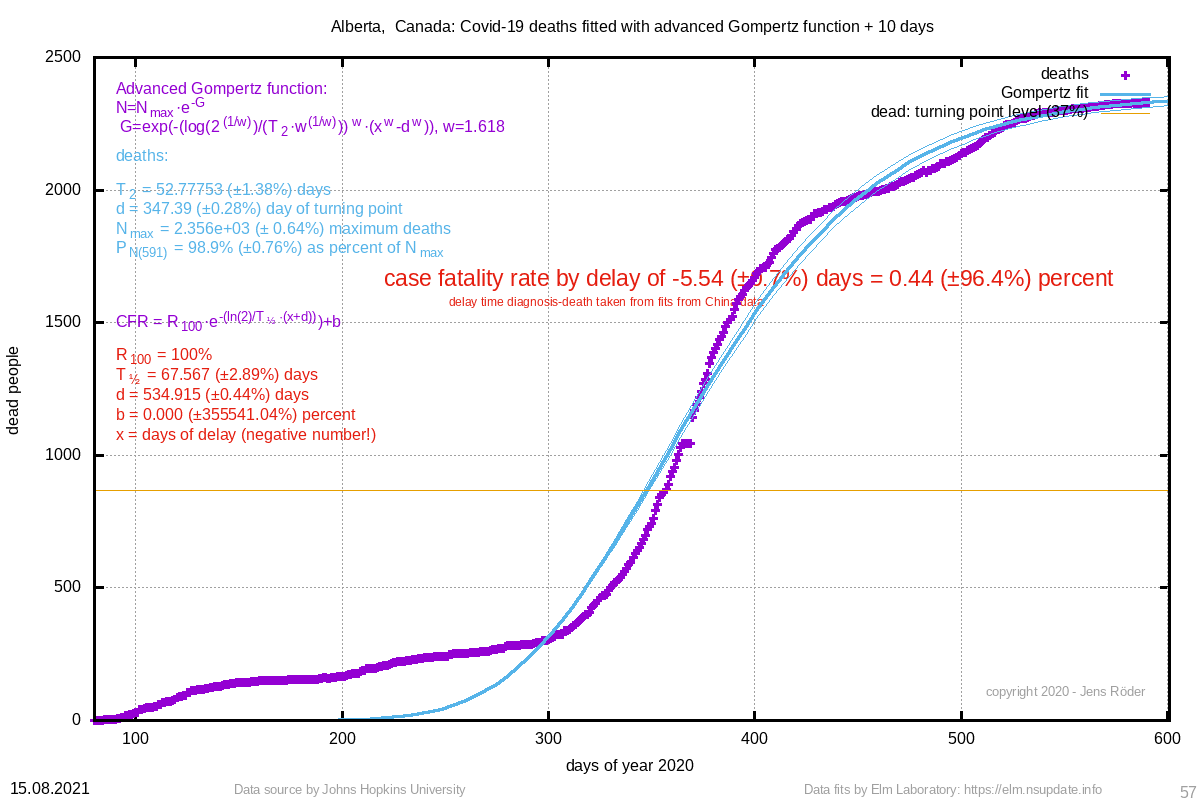 | fiterr (±err) |  | 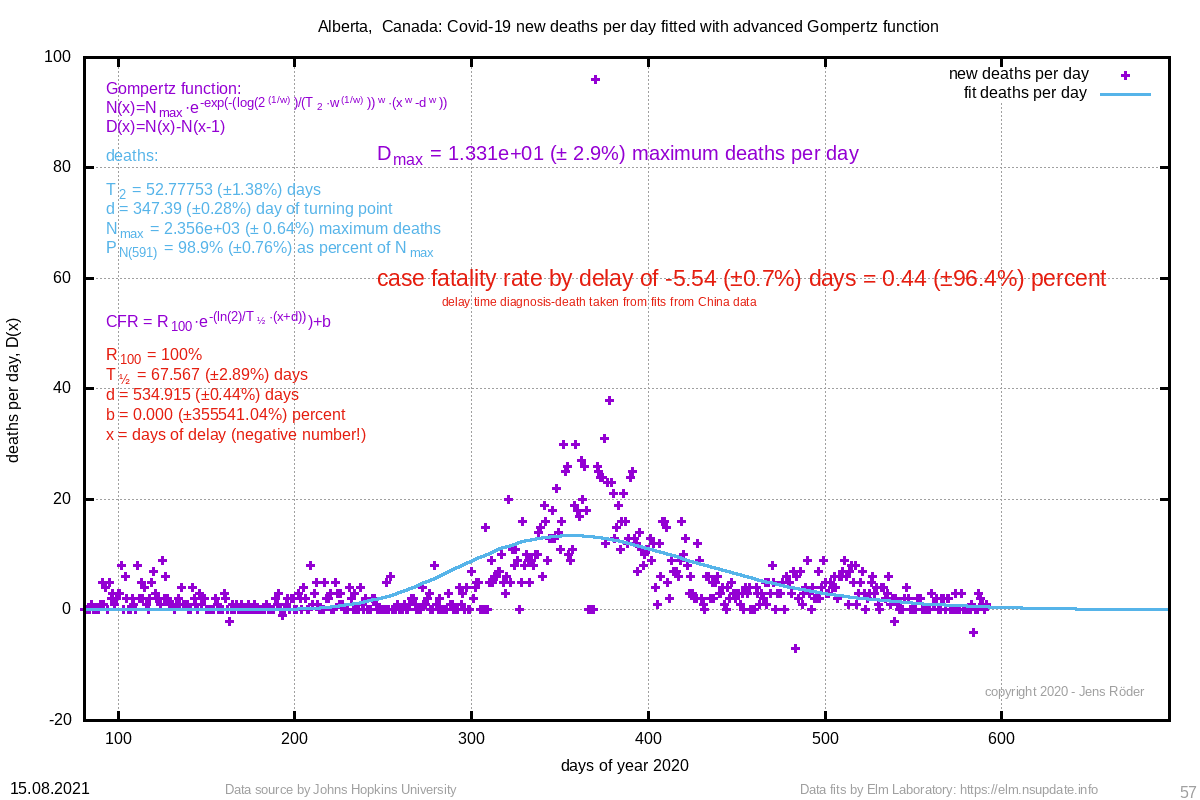 | 52.778 (±1.4%) | 347.39 (±0.3%) |
| 2211 Nigeria | 2275 (±1.1%) | 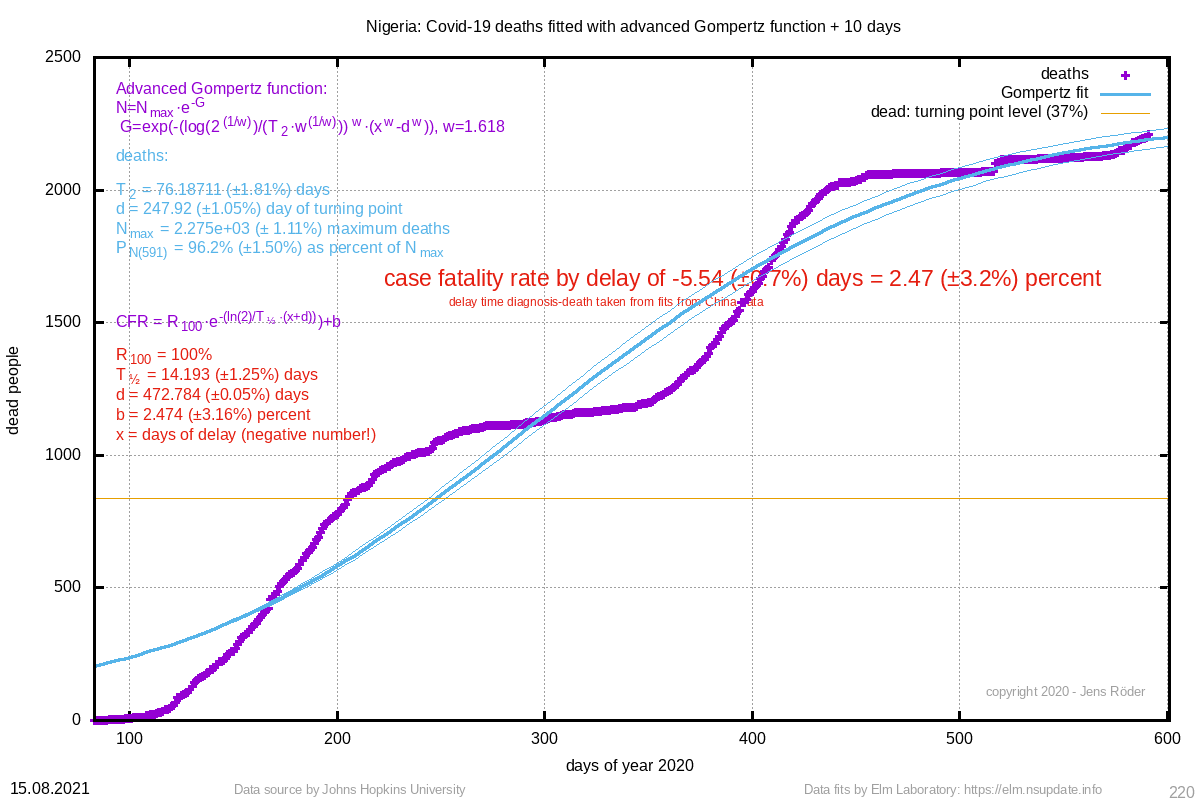 | 2.47 (±3.2%) | 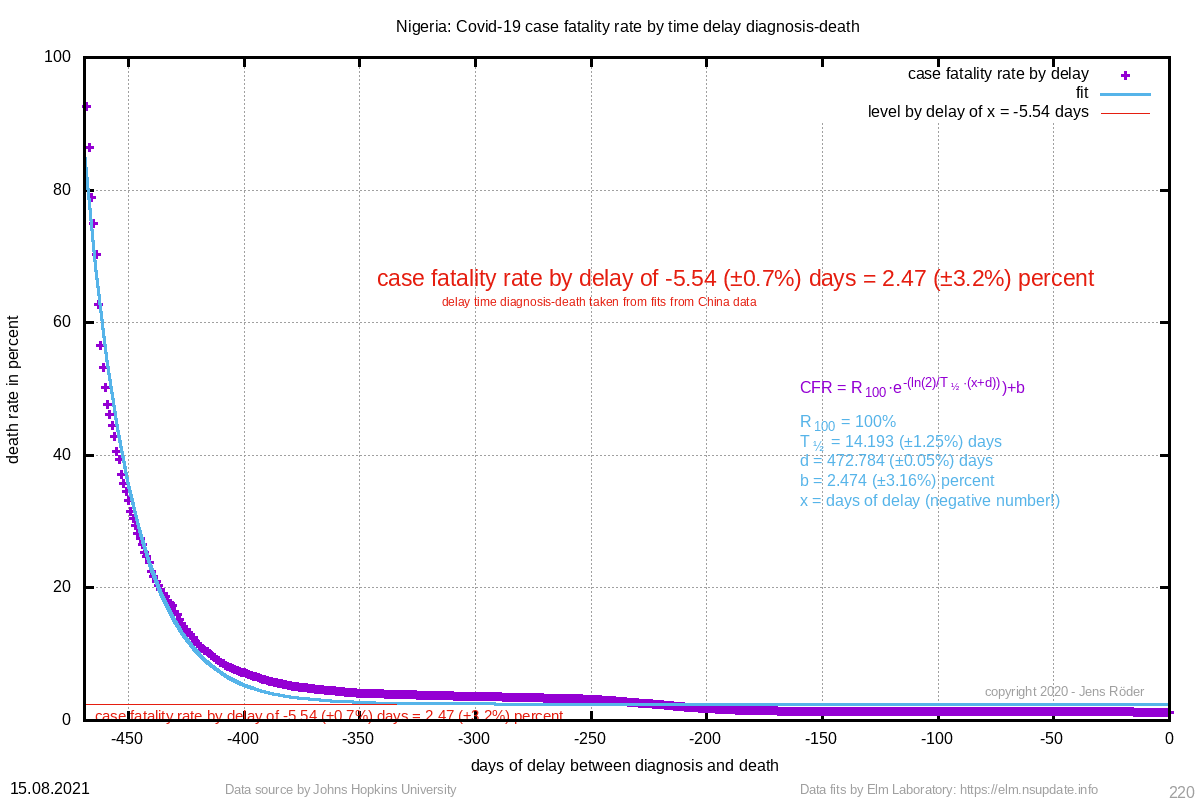 | 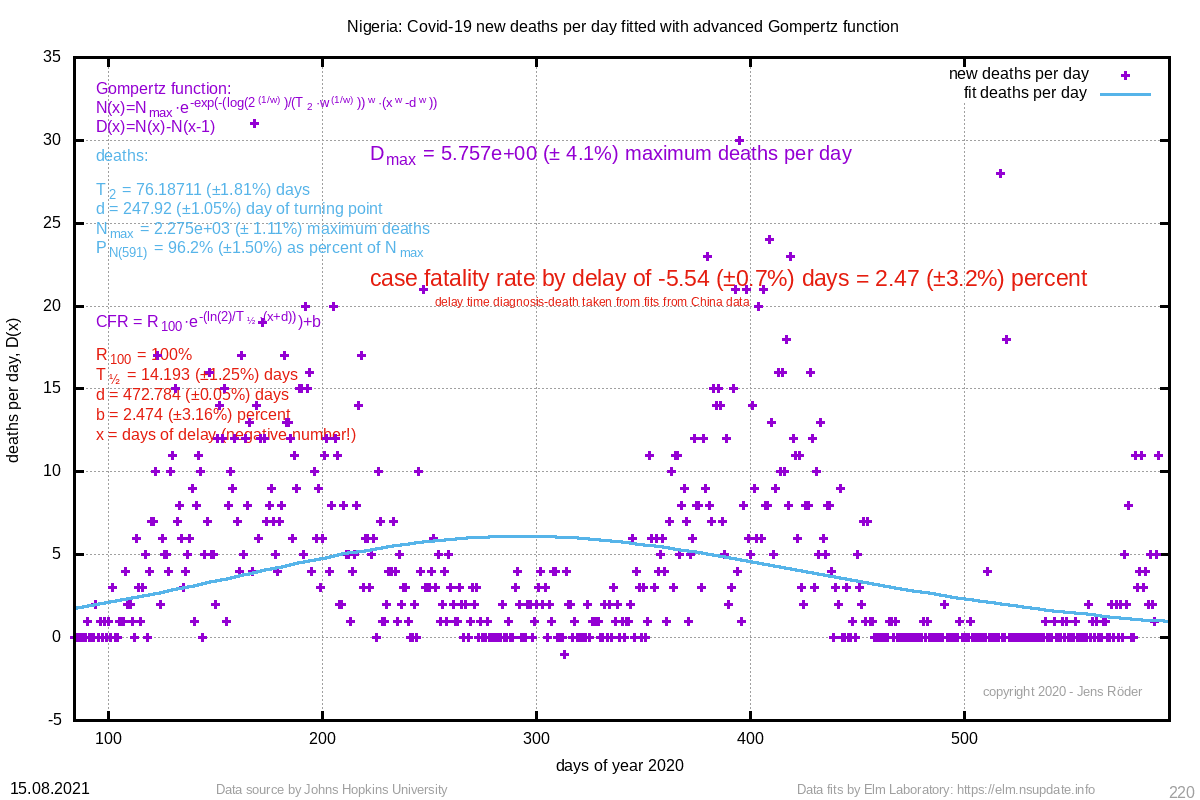 | 76.187 (±1.8%) | 247.92 (±1.1%) |
| 1973 Botswana | 5188 (±9.5%) |  | 3.47 (±6.0%) | 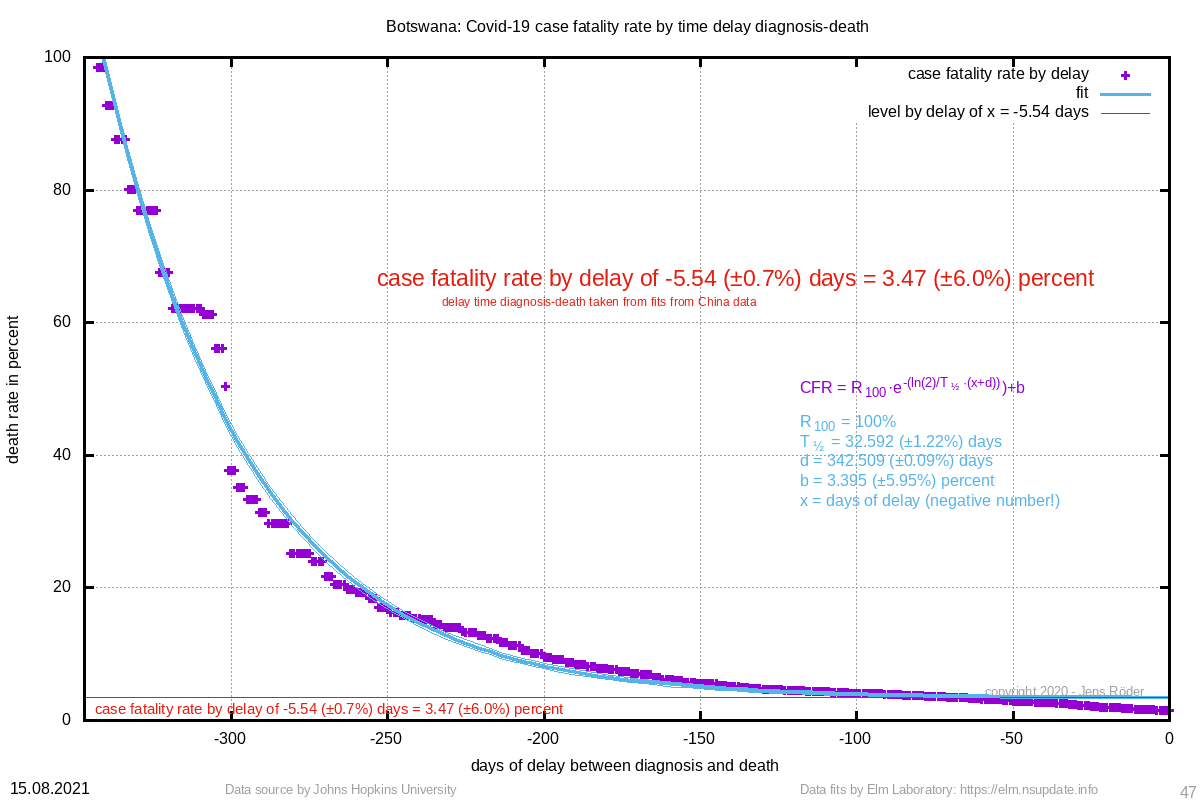 | 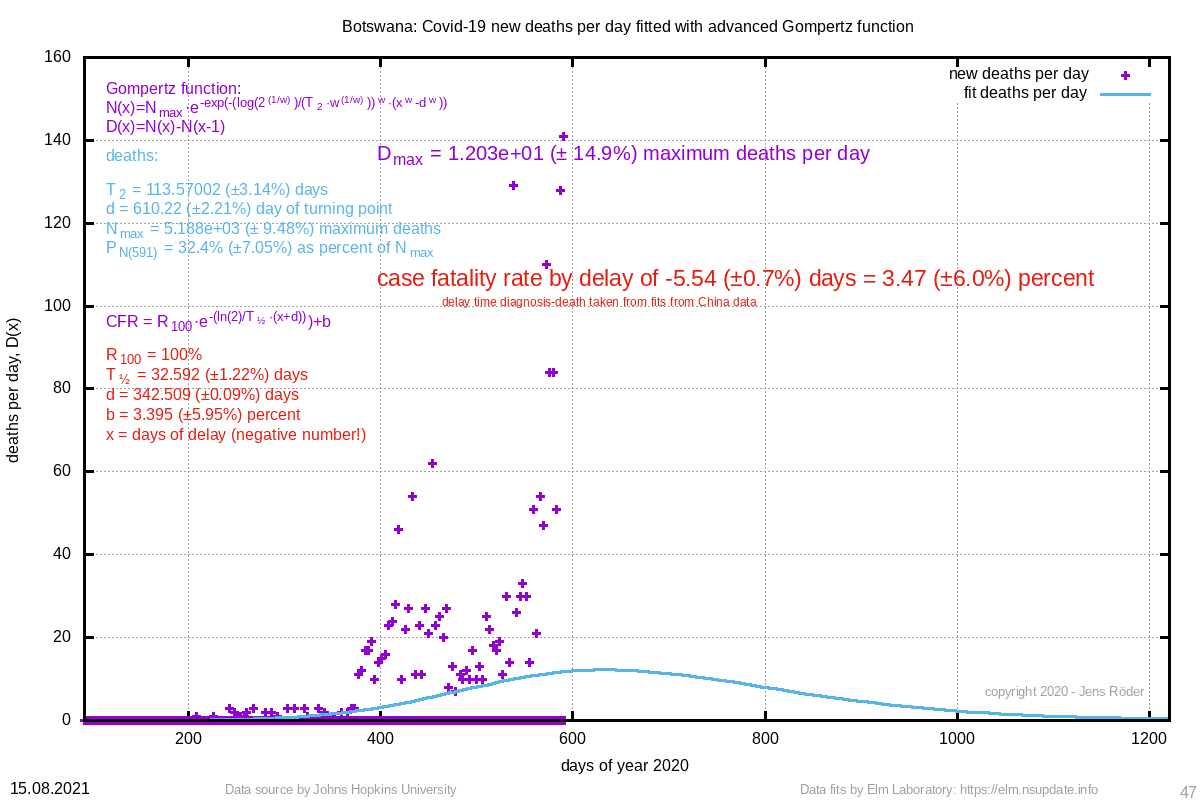 | 113.570 (±3.1%) | 610.22 (±2.2%) |
| 1640 Montenegro | 1837 (±0.5%) | 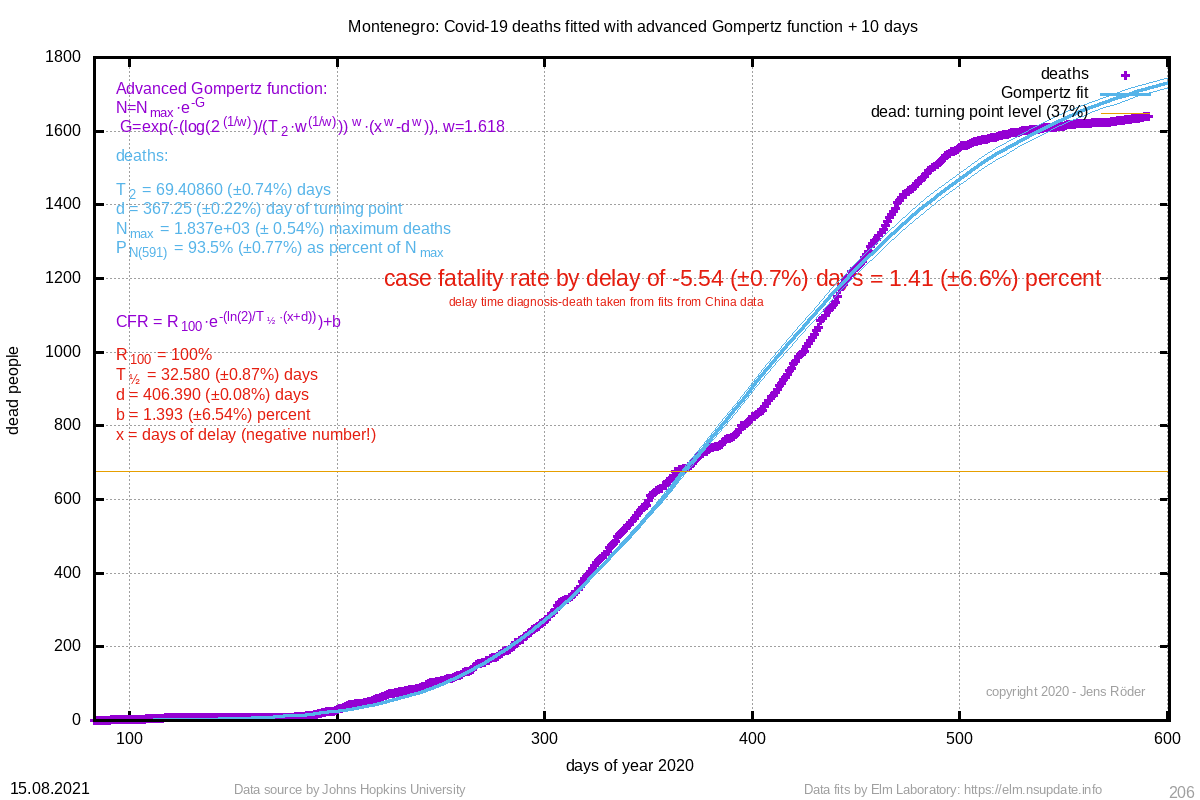 | 1.41 (±6.6%) |  | 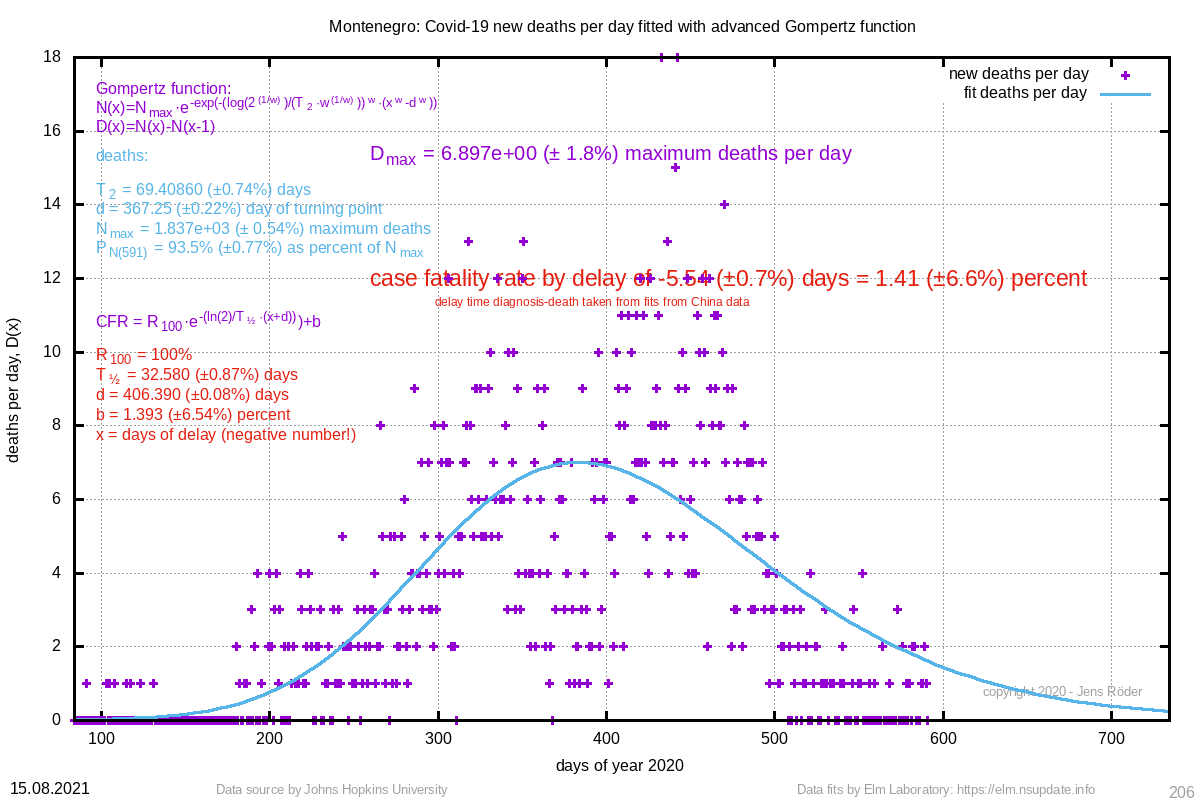 | 69.409 (±0.7%) | 367.25 (±0.2%) |
| 1532 Australia - Oceania, Australia - Oceania | 1056 (±0.6%) | 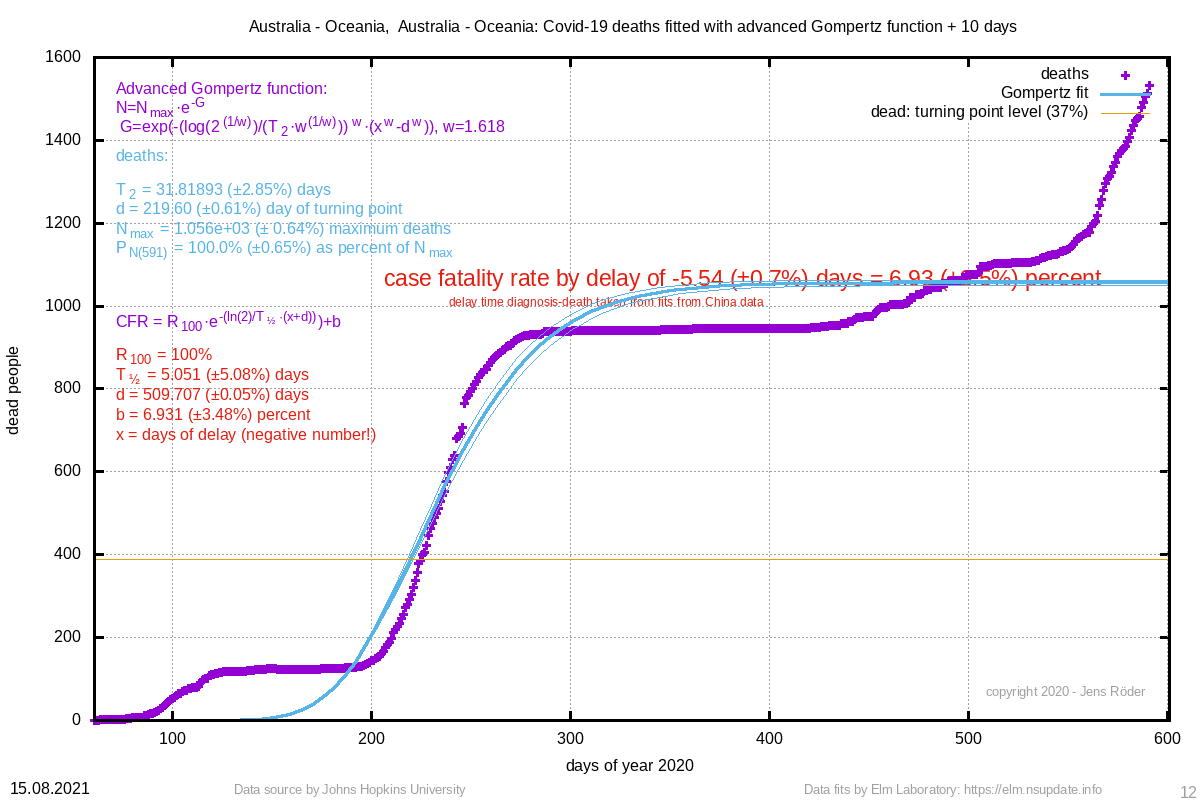 | 6.93 (±3.5%) |  | 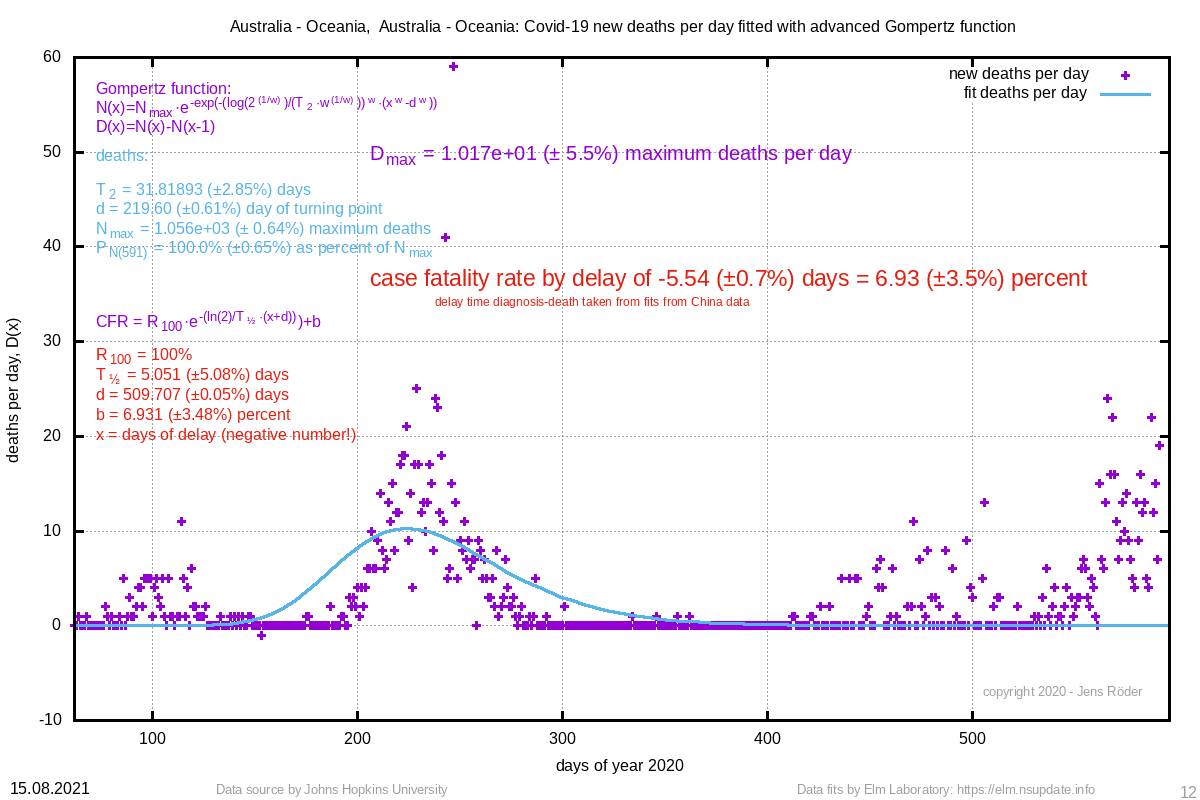 | 31.819 (±2.9%) | 219.60 (±0.6%) |
| 1384 Bahrain | 152113983 (±375.7%) | 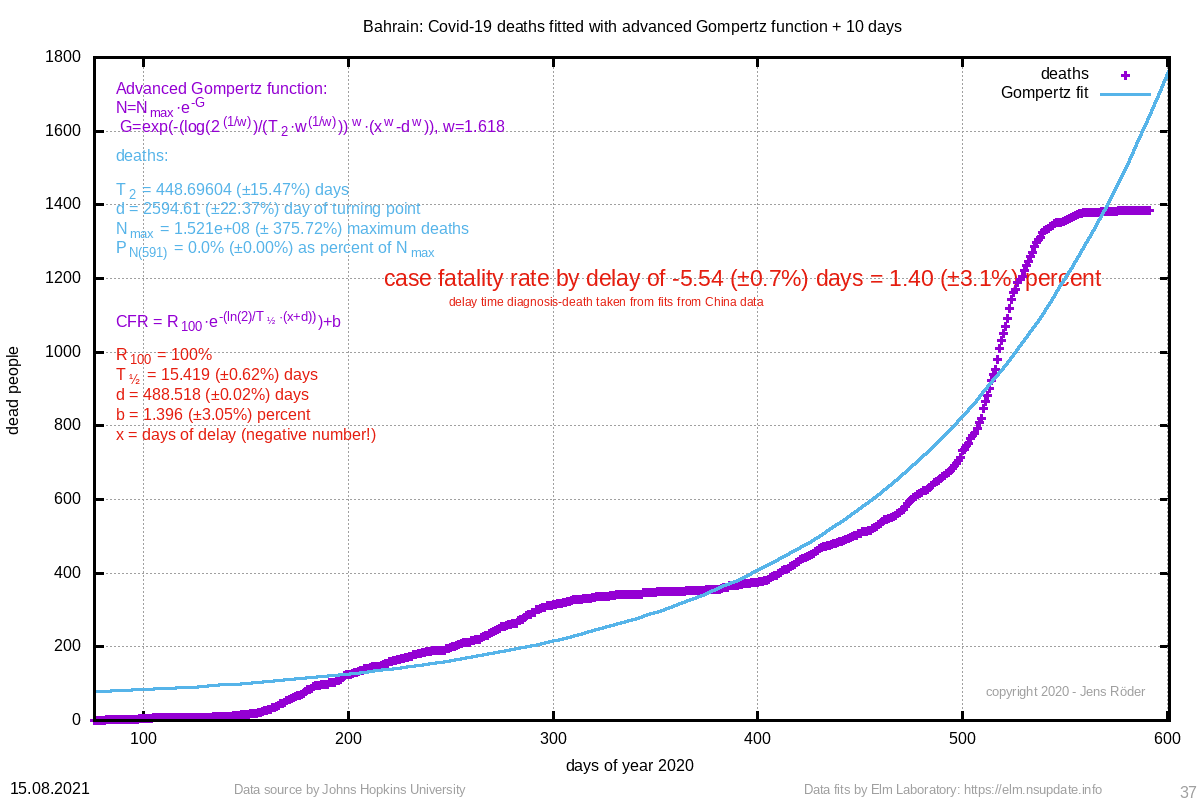 | 1.40 (±3.1%) | 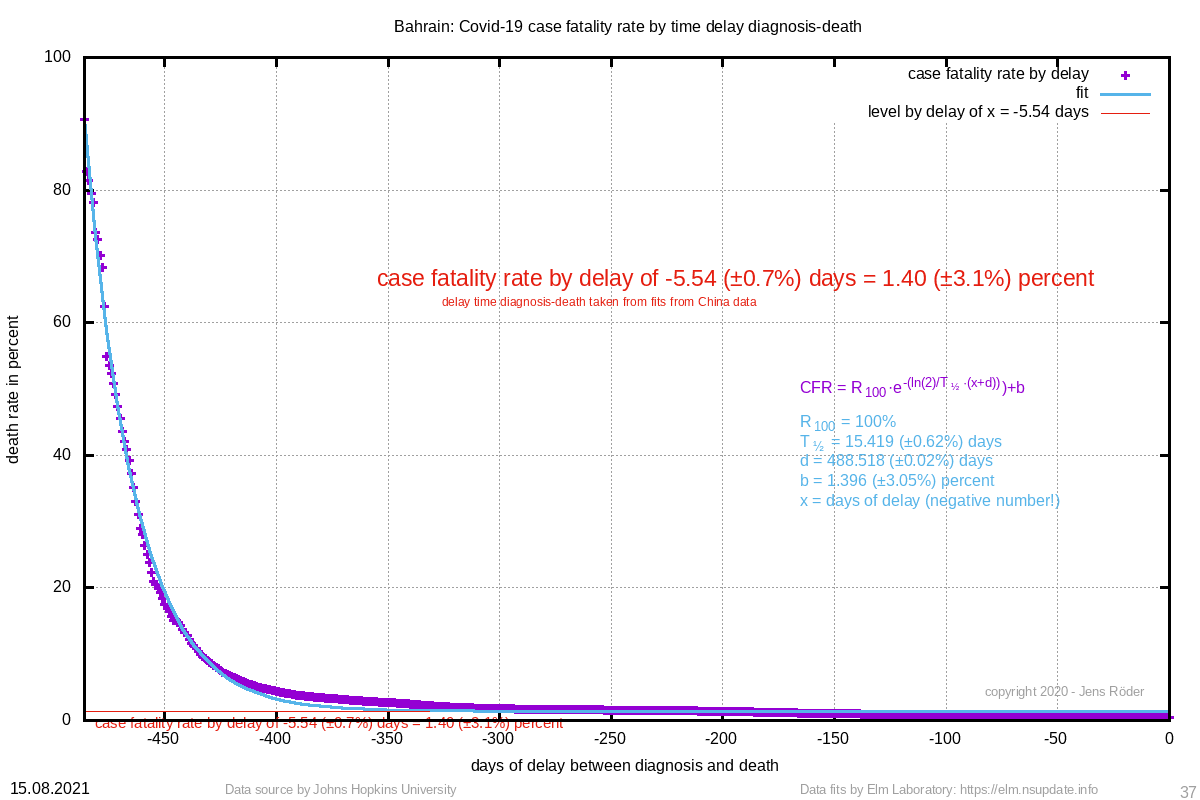 | 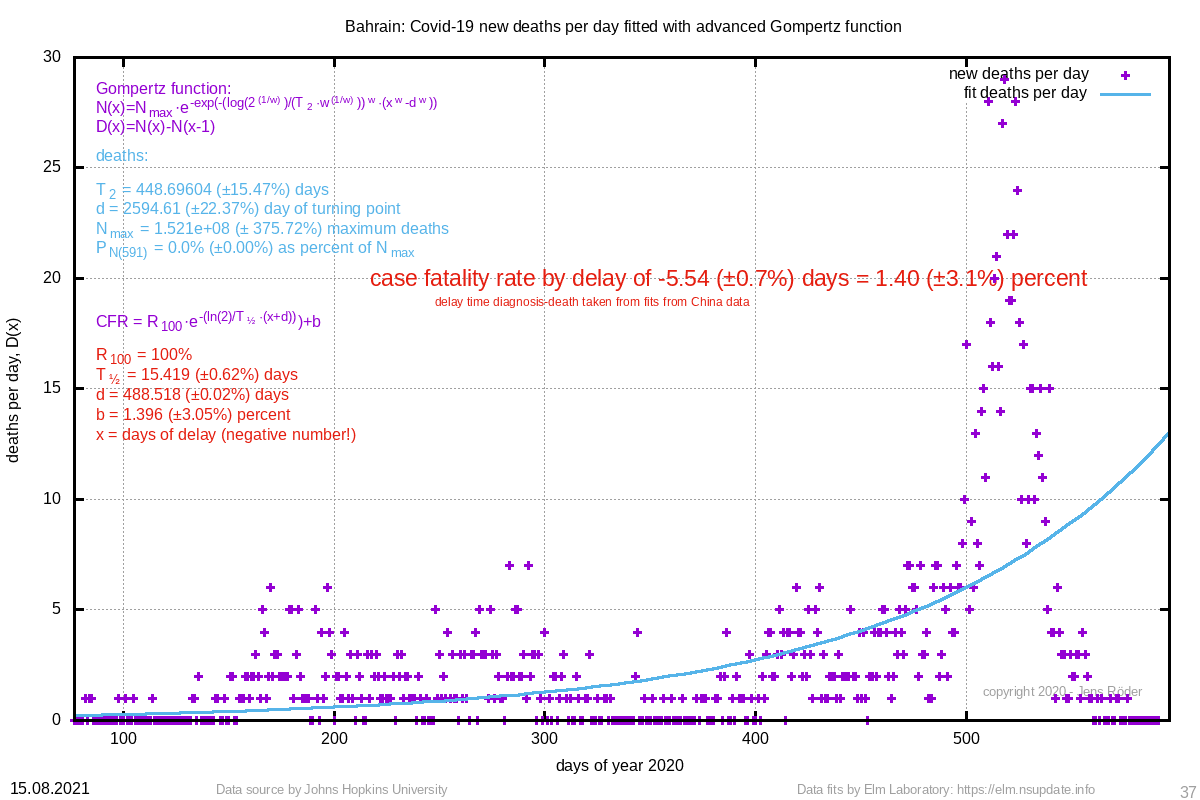 | 448.696 (±15.5%) | 2594.61 (±22.4%) |
| 1338 Cameroon | 38040788 (±537.0%) | 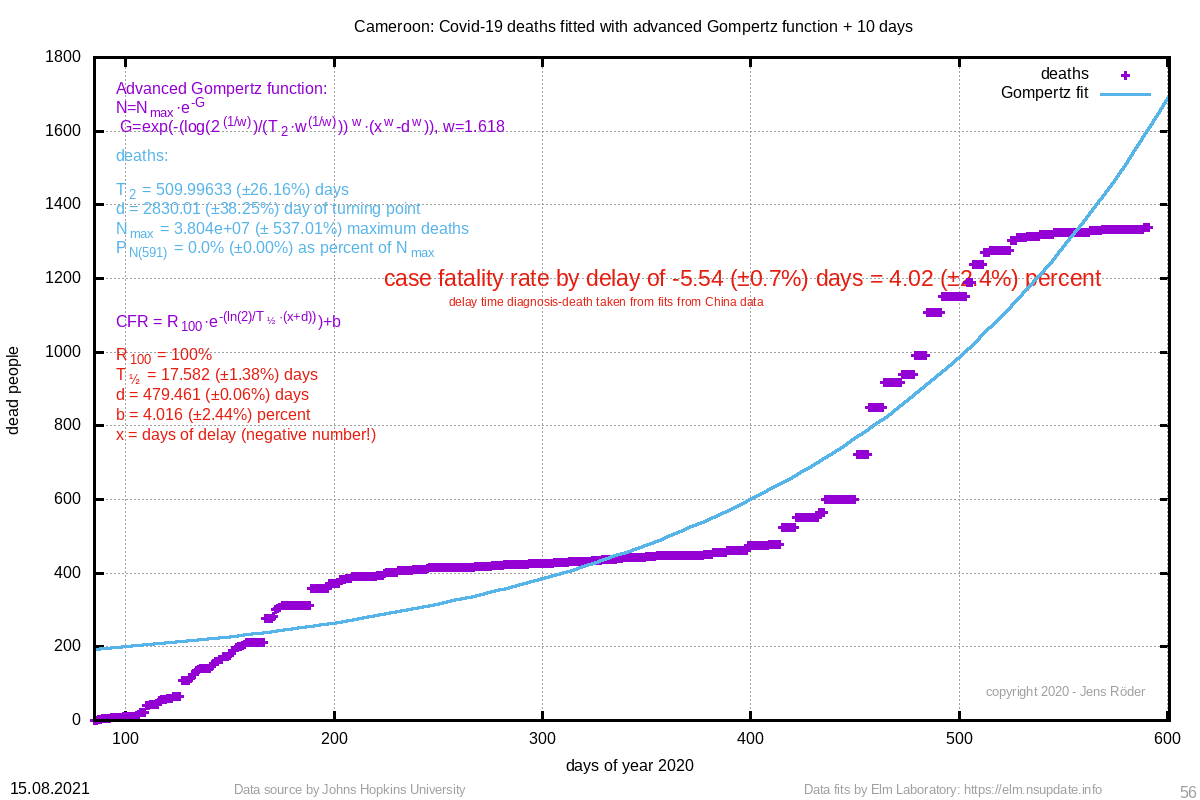 | 4.02 (±2.4%) | 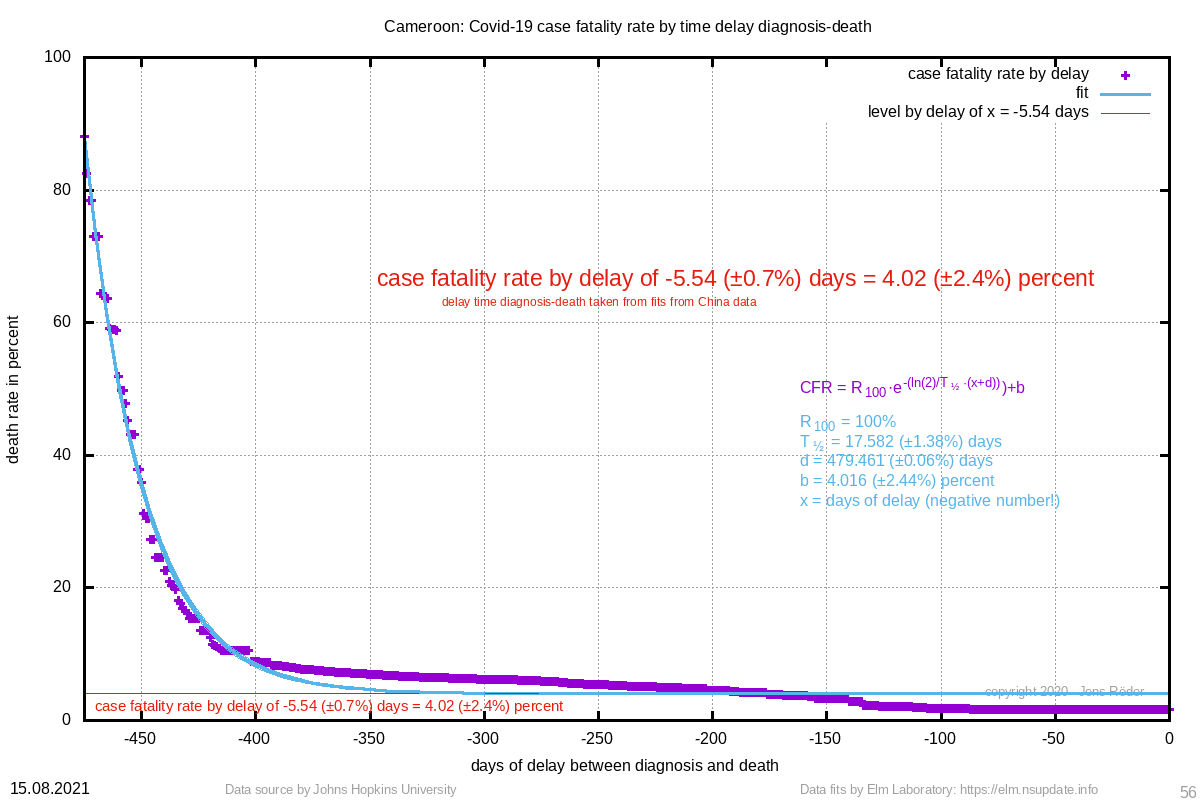 | 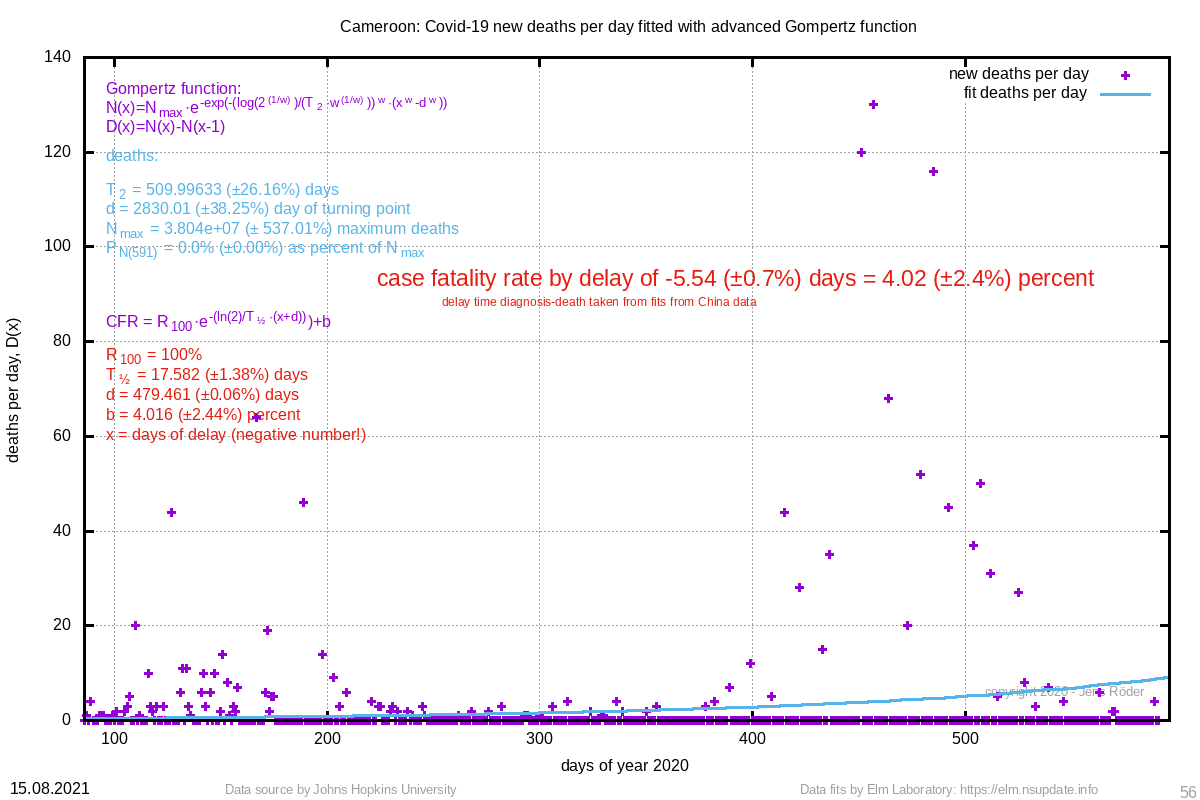 | 509.996 (±26.2%) | 2830.01 (±38.3%) |
| 1082 Angola | 1500 (±3.7%) | 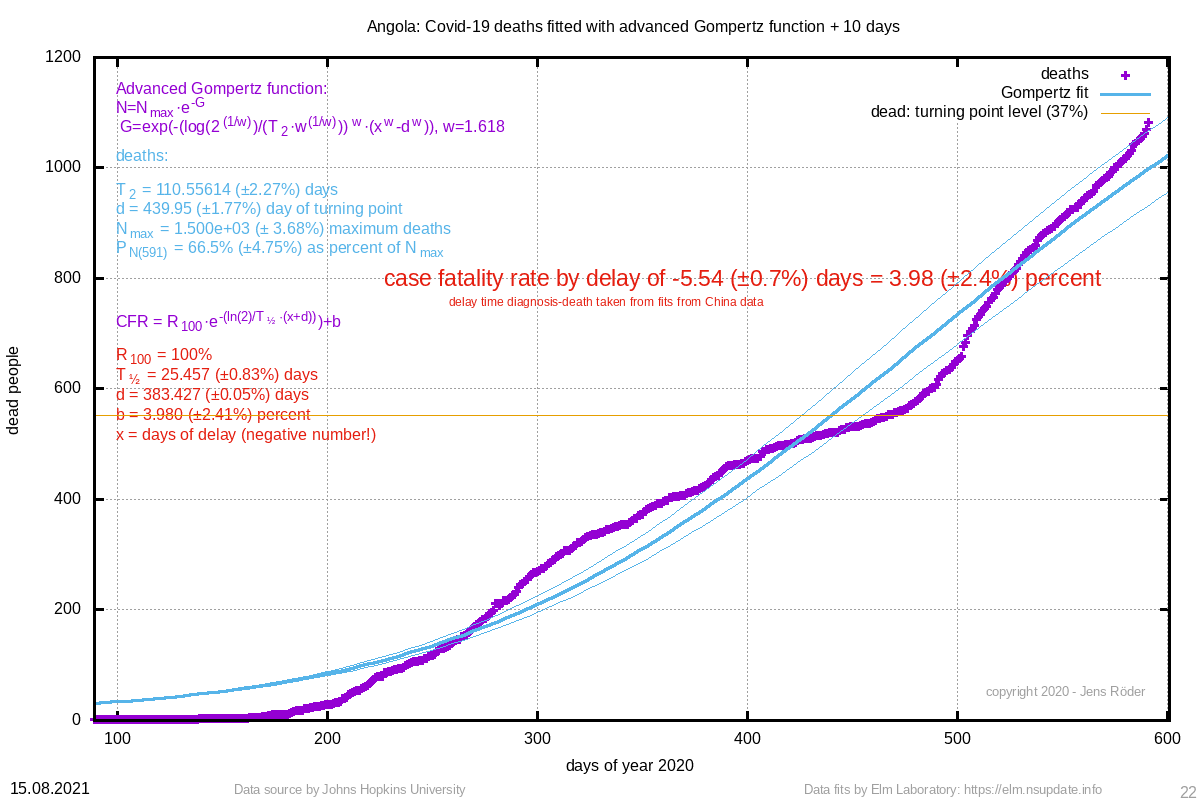 | 3.98 (±2.4%) | 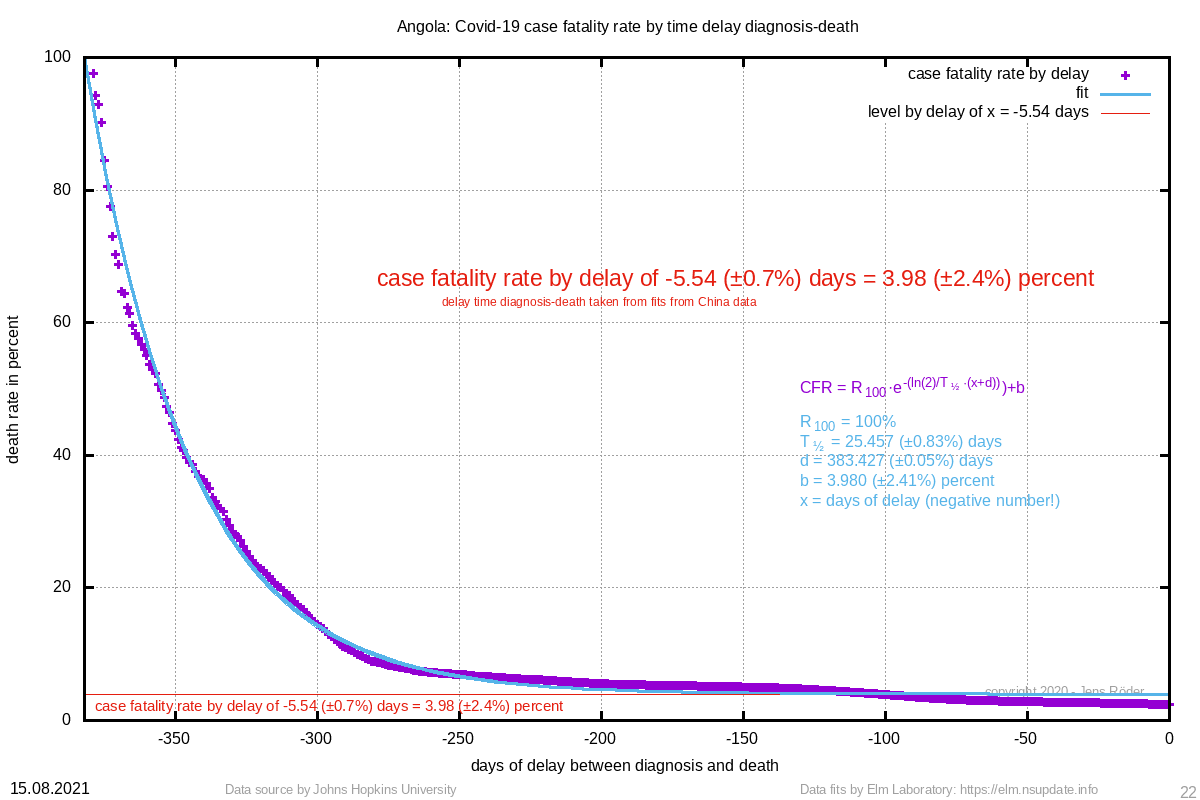 | 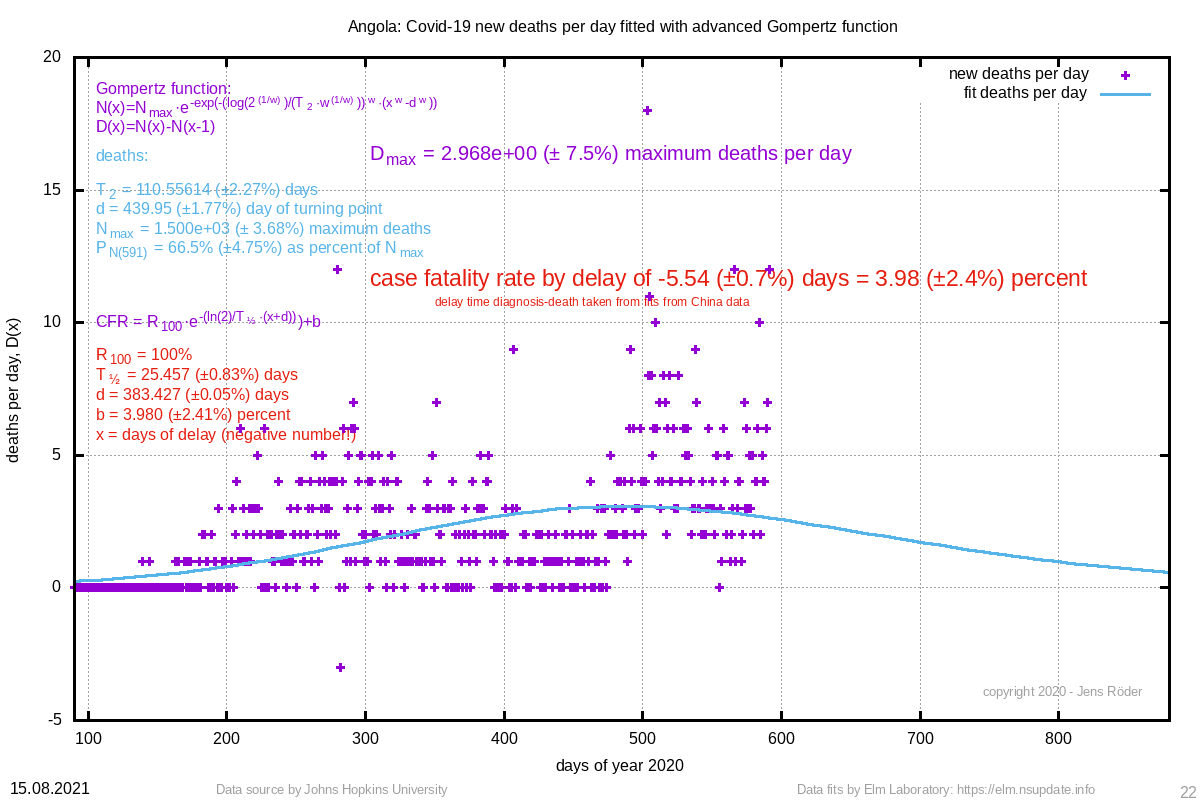 | 110.556 (±2.3%) | 439.95 (±1.8%) |
| 1050 Congo (Kinshasa) | 1143 (±1.7%) | 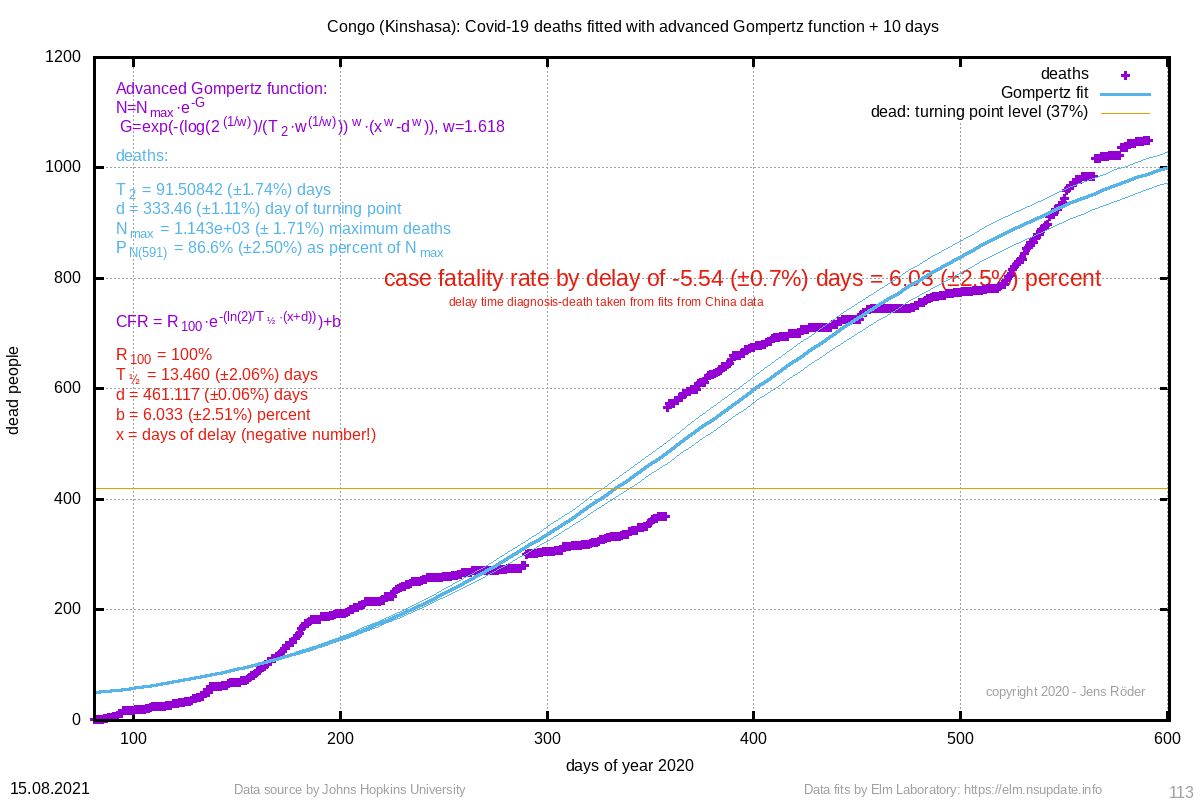 | 6.03 (±2.5%) | 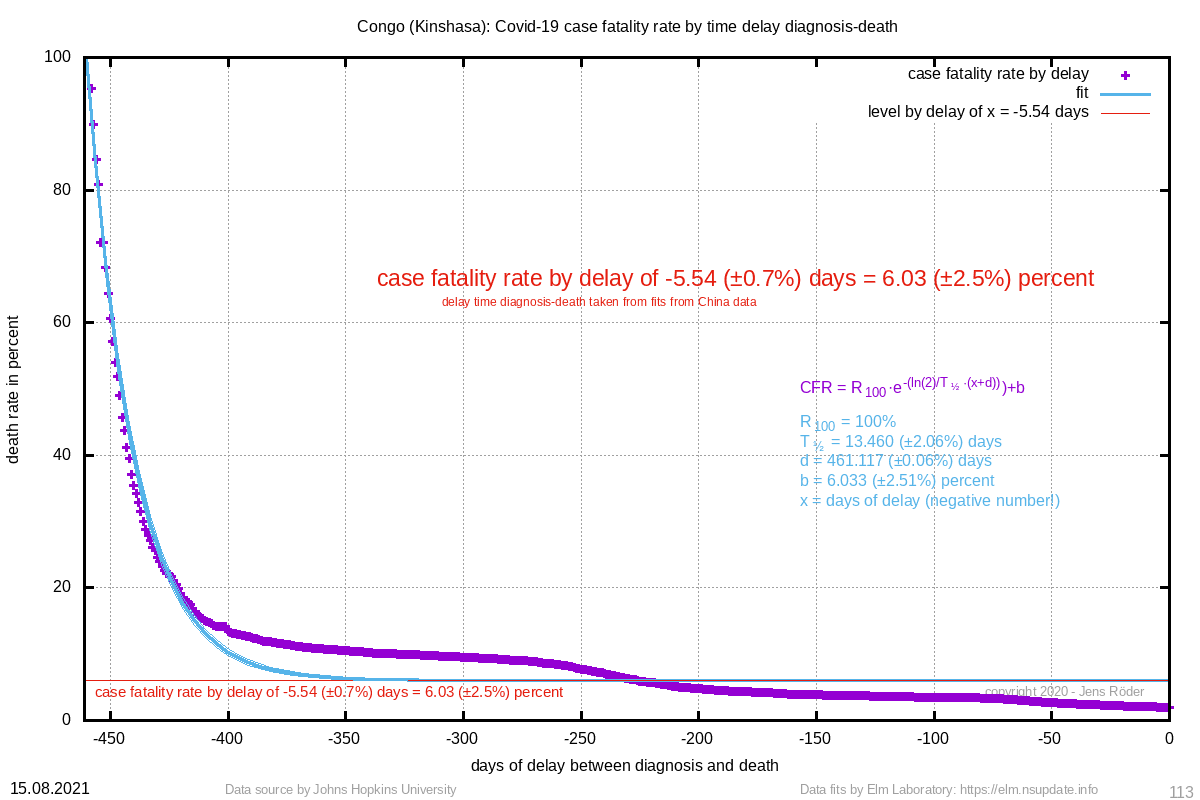 | 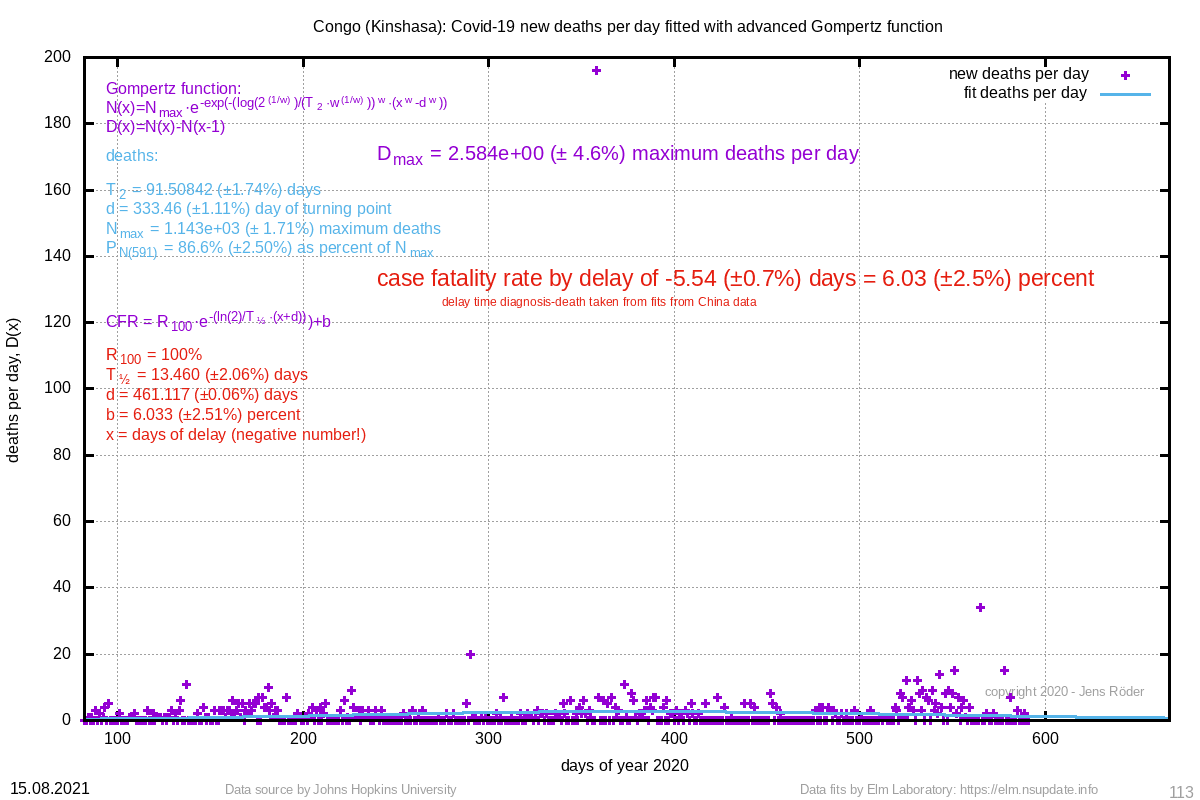 | 91.508 (±1.7%) | 333.46 (±1.1%) |
| 871 Mongolia | 1285 (±2.2%) | 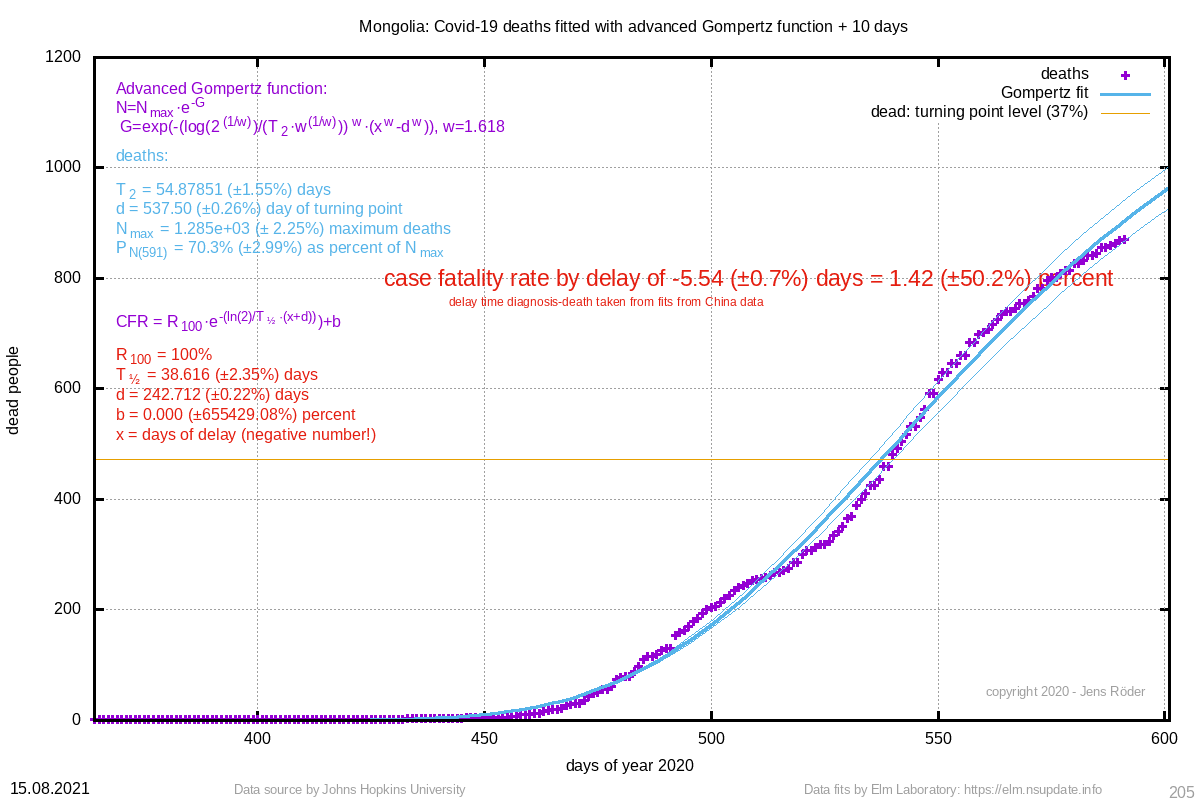 | 1.42 (±50.2%) | 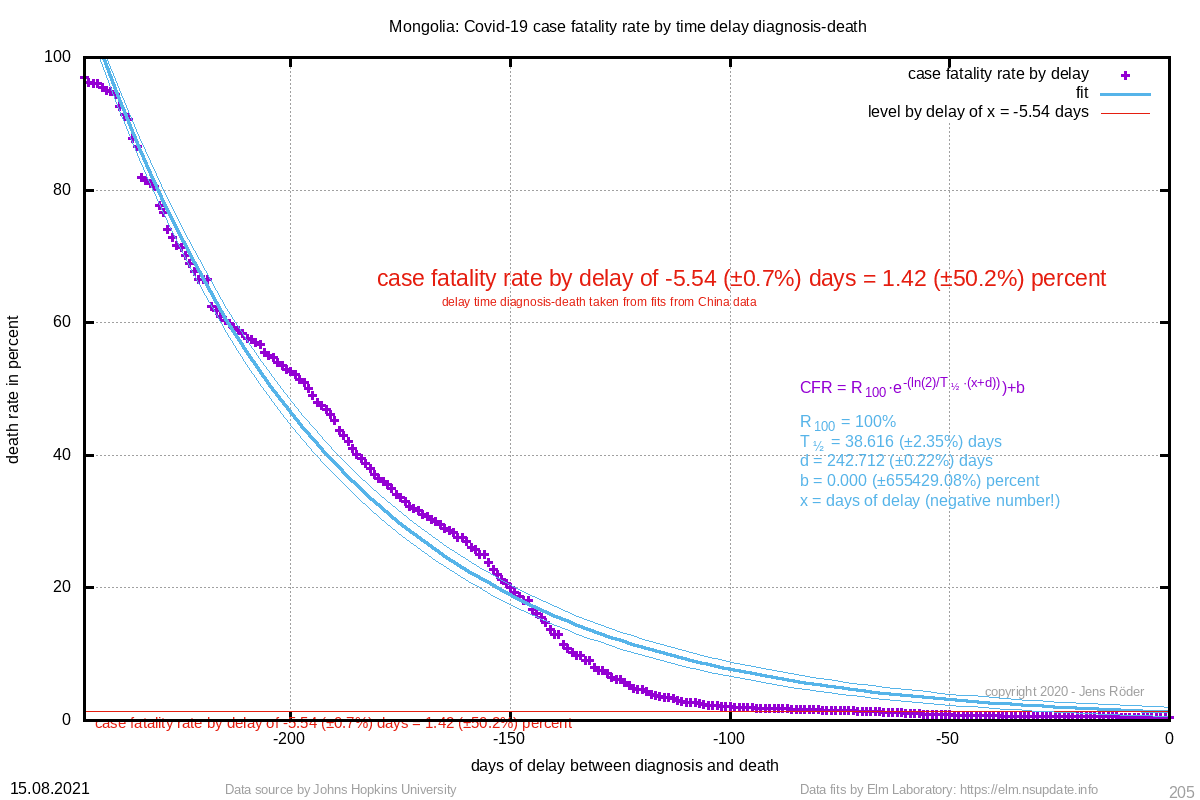 | 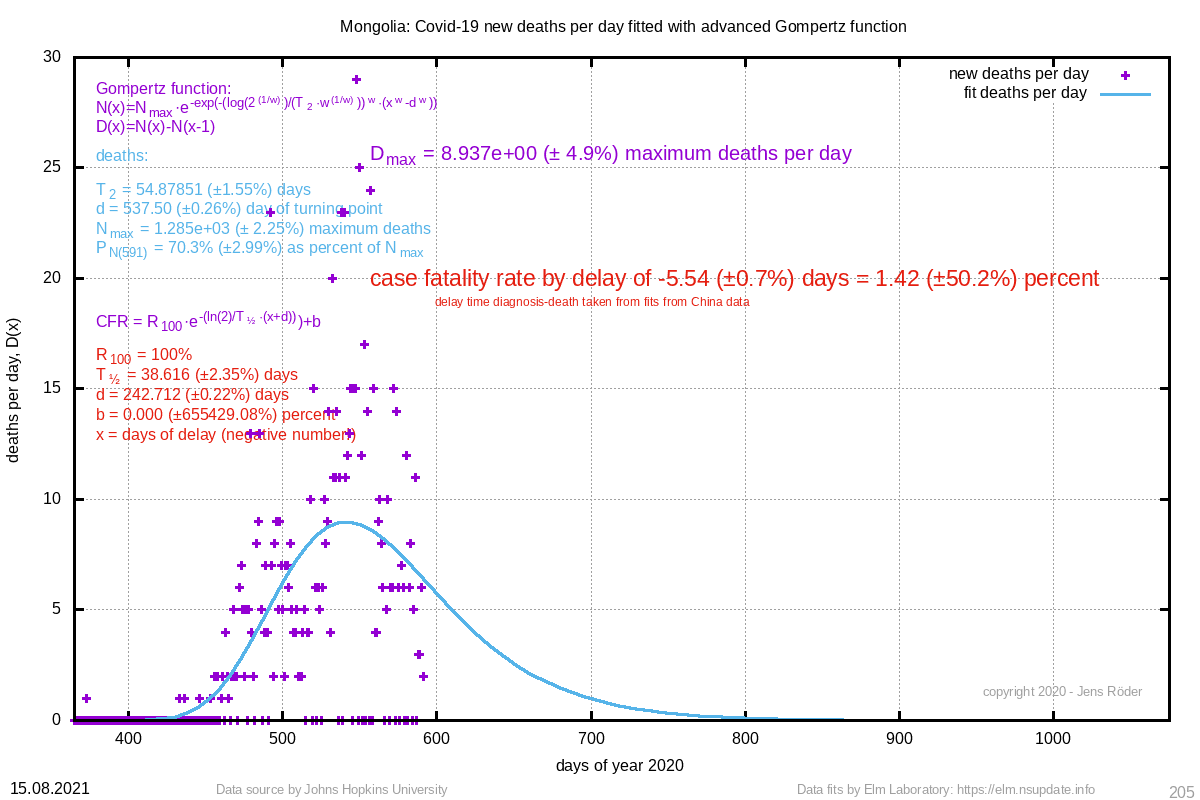 | 54.879 (±1.6%) | 537.50 (±0.3%) |
| 808 Norway | 1149 (±3.2%) | 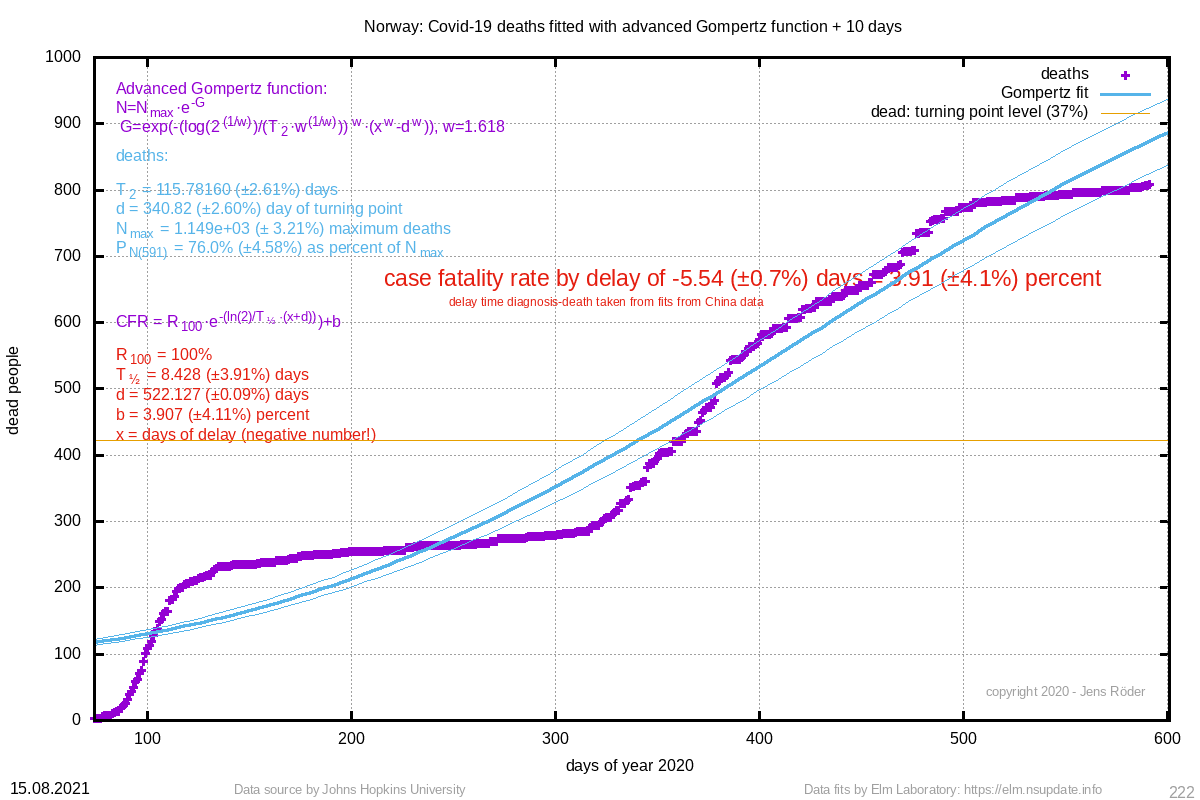 | 3.91 (±4.1%) | 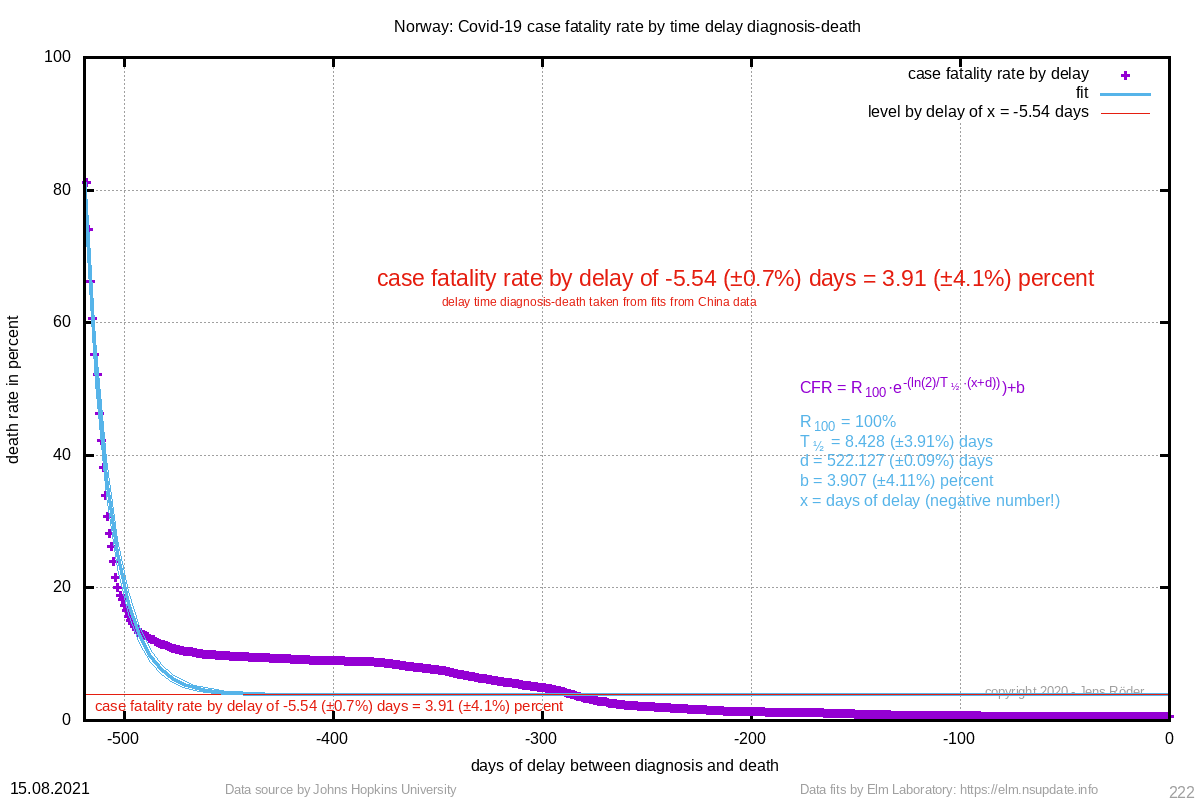 |  | 115.782 (±2.6%) | 340.82 (±2.6%) |
| 576 Haiti | 7235 (±124.4%) |  | 5.45 (±1.4%) | 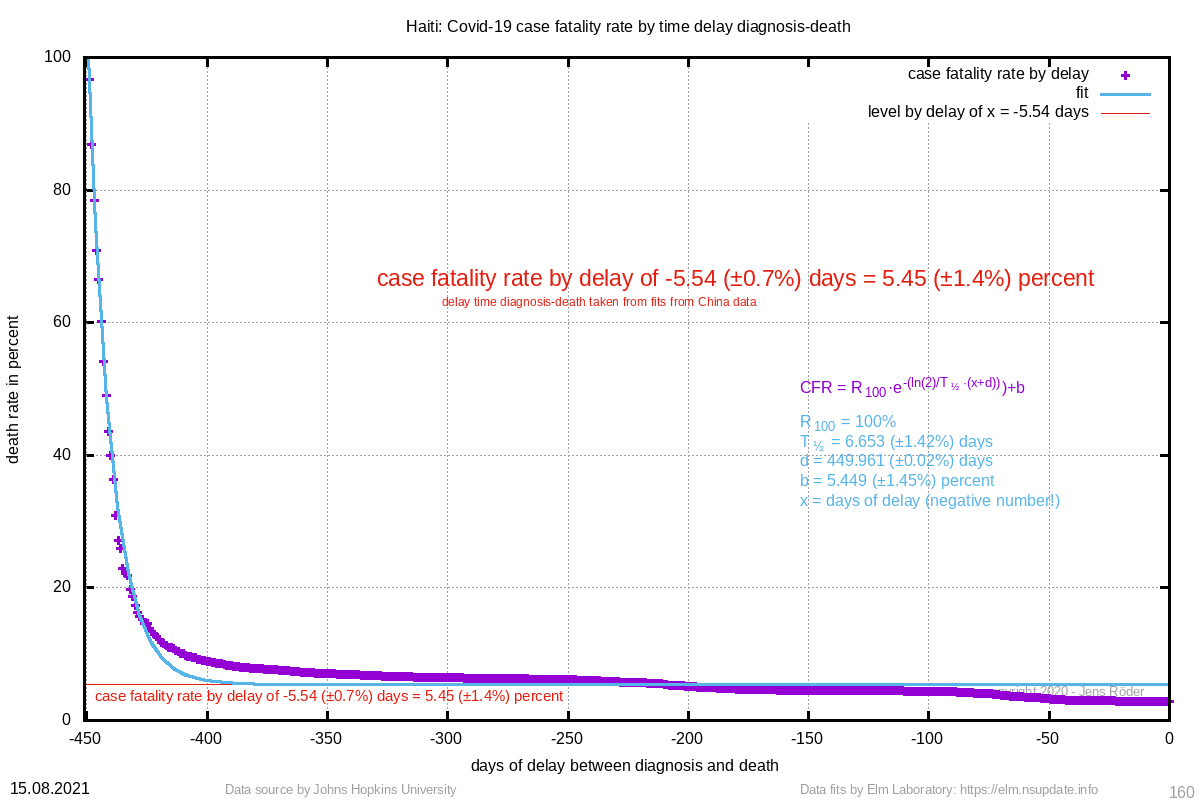 | 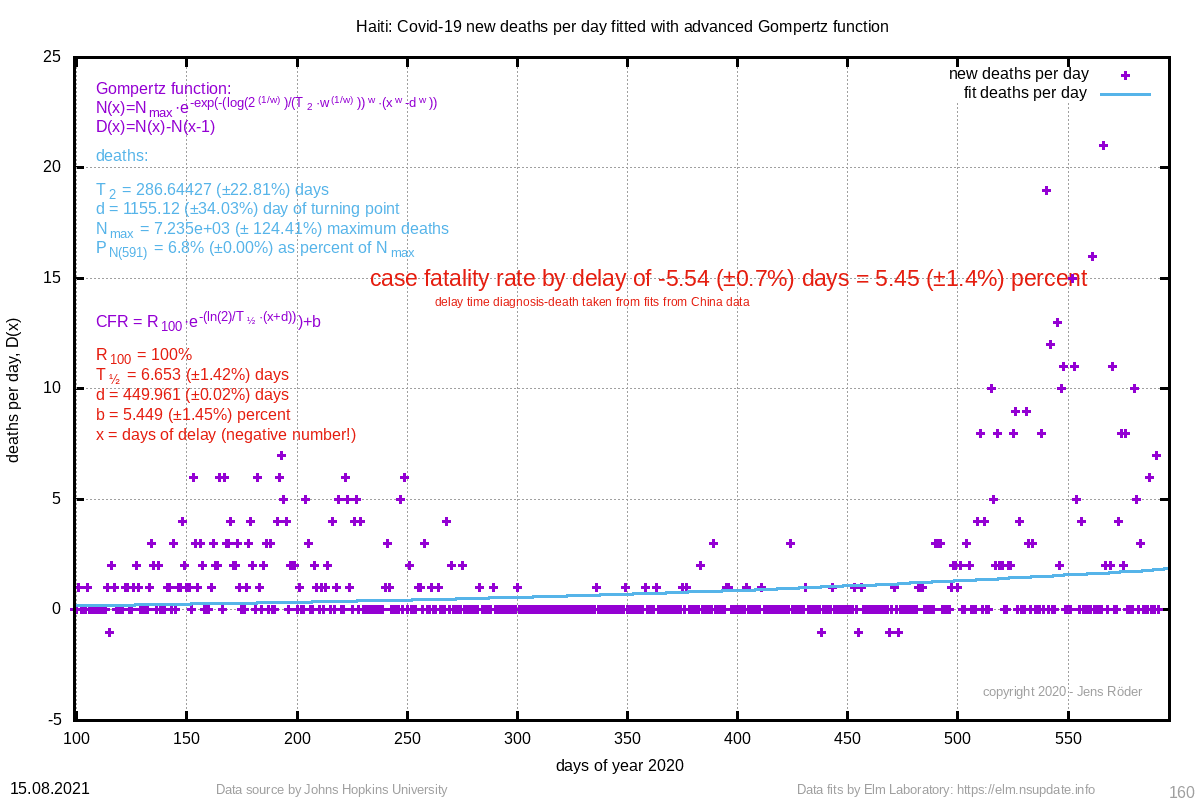 | 286.644 (±22.8%) | 1155.12 (±34.0%) |
| 534 Mali | 758 (±2.6%) | 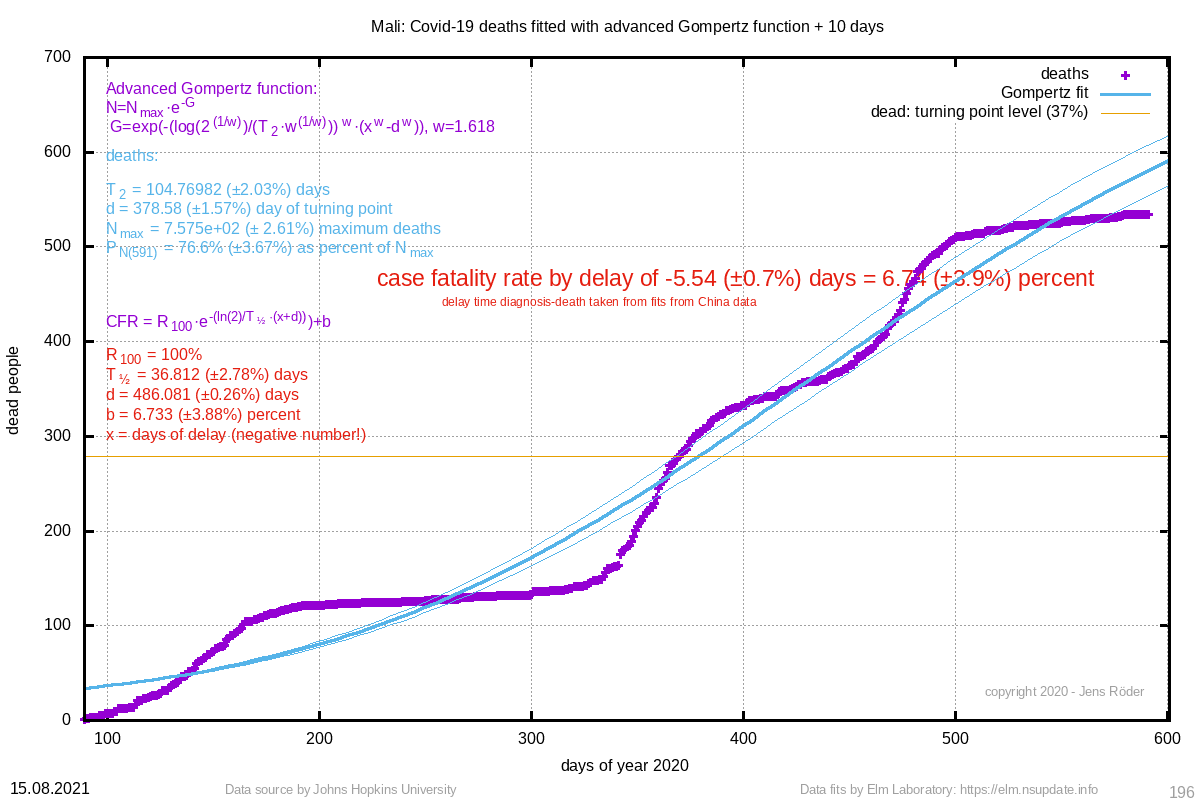 | 6.74 (±3.9%) |  | 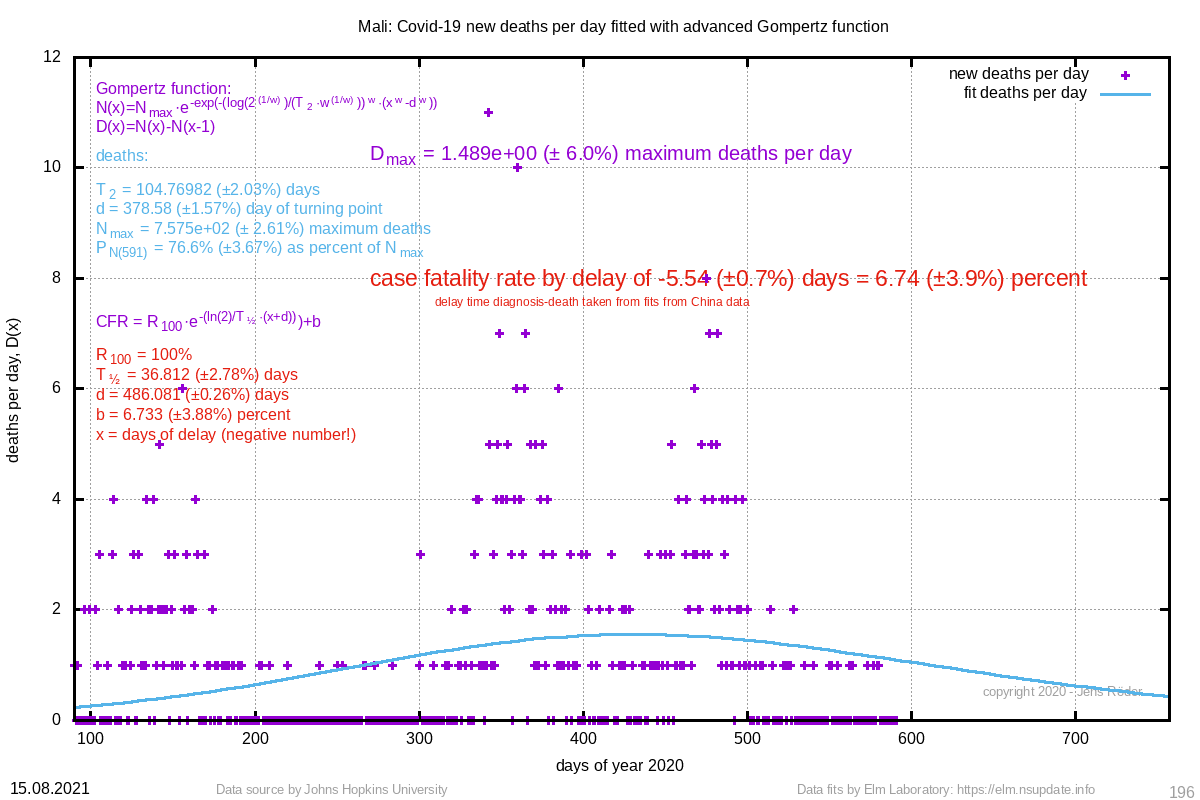 | 104.770 (±2.0%) | 378.58 (±1.6%) |
| 344 Belize | 329 (±0.2%) |  | 3.29 (±4.4%) | 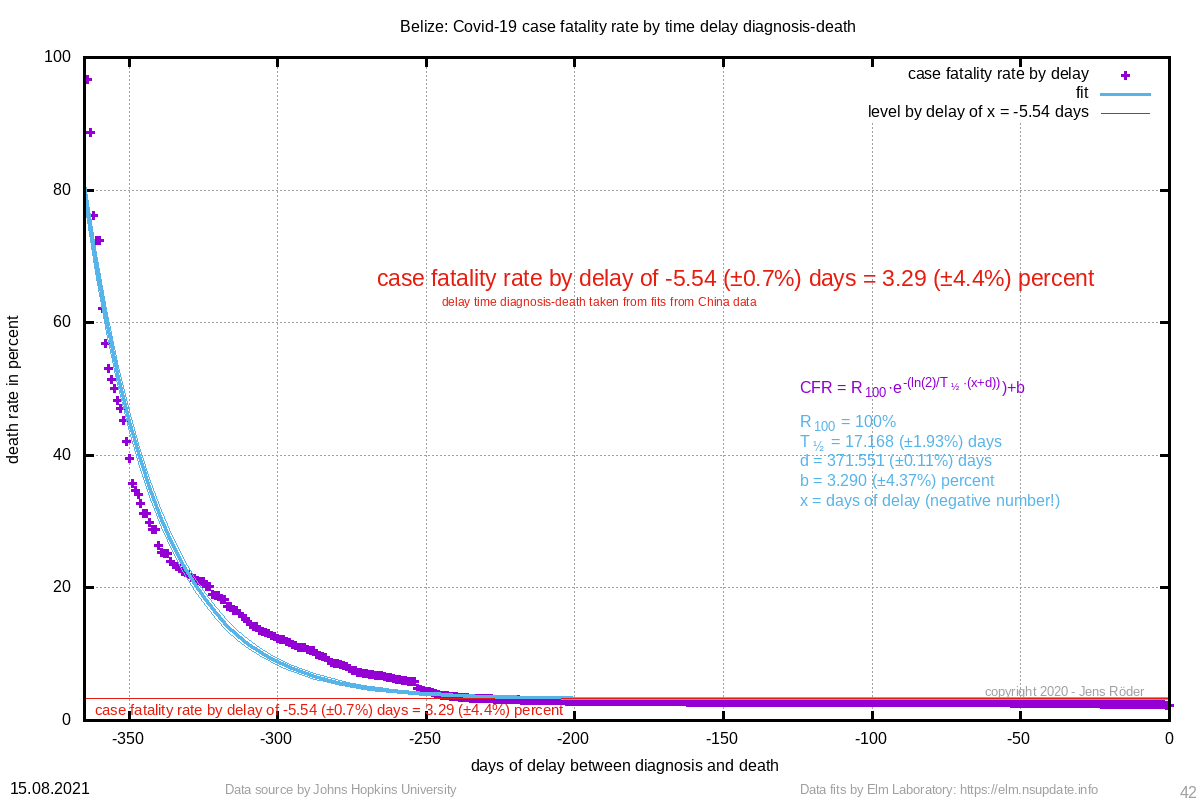 | 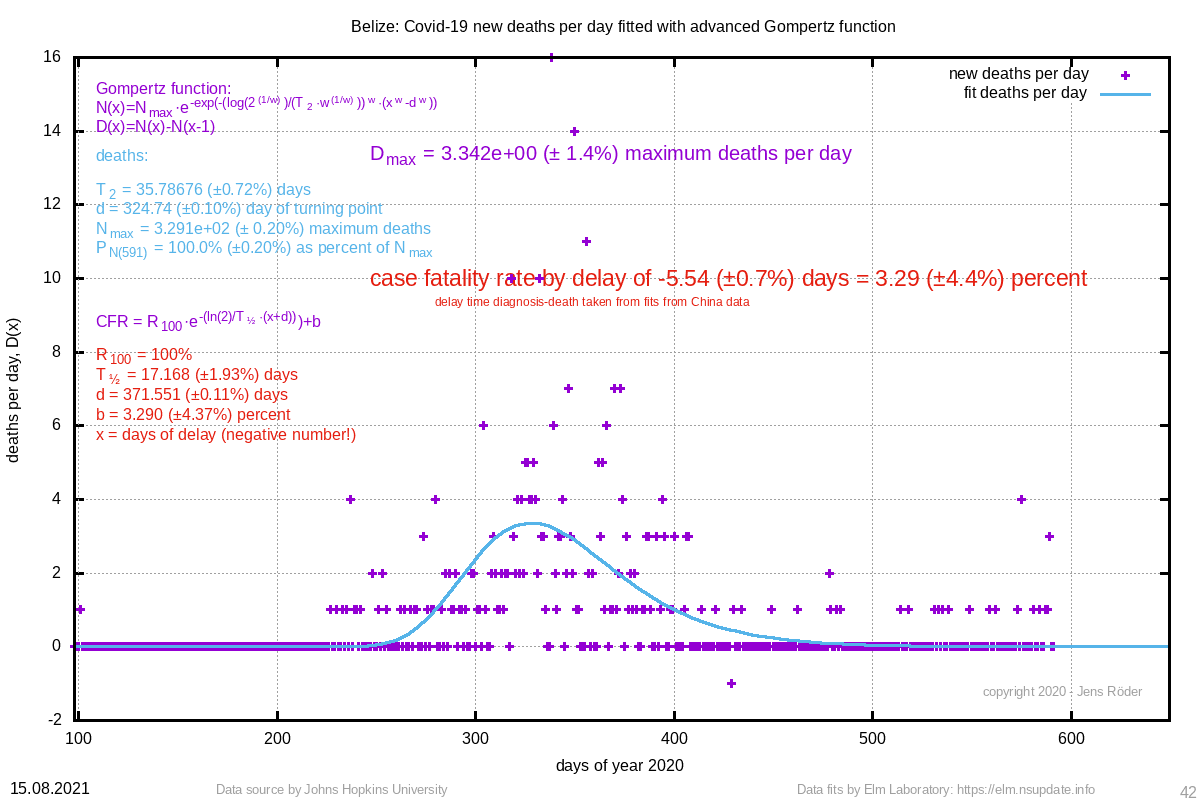 | 35.787 (±0.7%) | 324.74 (±0.1%) |
| 311 Bahamas | 248 (±1.1%) | 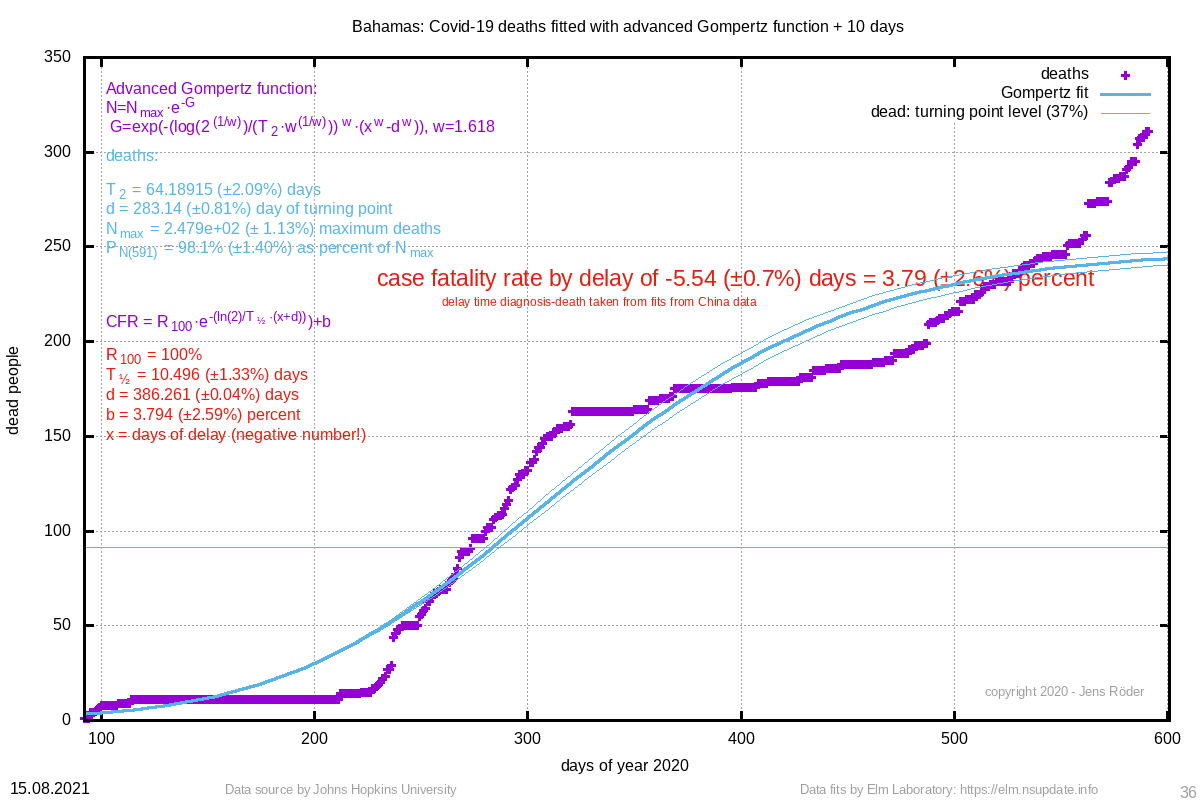 | 3.79 (±2.6%) |  | 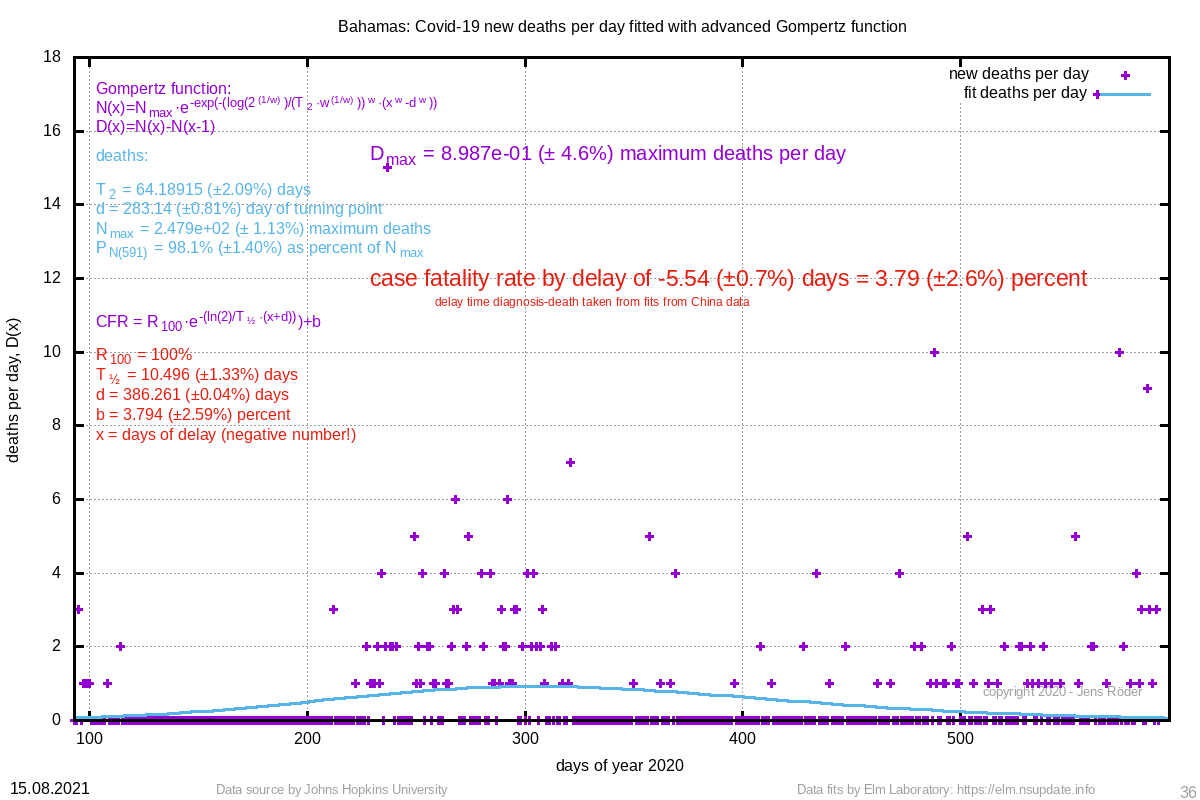 | 64.189 (±2.1%) | 283.14 (±0.8%) |
| 298 Cabo Verde | 466 (±2.9%) | 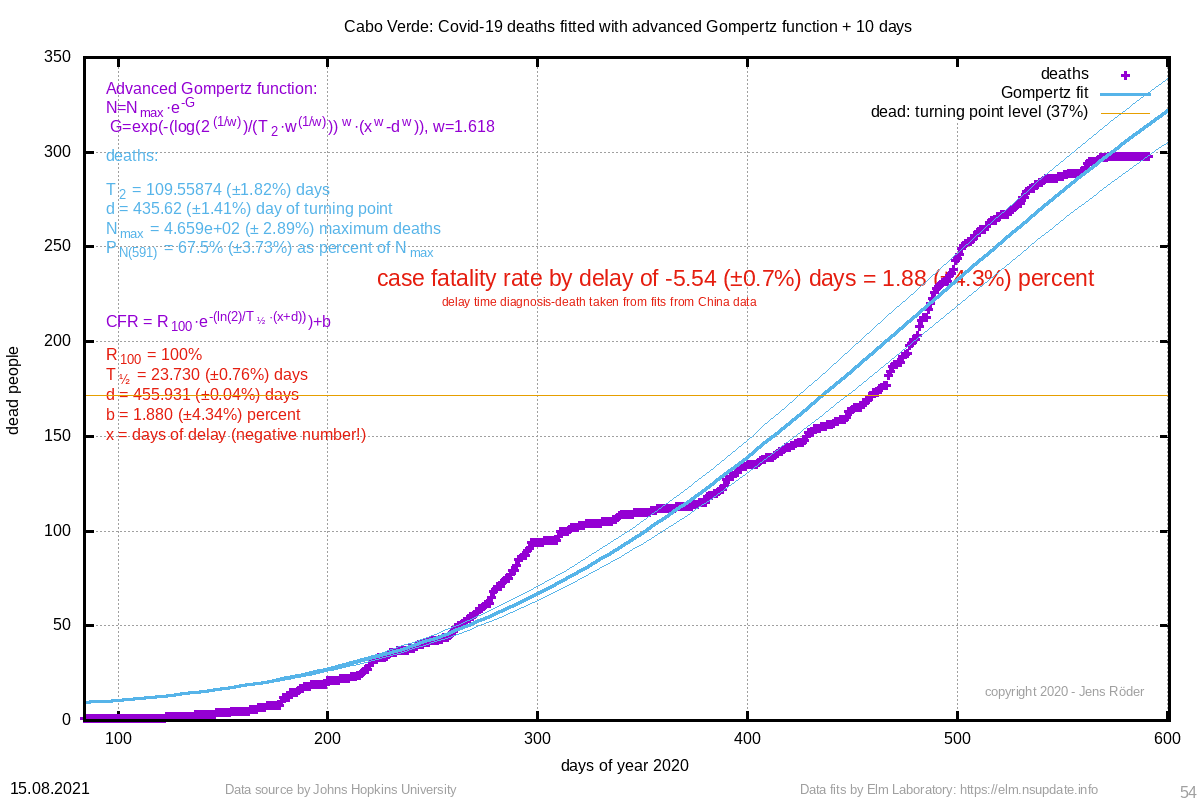 | 1.88 (±4.3%) | 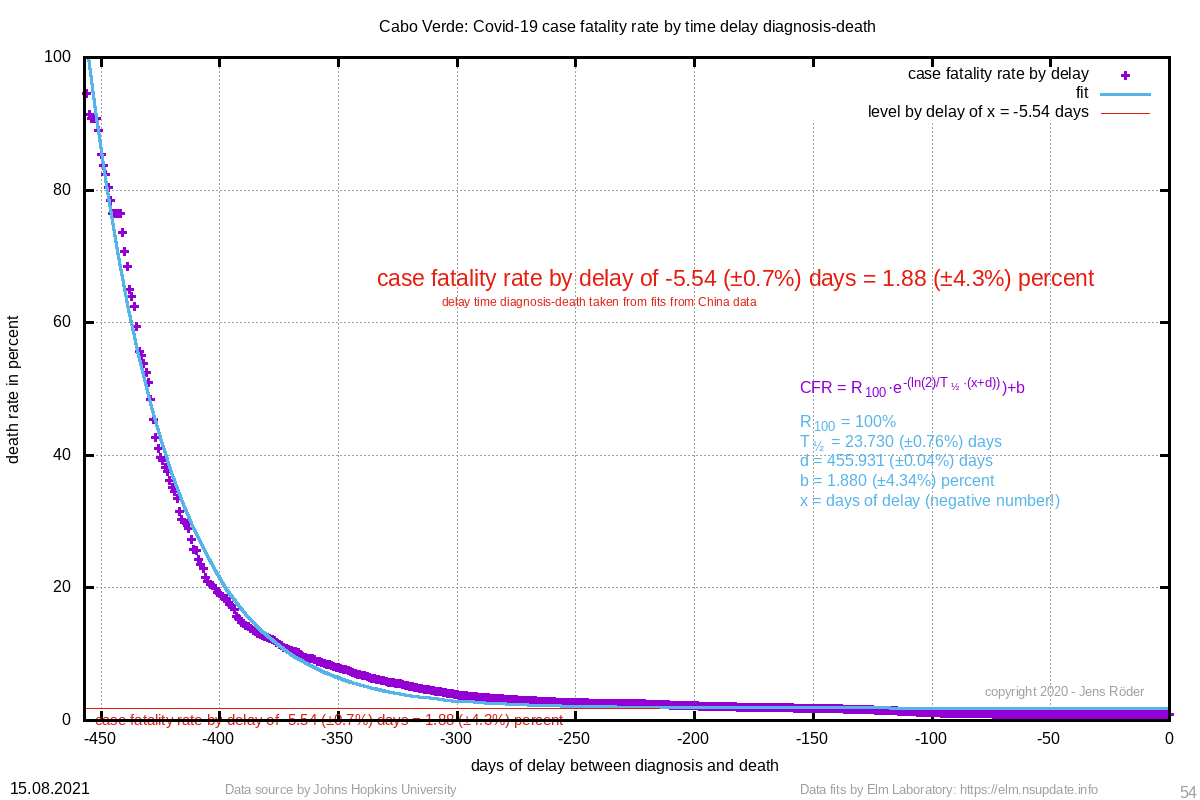 | 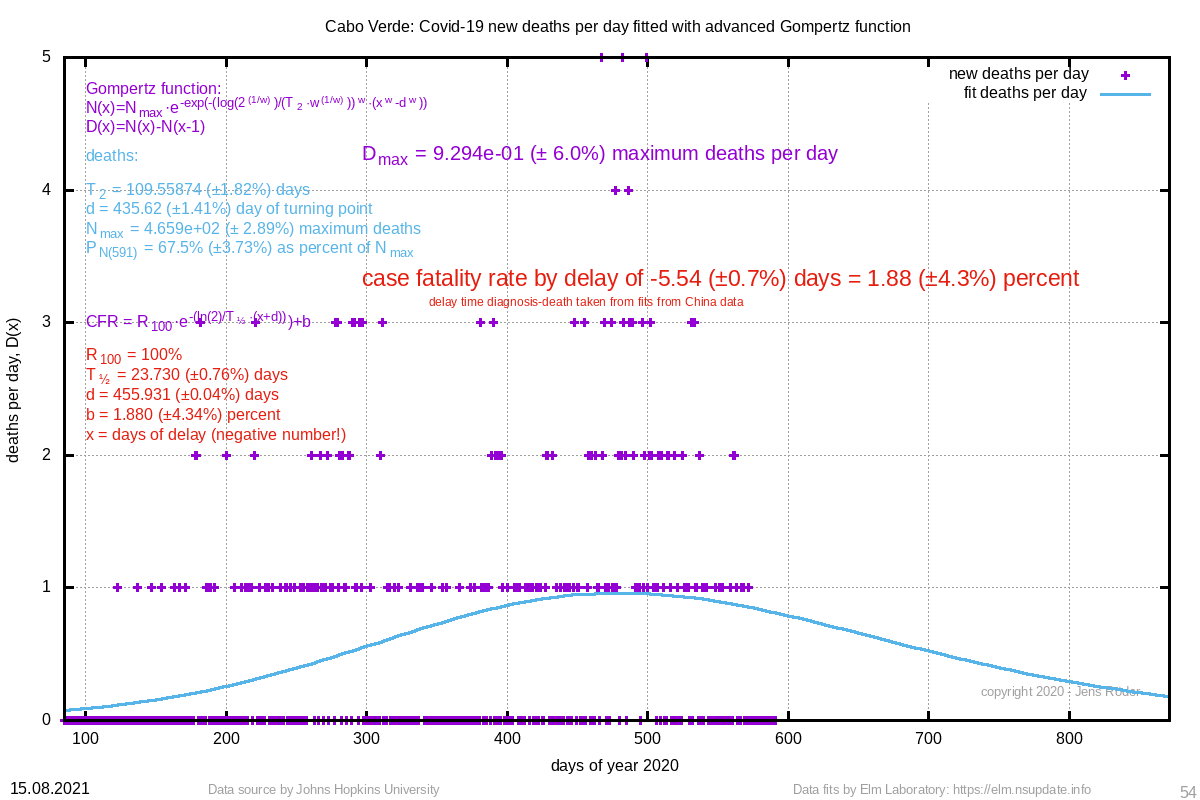 | 109.559 (±1.8%) | 435.62 (±1.4%) |
| 277 Guinea | 2748 (±42.9%) | 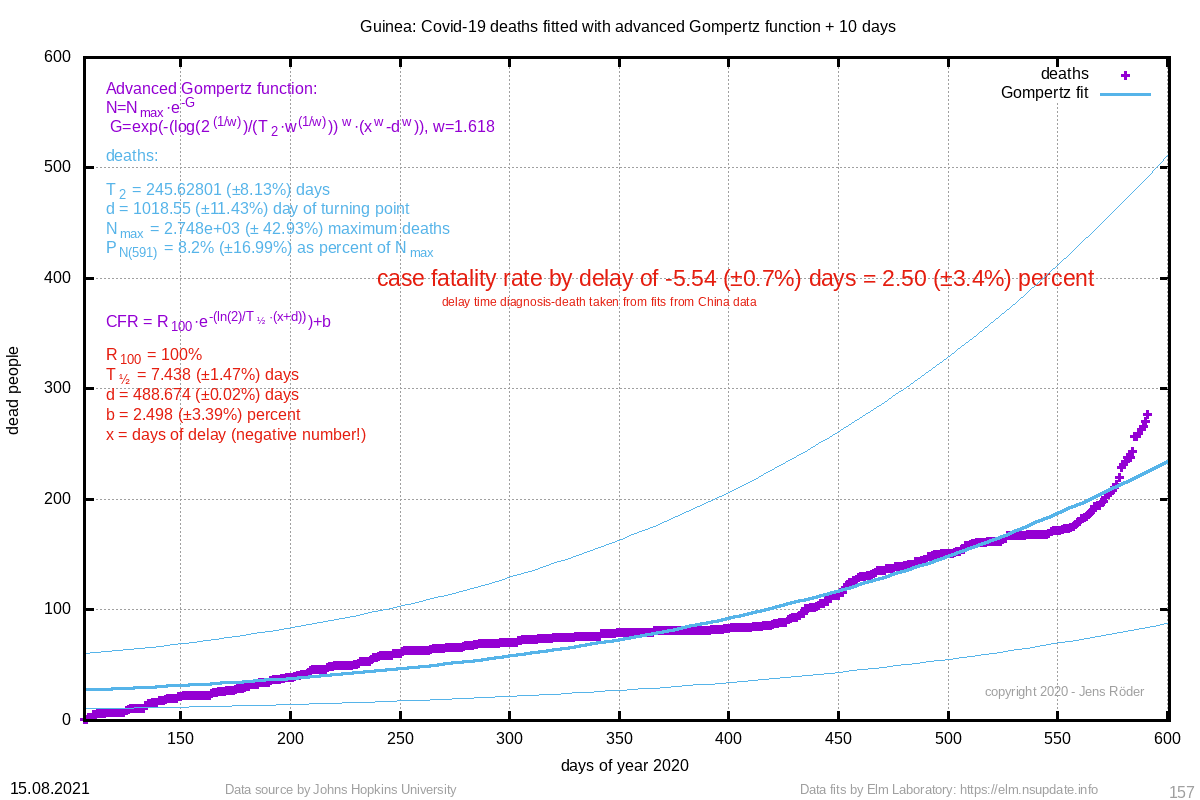 | 2.50 (±3.4%) |  | 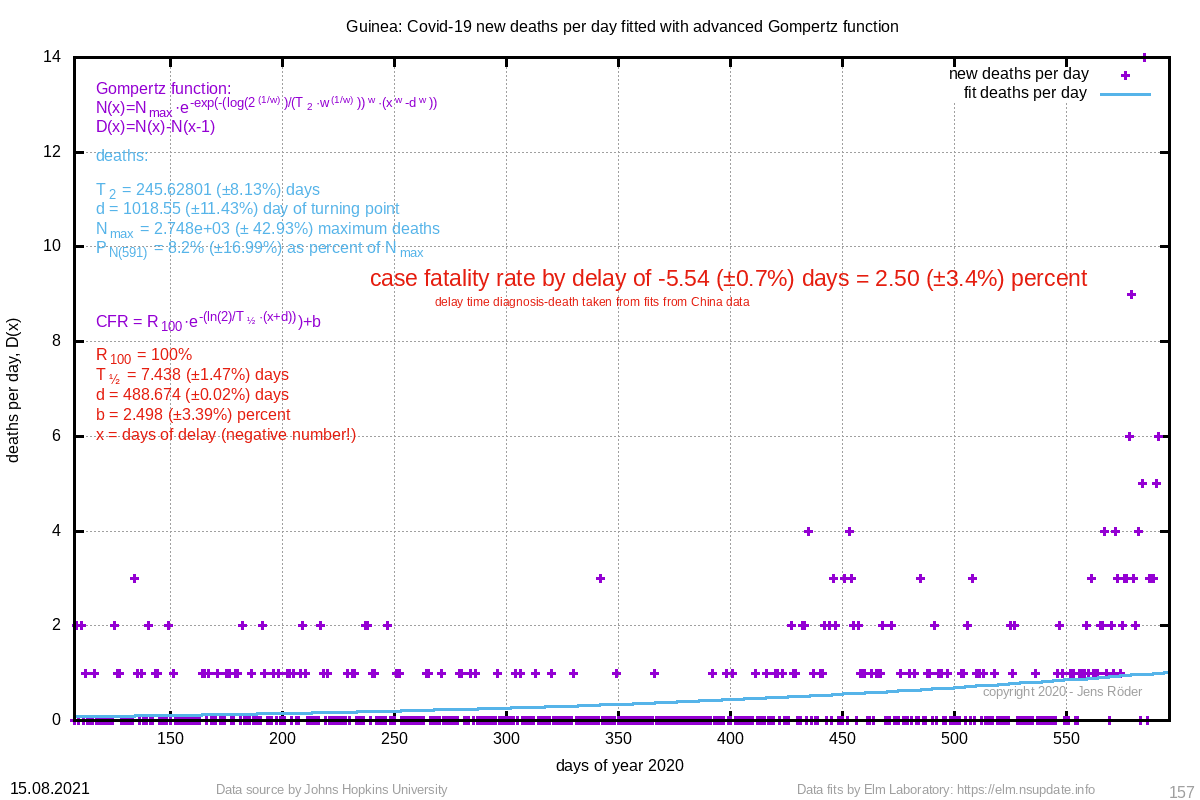 | 245.628 (±8.1%) | 1018.55 (±11.4%) |
| 251 Gambia | 182 (±1.1%) |  | 5.43 (±1.6%) | 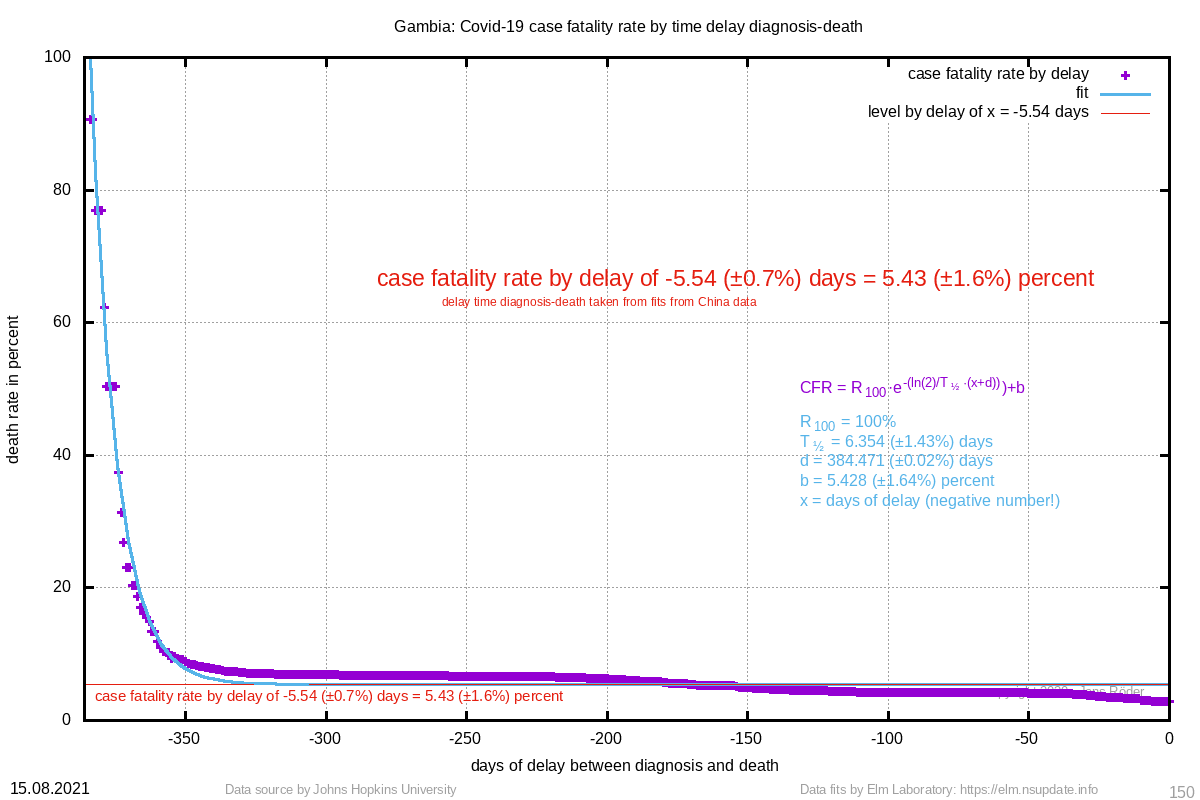 | 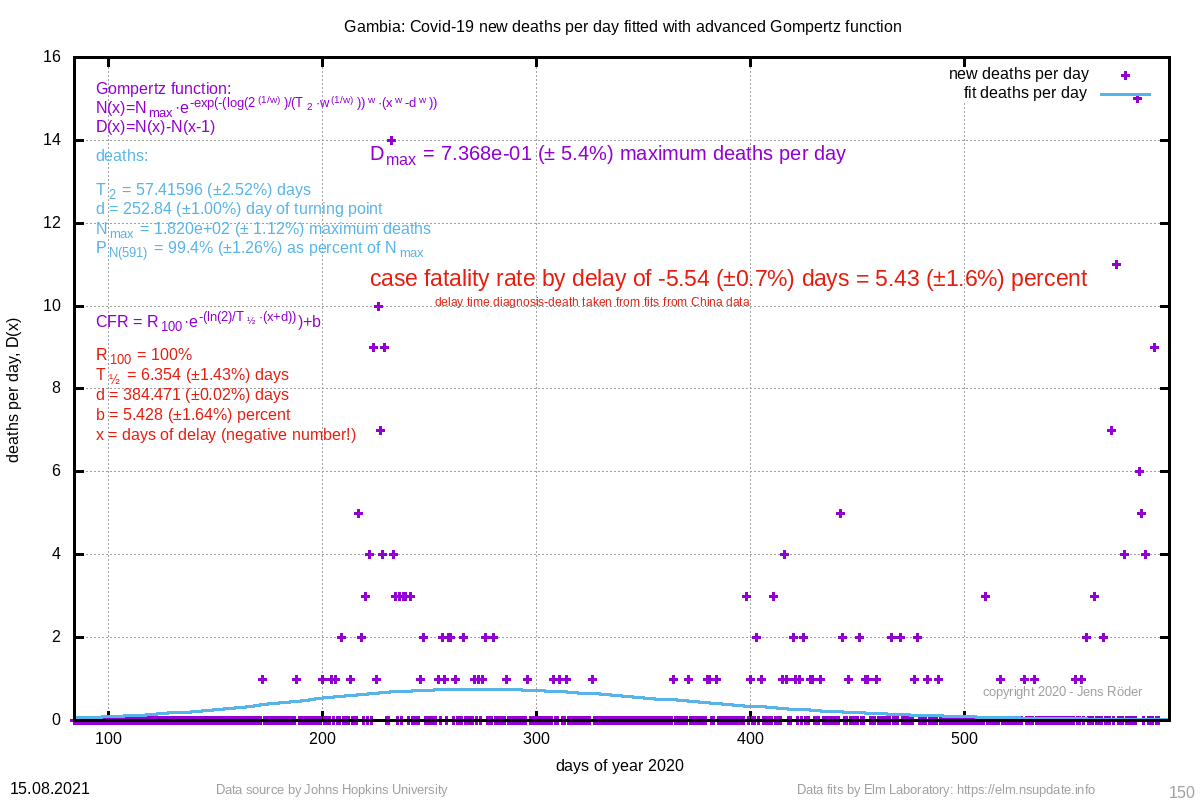 | 57.416 (±2.5%) | 252.84 (±1.0%) |
| 222 Maldives | 100281532 (±569.3%) | 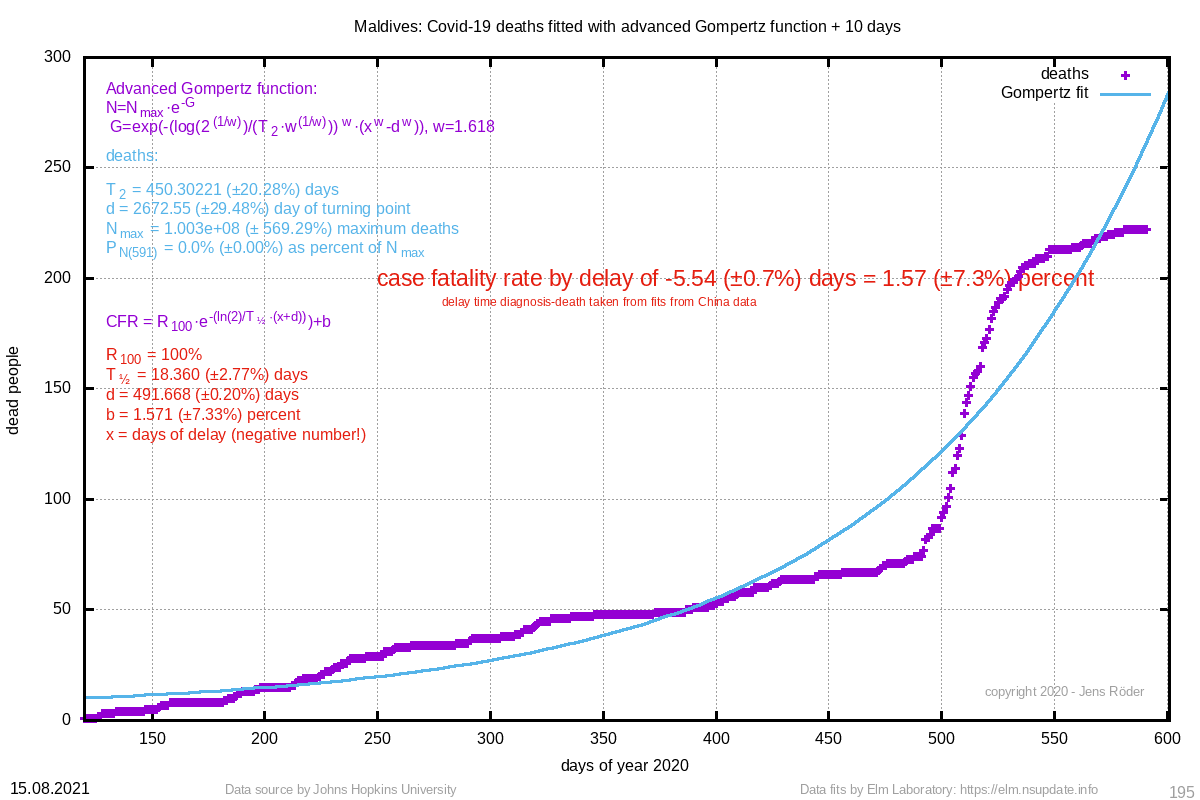 | 1.57 (±7.3%) | 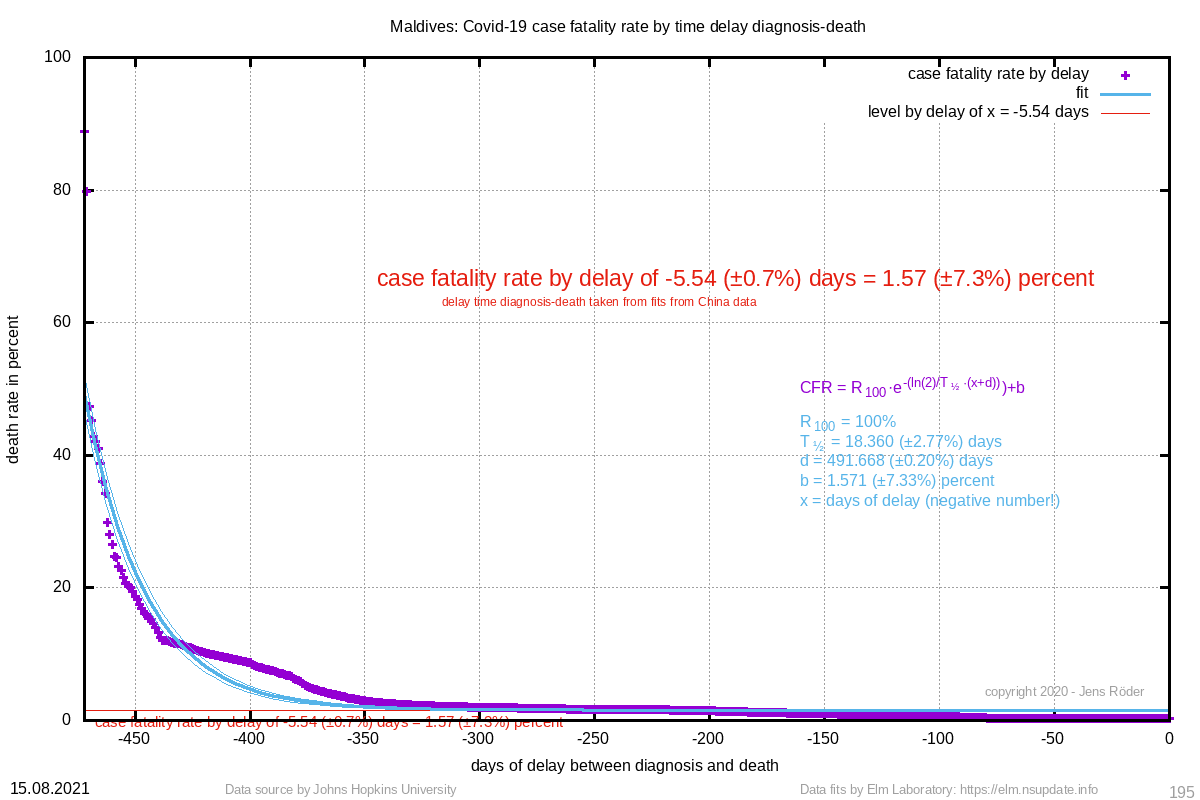 | 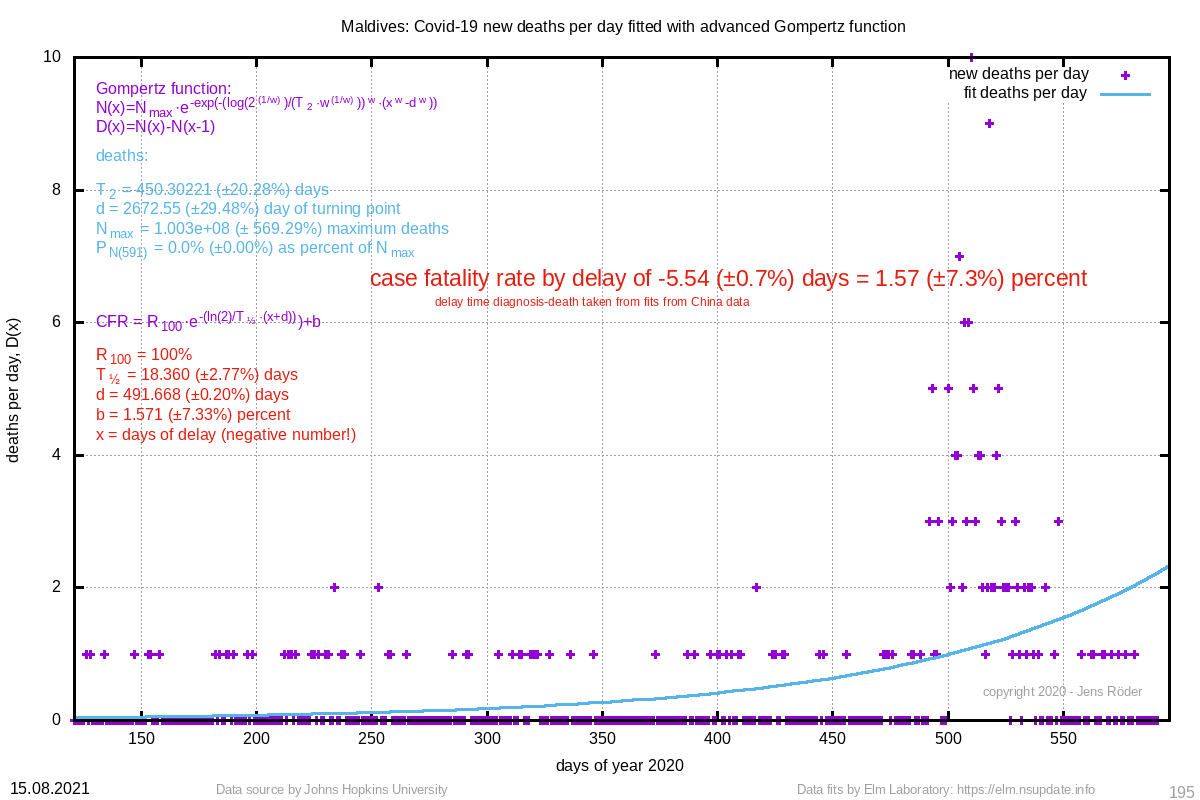 | 450.302 (±20.3%) | 2672.55 (±29.5%) |
| 197 French Guiana, France | 1270 (±51.2%) | 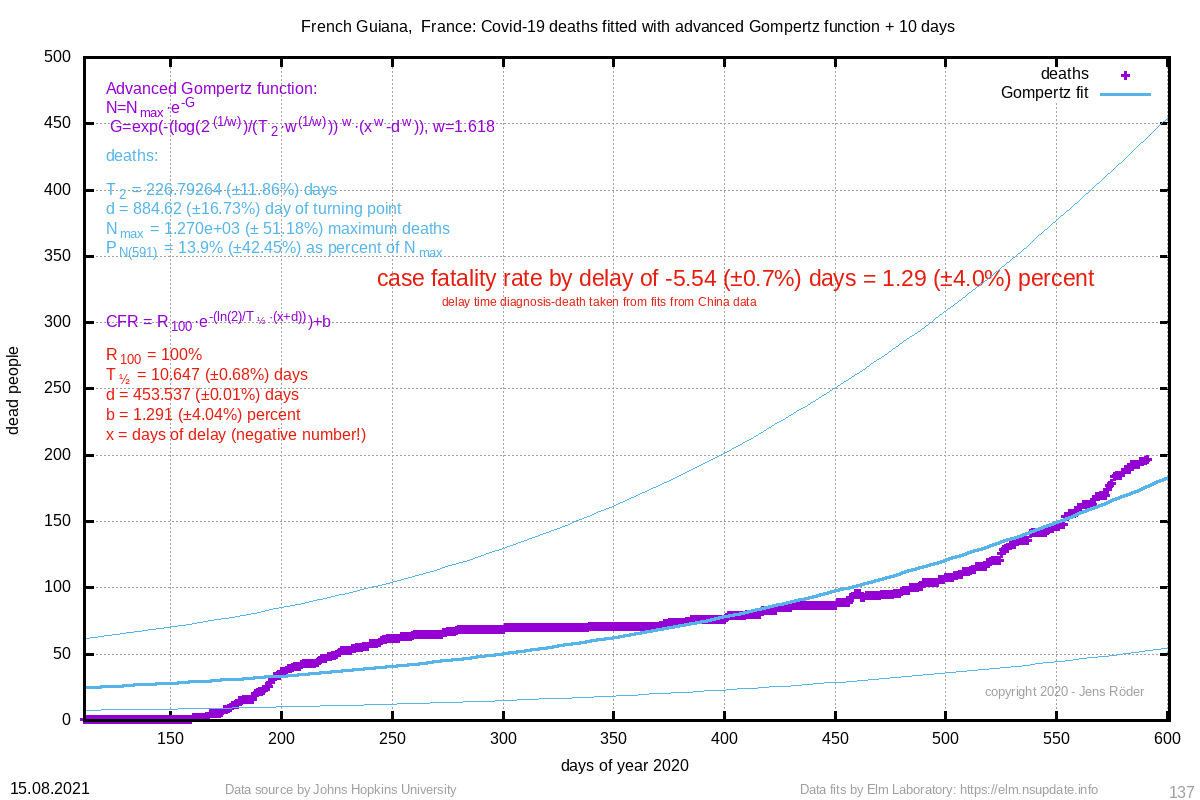 | 1.29 (±4.0%) | 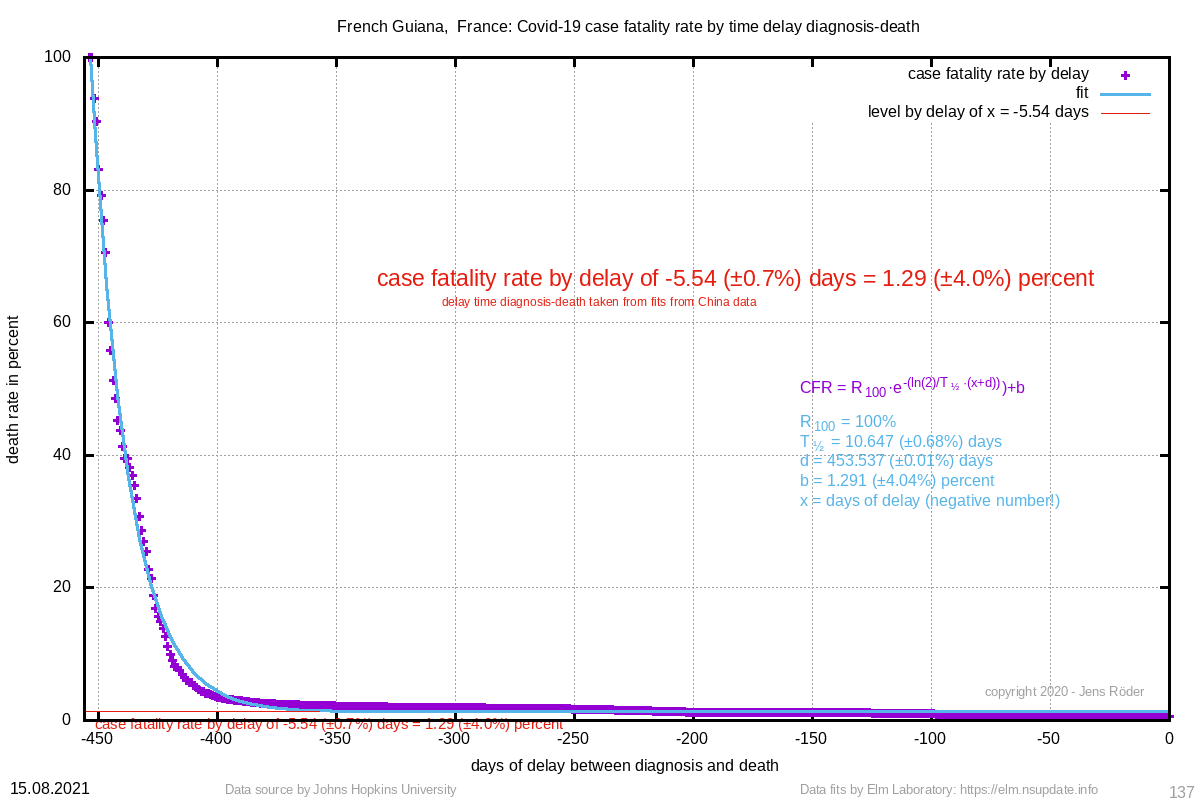 |  | 226.793 (±11.9%) | 884.62 (±16.7%) |
| 196 Niger | 253 (±3.1%) |  | 2.49 (±62.2%) | 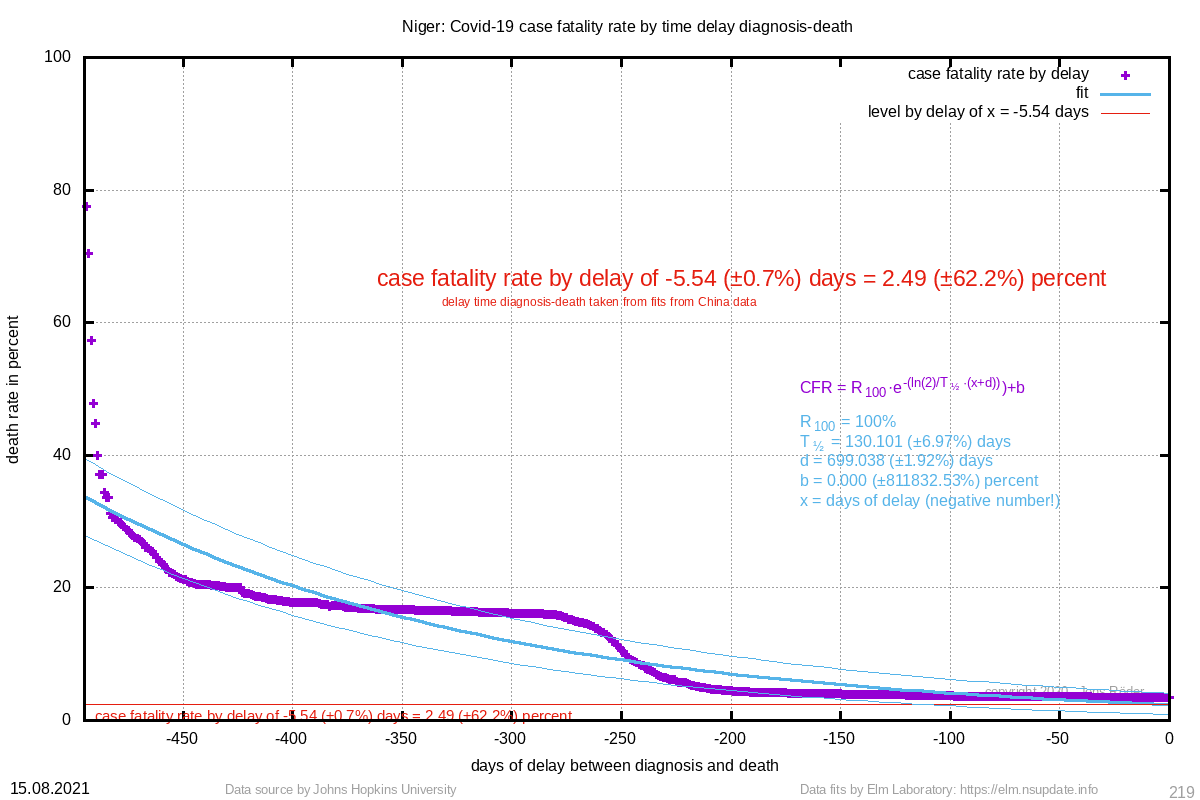 |  | 101.043 (±3.2%) | 302.97 (±2.6%) |
| 188 French Polynesia, France | 145 (±0.3%) | 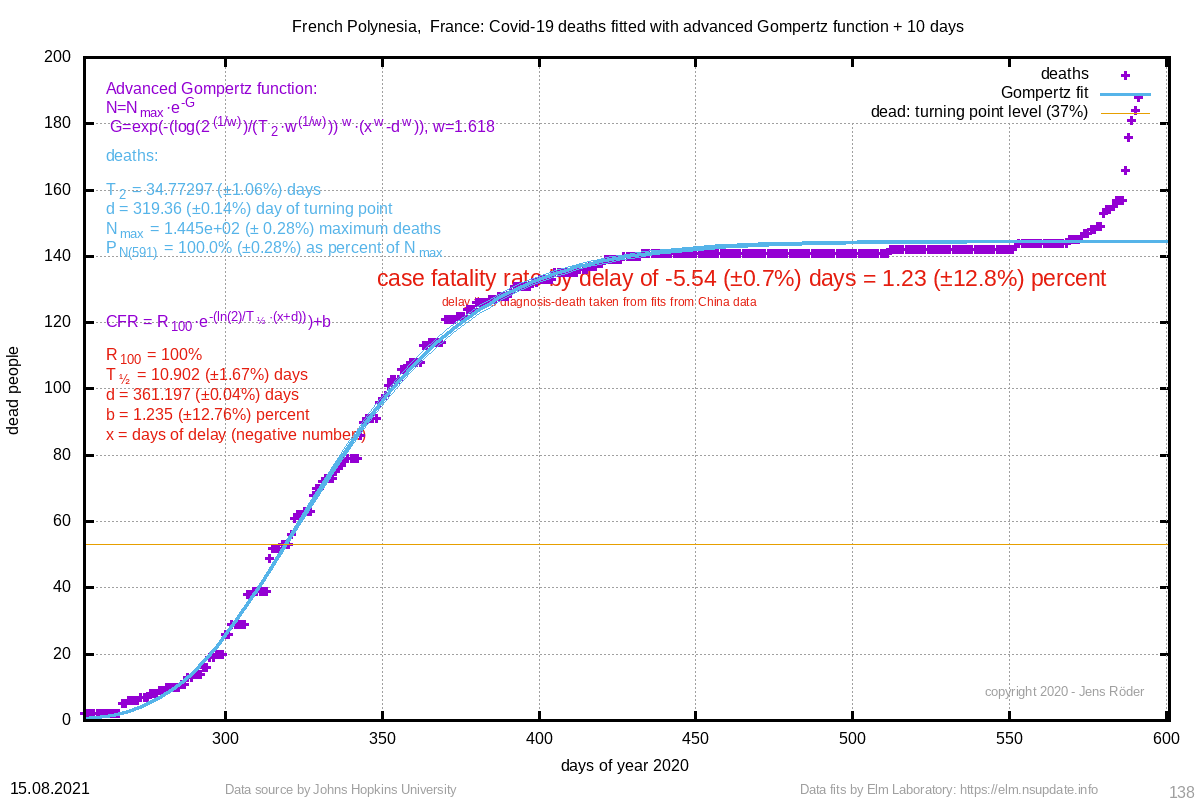 | 1.23 (±12.8%) | 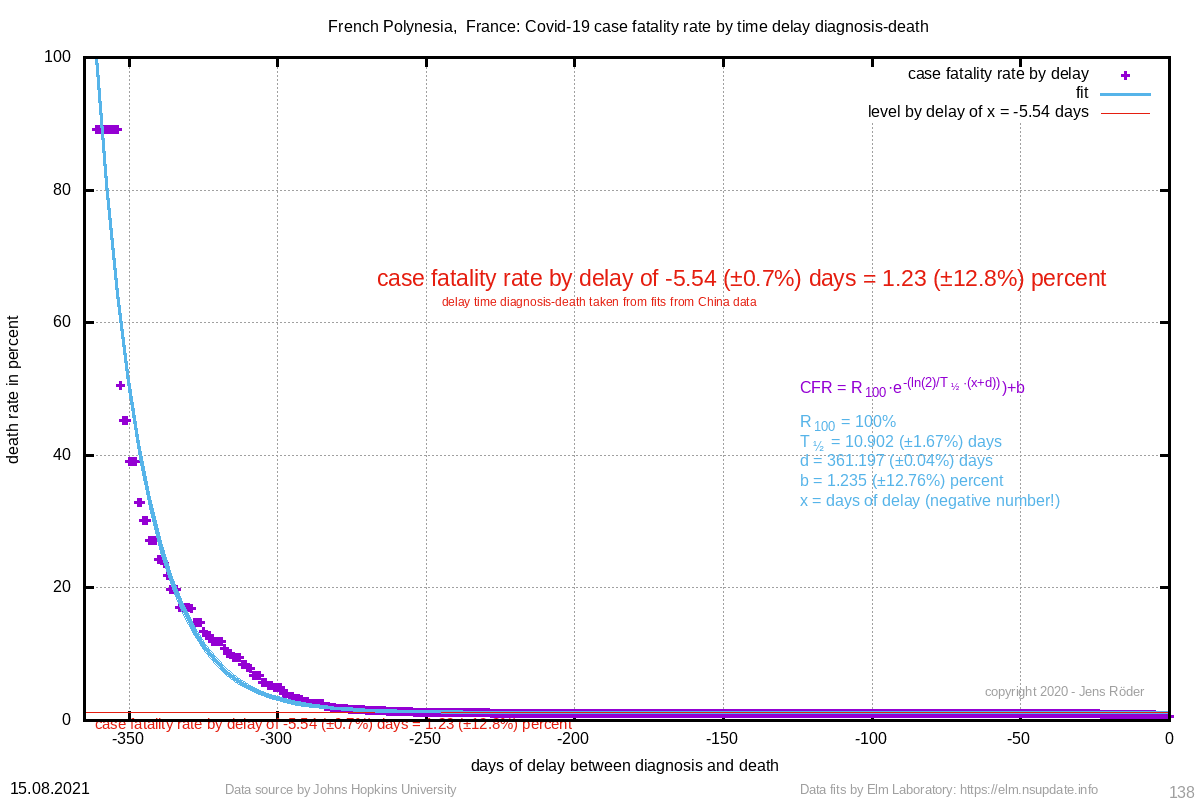 | 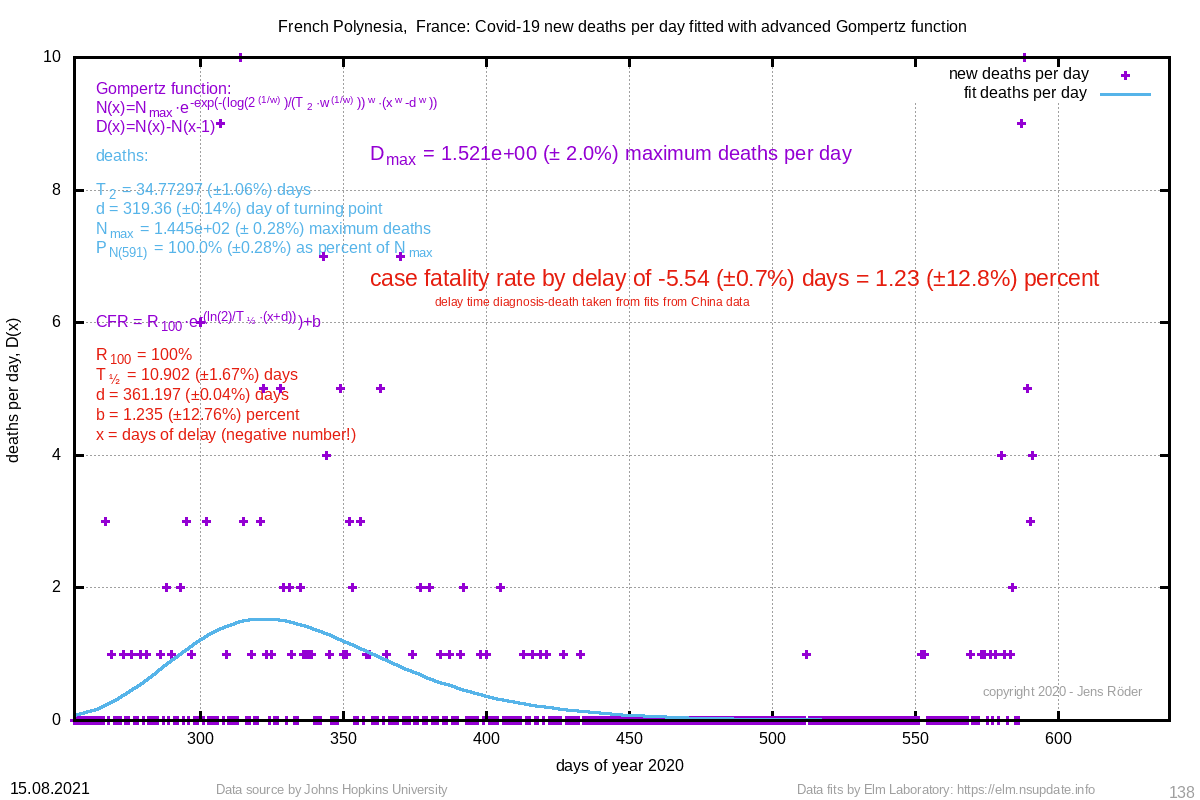 | 34.773 (±1.1%) | 319.36 (±0.1%) |
| 184 Martinique, France | 38654744 (±548.7%) | 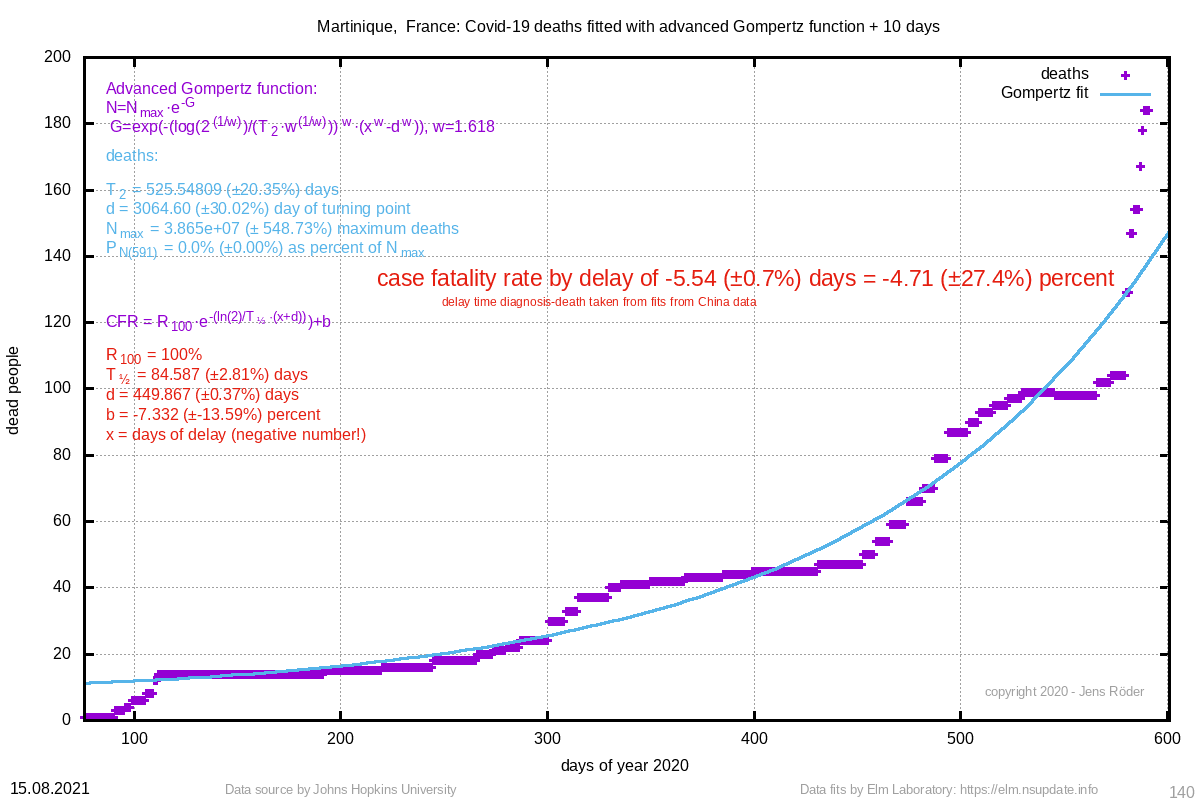 | fiterr (±err) | 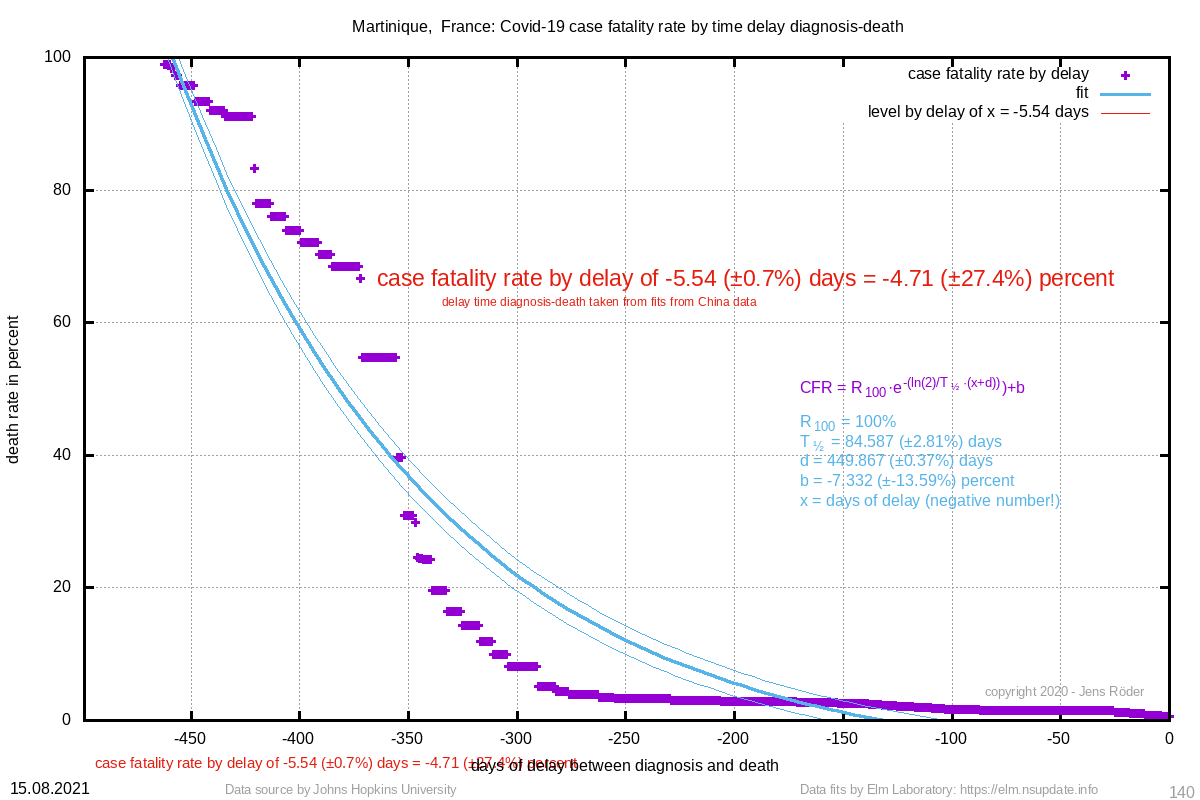 | 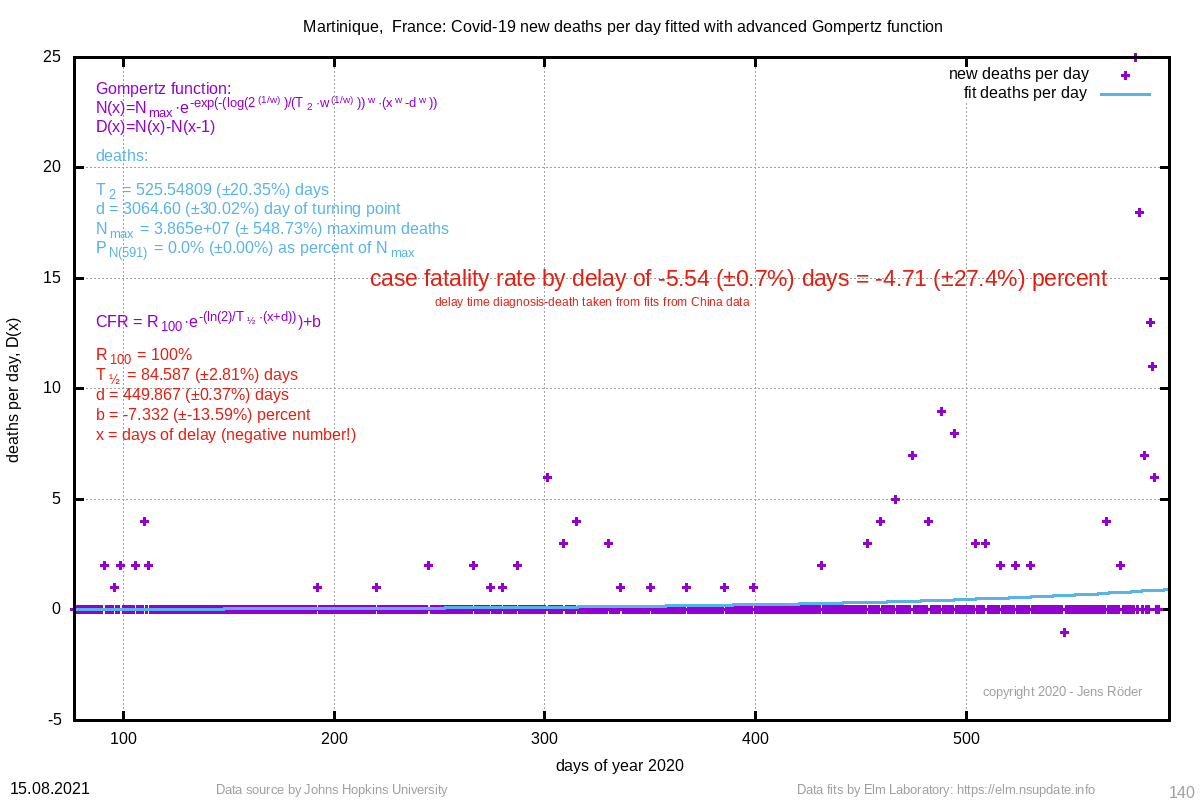 | 525.548 (±20.3%) | 3064.60 (±30.0%) |
| 179 Congo (Brazzaville) | 172 (±1.2%) |  | 2.13 (±3.2%) |  | 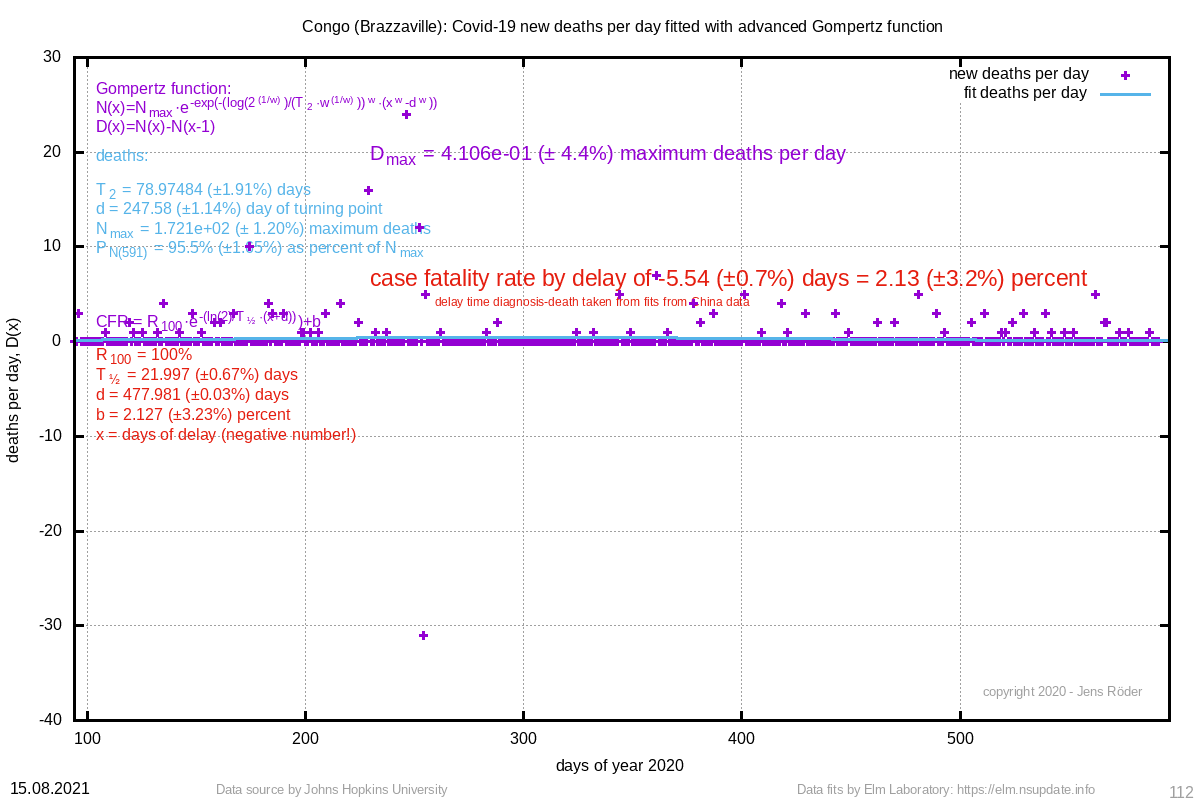 | 78.975 (±1.9%) | 247.58 (±1.1%) |
| 175 Mayotte, France | 283 (±5.4%) |  | 2.82 (±3.4%) |  | 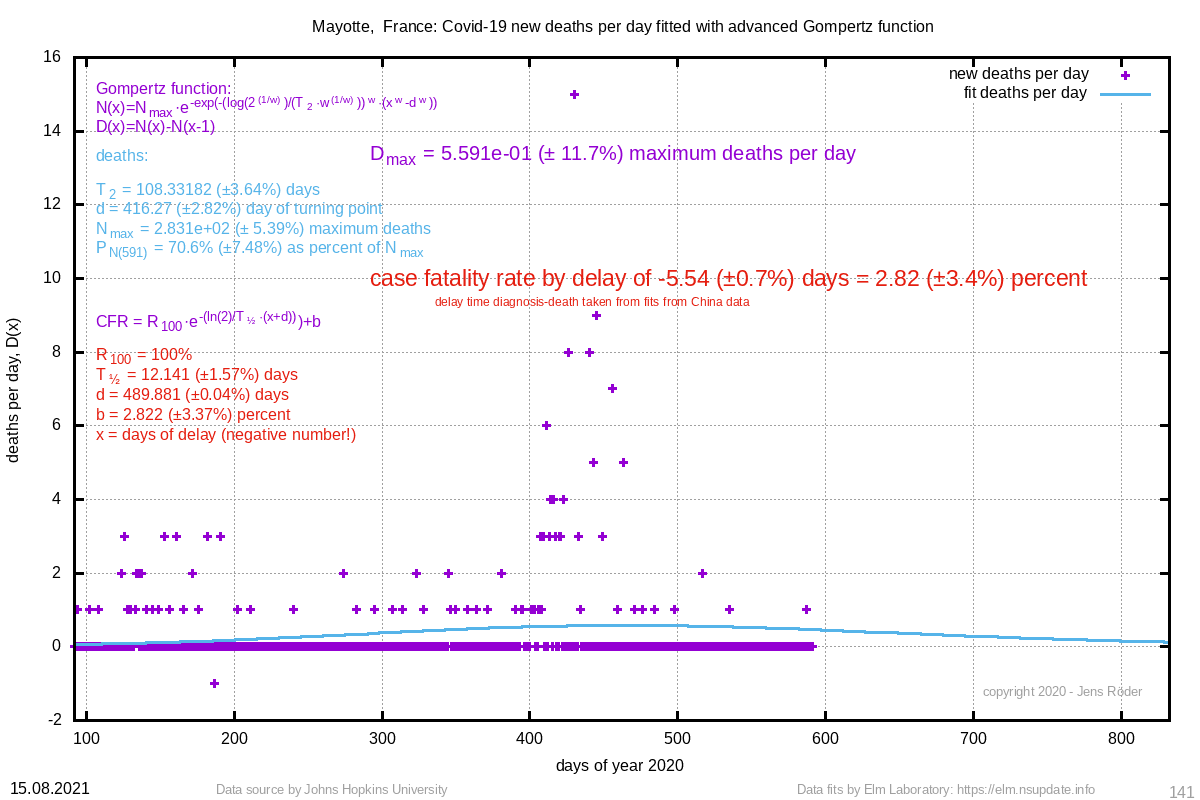 | 108.332 (±3.6%) | 416.27 (±2.8%) |
| 174 Chad | 227 (±2.8%) | 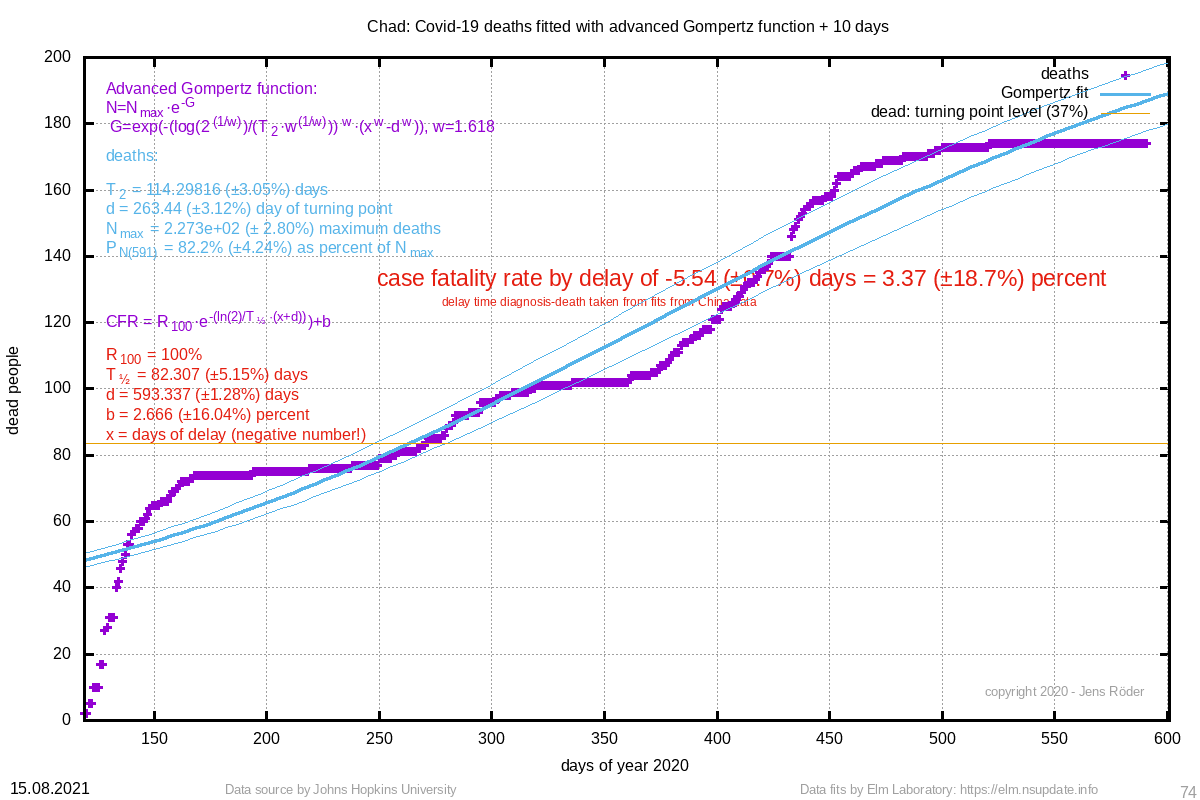 | 3.37 (±18.7%) | 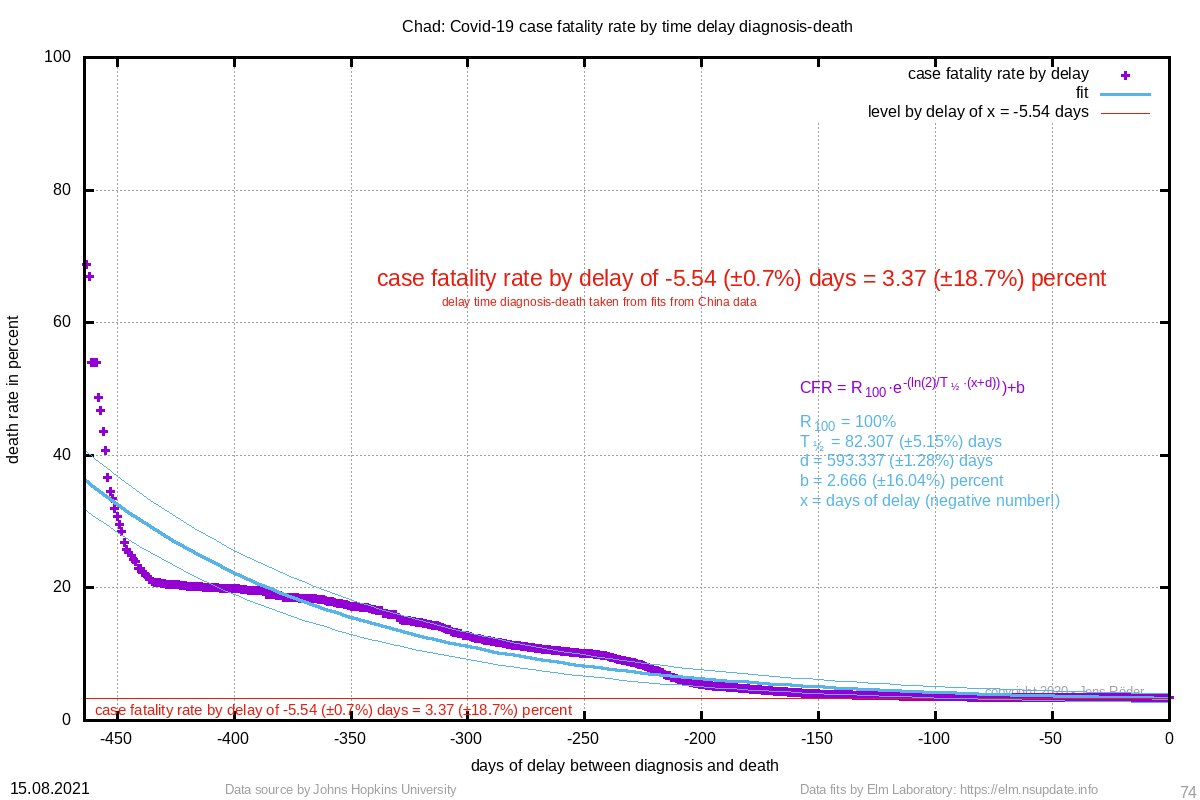 | 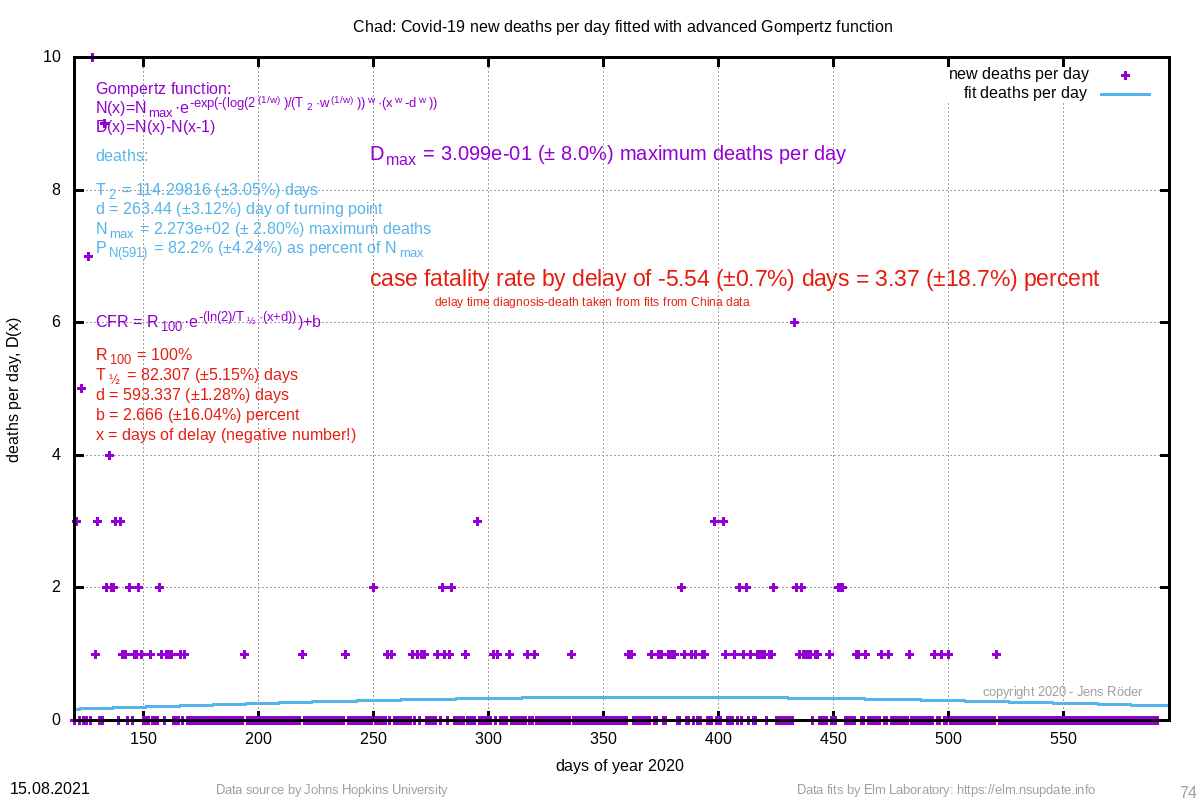 | 114.298 (±3.0%) | 263.44 (±3.1%) |
| 170 Burkina Faso | 245 (±3.7%) | 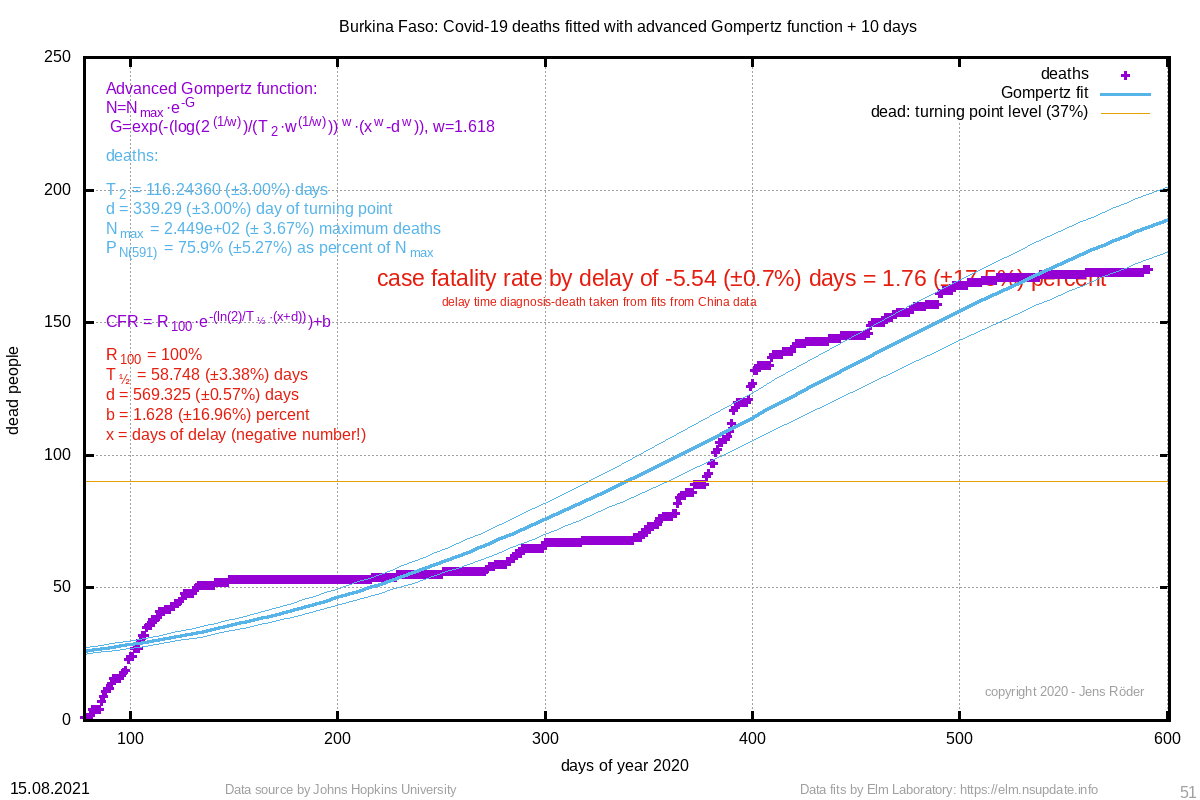 | 1.76 (±17.5%) | 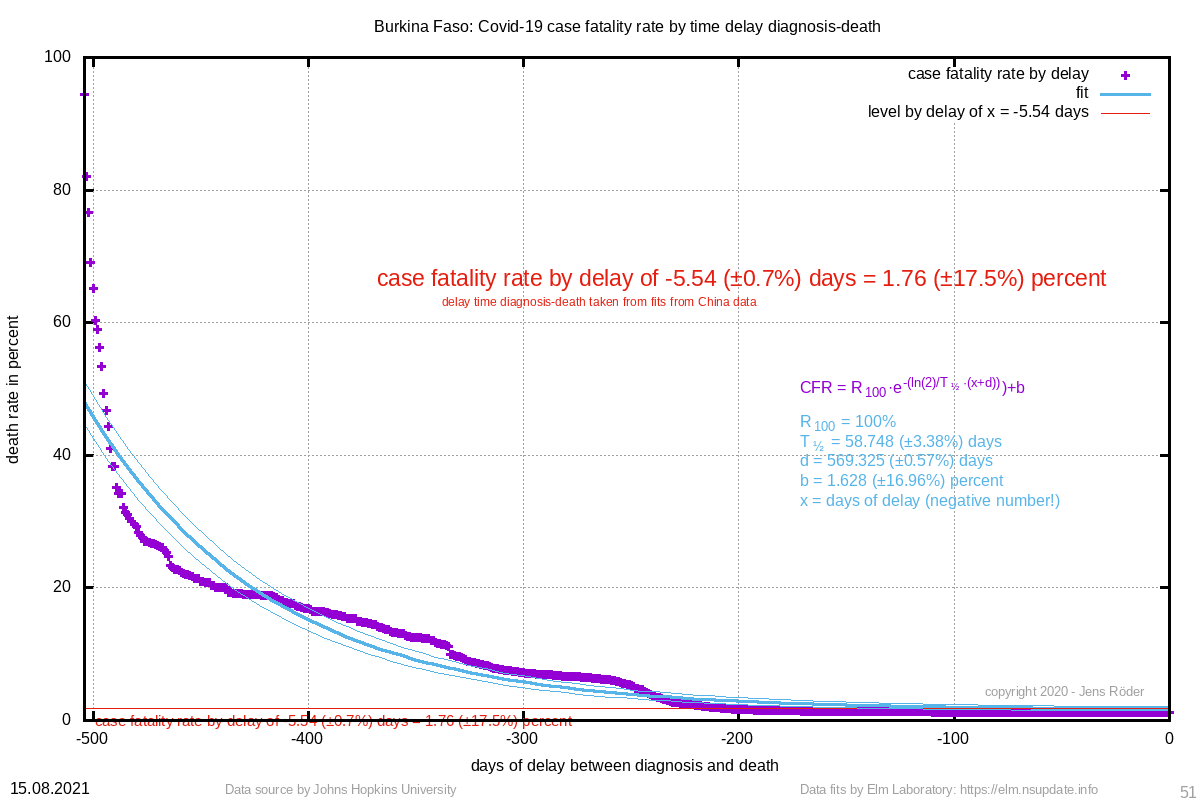 | 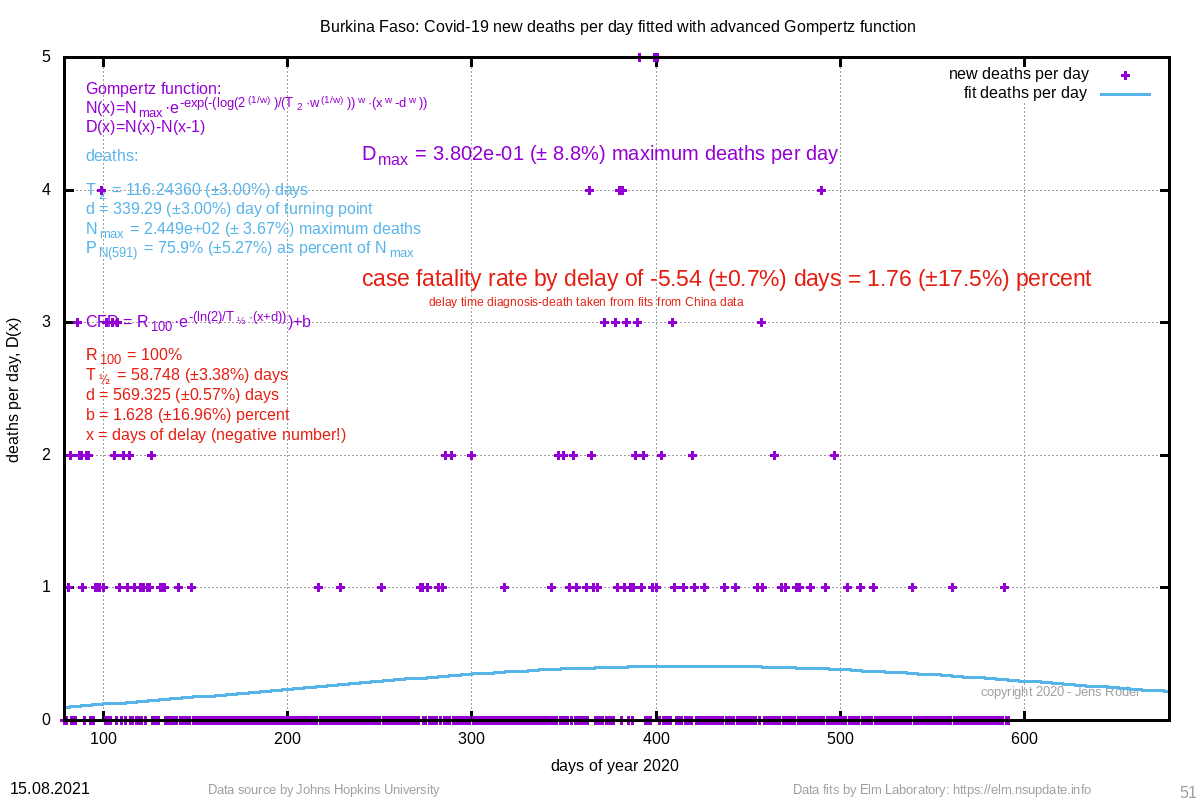 | 116.244 (±3.0%) | 339.29 (±3.0%) |
| 165 Togo | 375897979 (±1106.6%) | 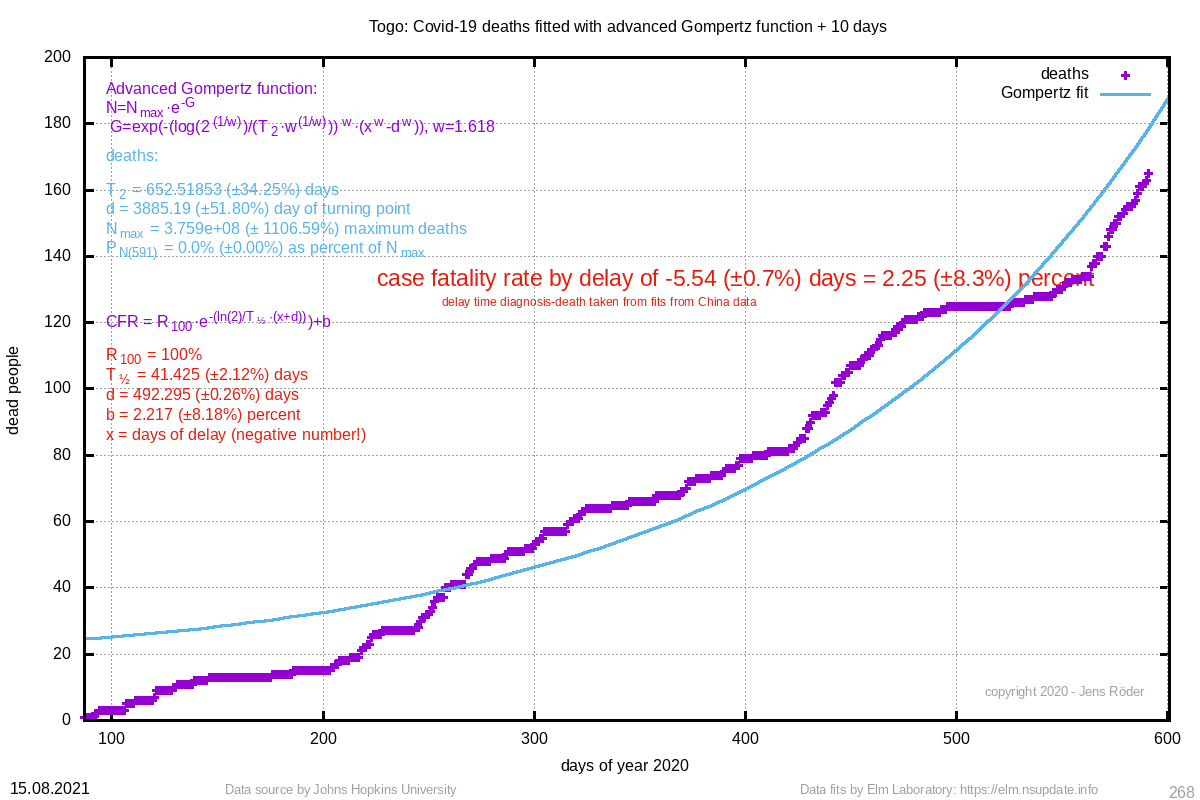 | 2.25 (±8.3%) | 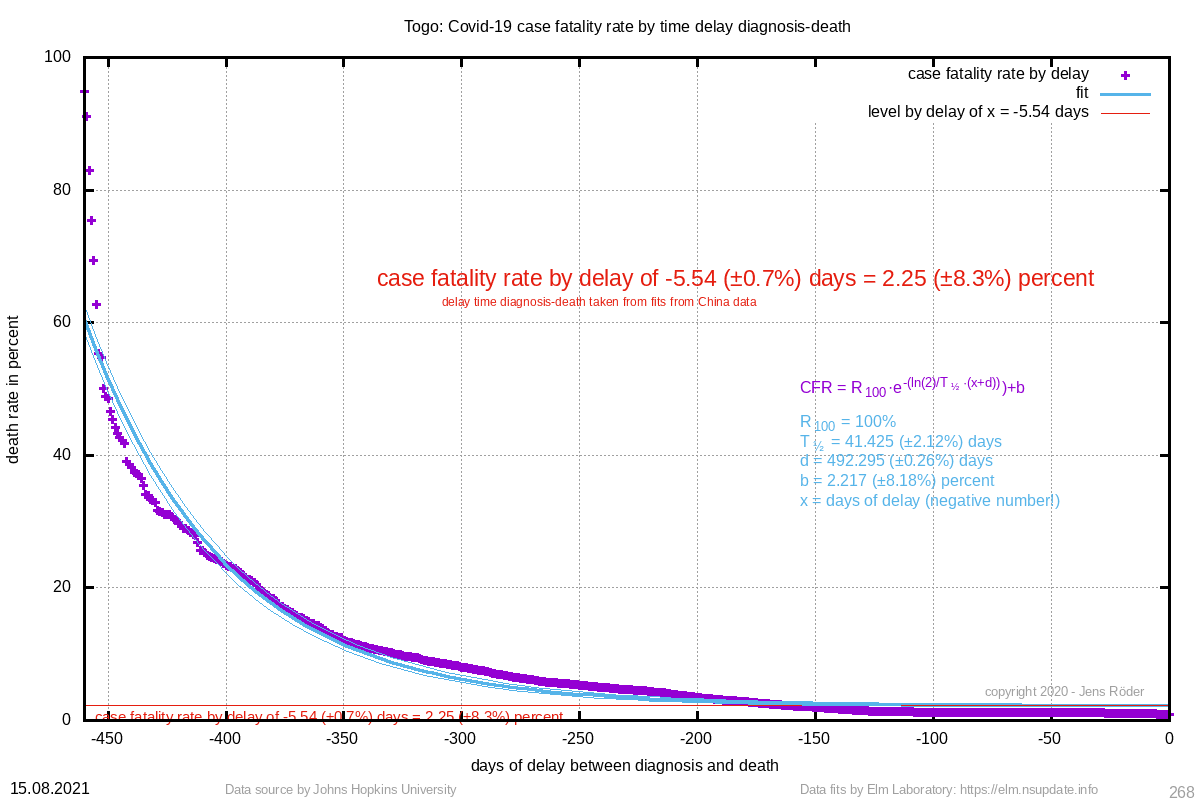 |  | 652.519 (±34.3%) | 3885.19 (±51.8%) |
| 156 Djibouti | 1433819 (±730.0%) | 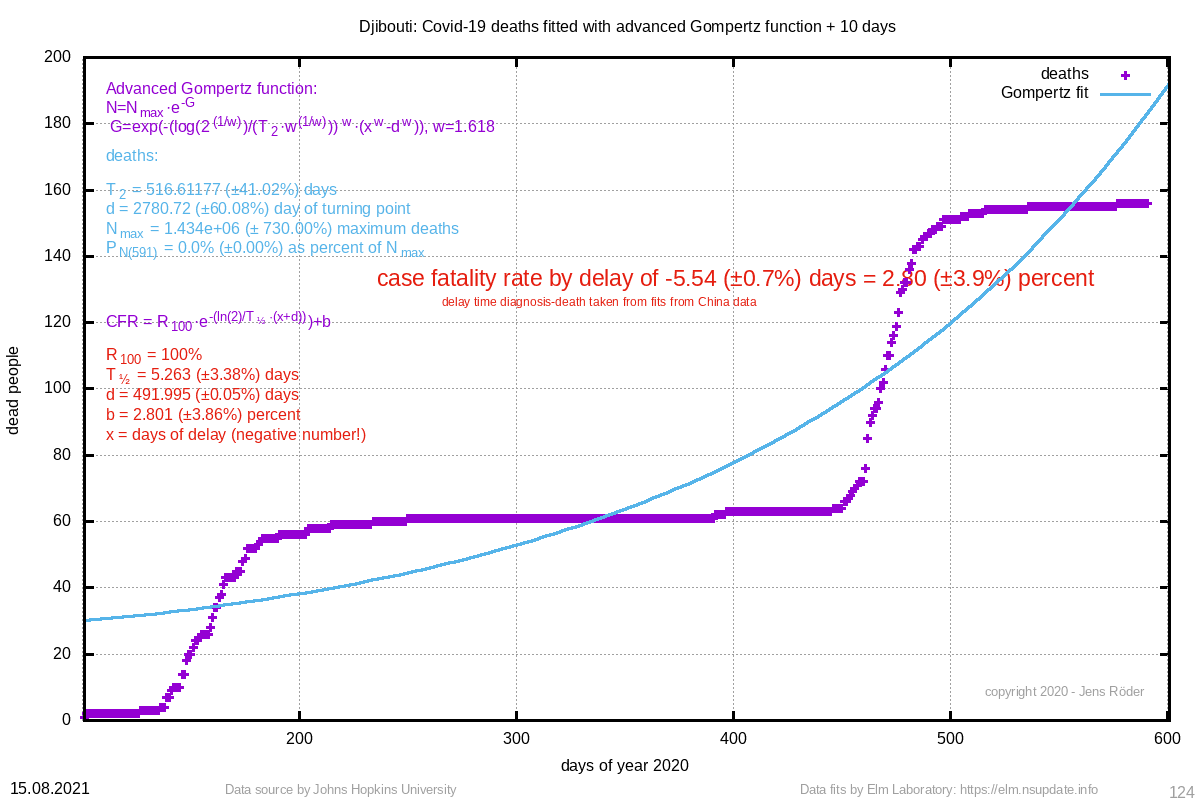 | 2.80 (±3.9%) | 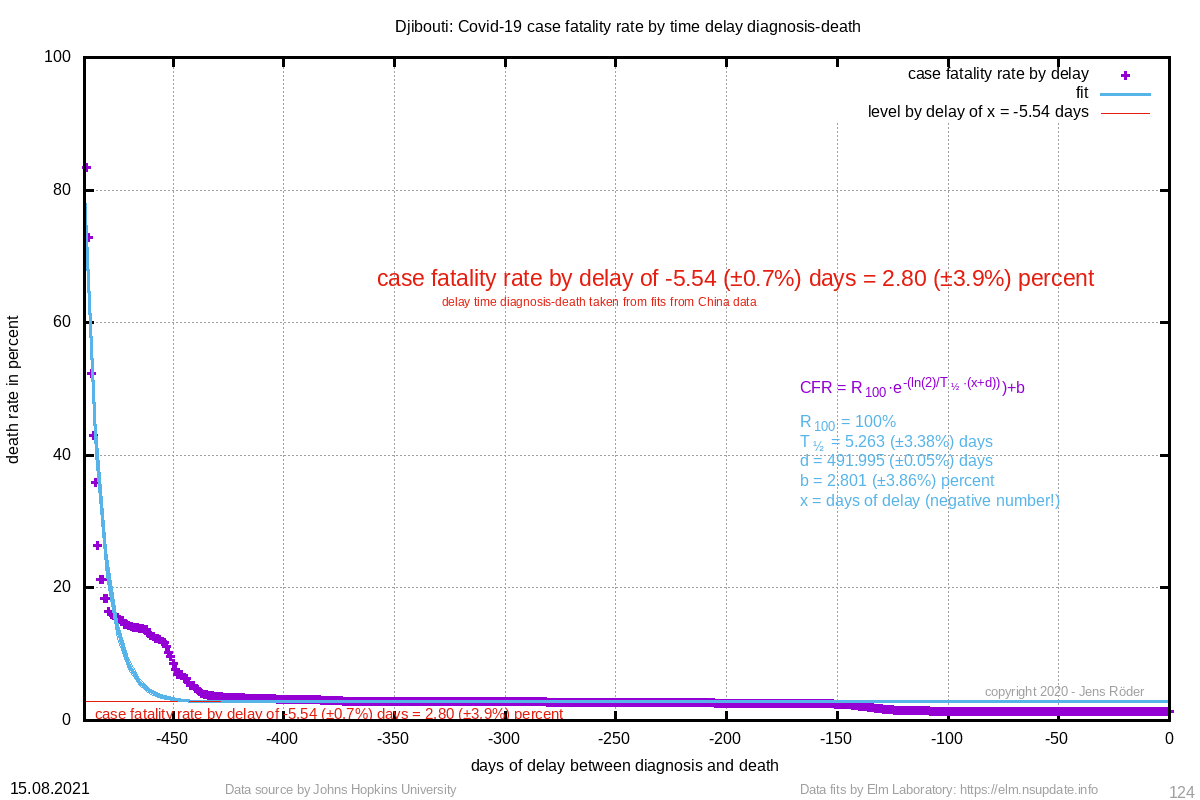 | 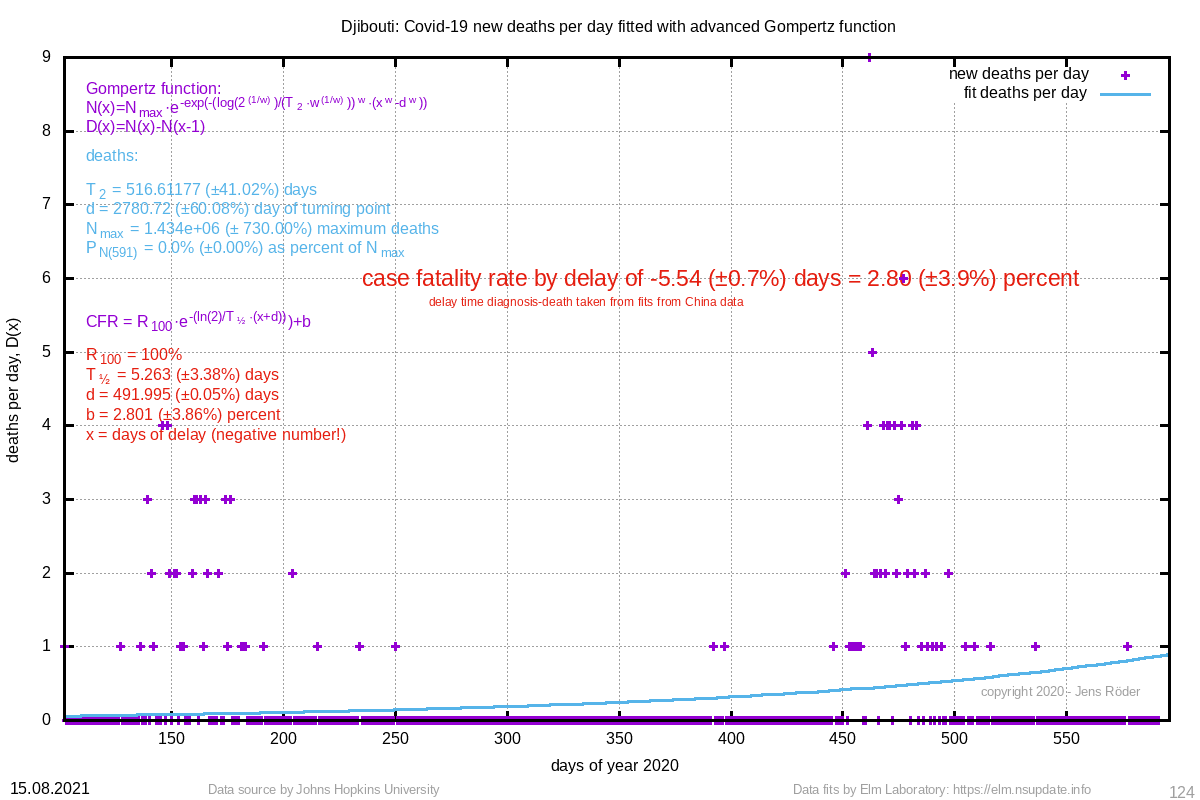 | 516.612 (±41.0%) | 2780.72 (±60.1%) |
| 129 Andorra | 157 (±2.0%) | 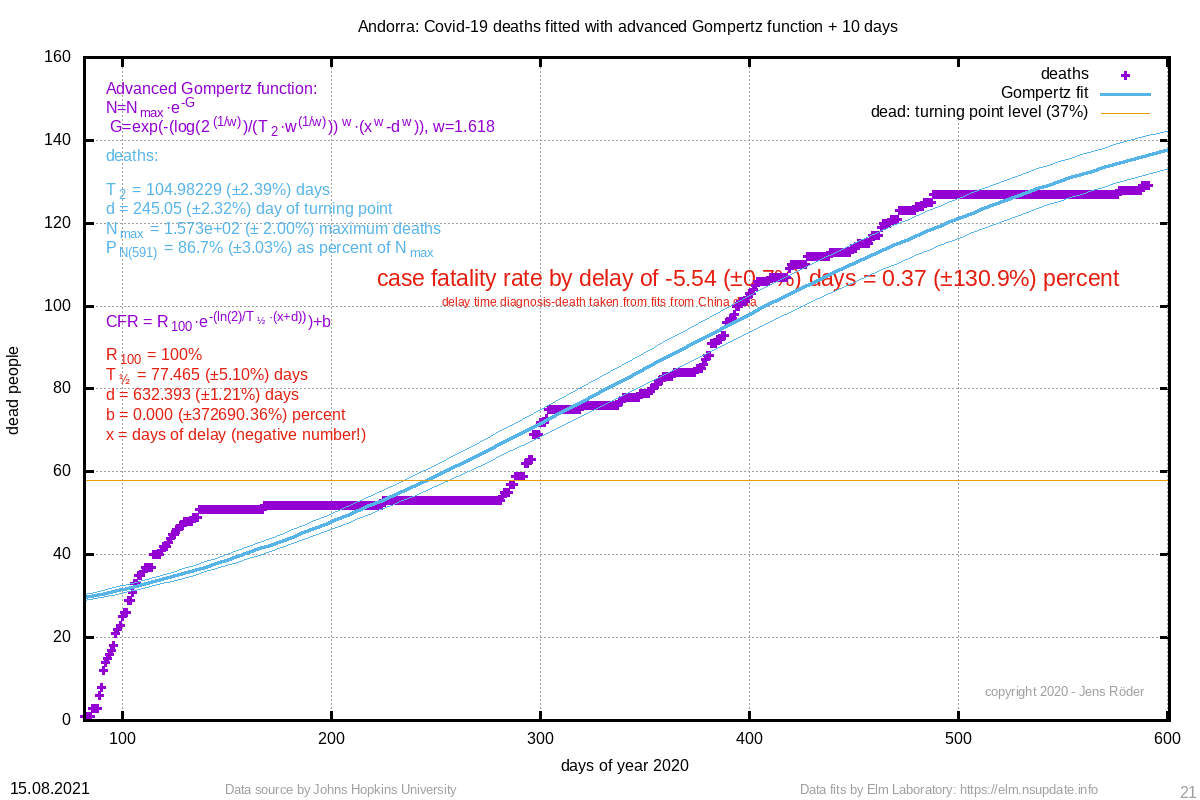 | fiterr (±err) | 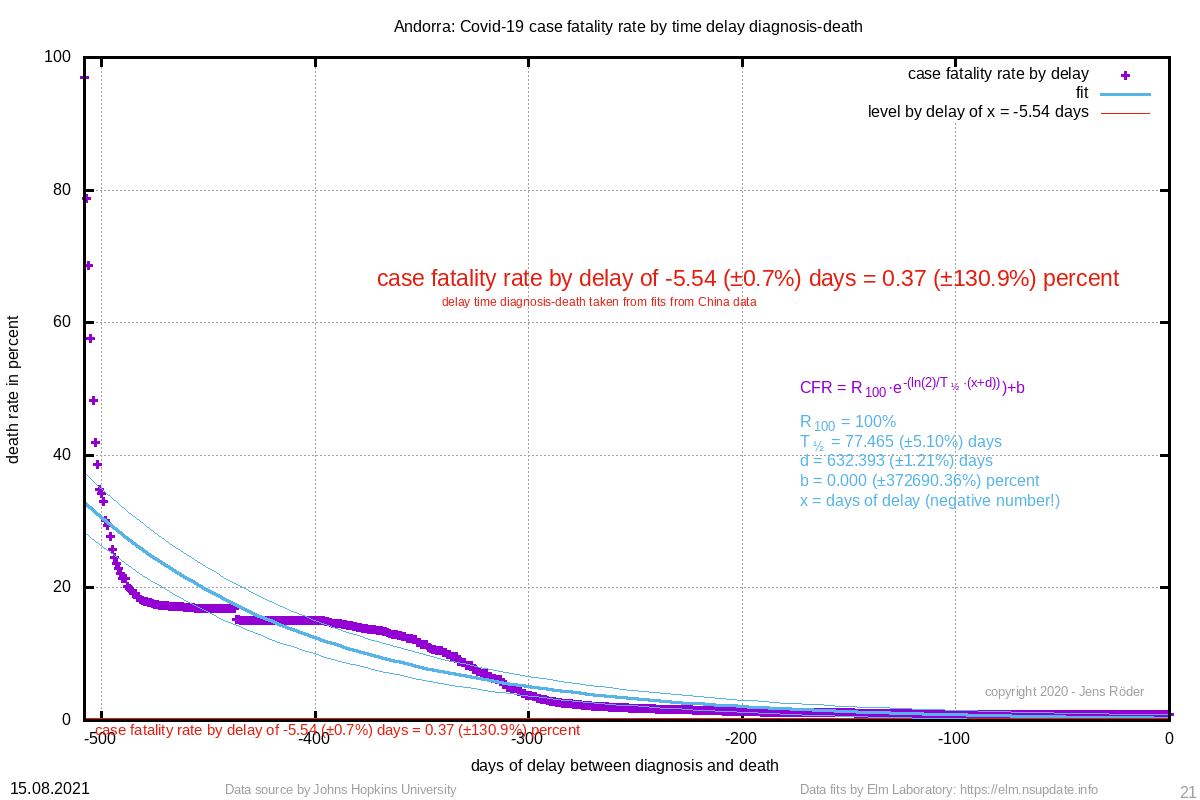 | 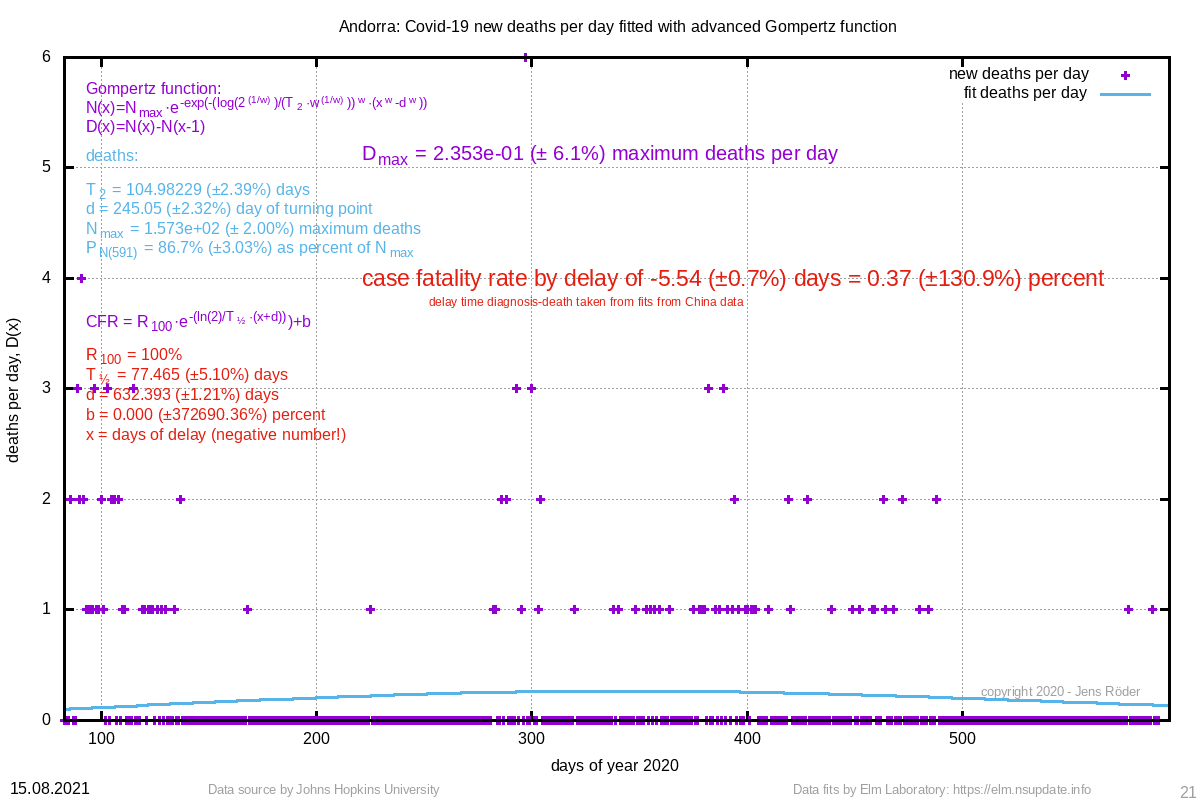 | 104.982 (±2.4%) | 245.05 (±2.3%) |
| 123 Equatorial Guinea | 103 (±0.8%) | 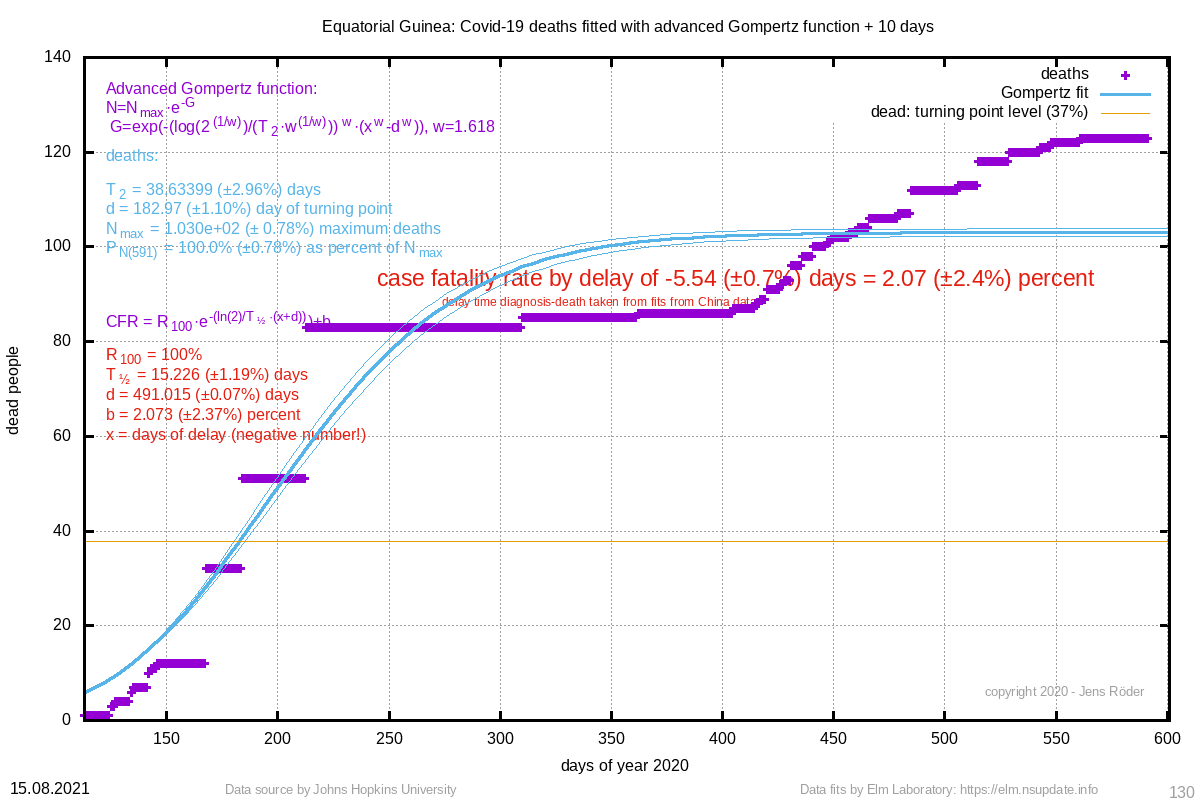 | 2.07 (±2.4%) | 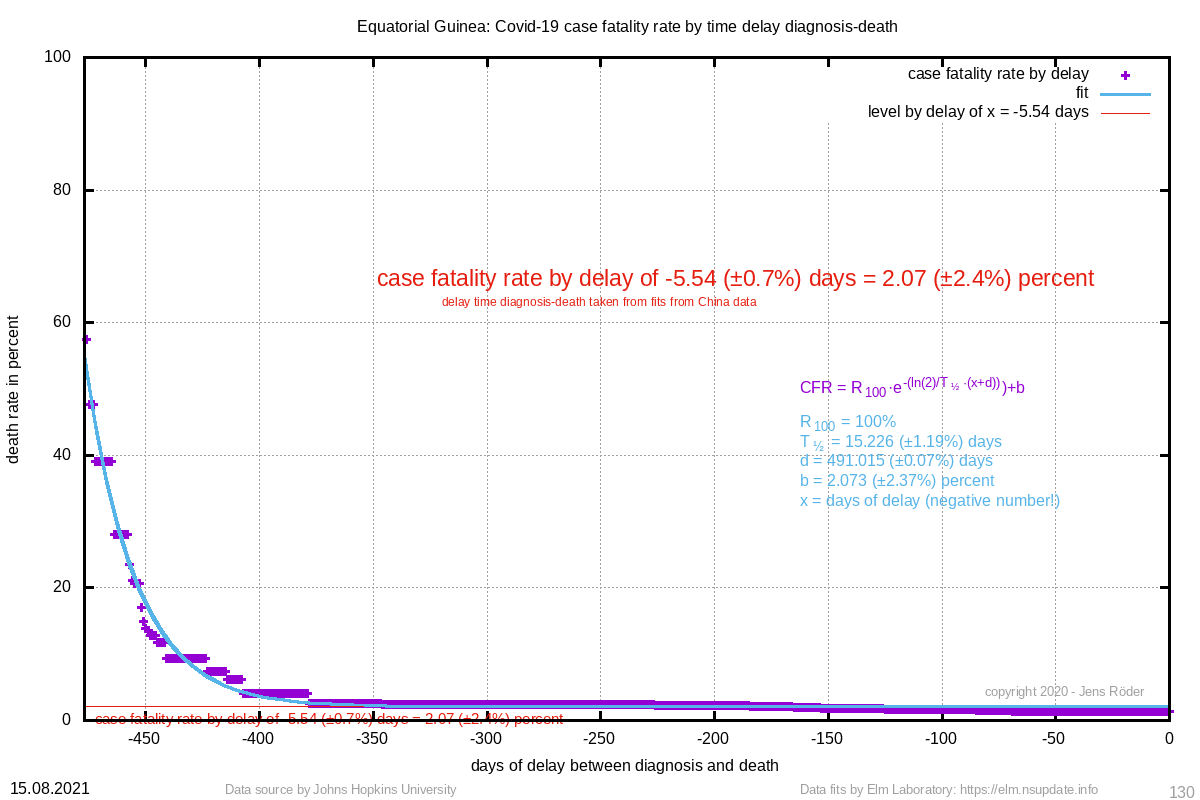 | 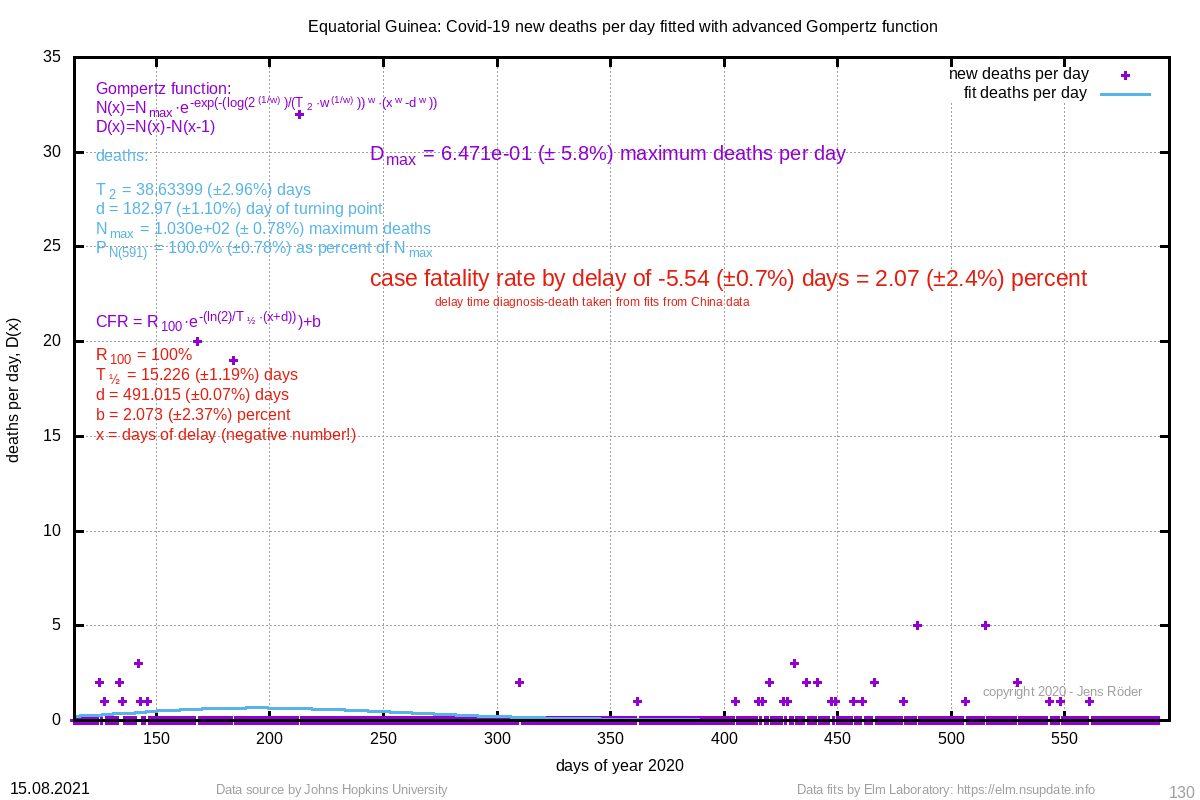 | 38.634 (±3.0%) | 182.97 (±1.1%) |
| 113 Benin | 147 (±3.6%) | 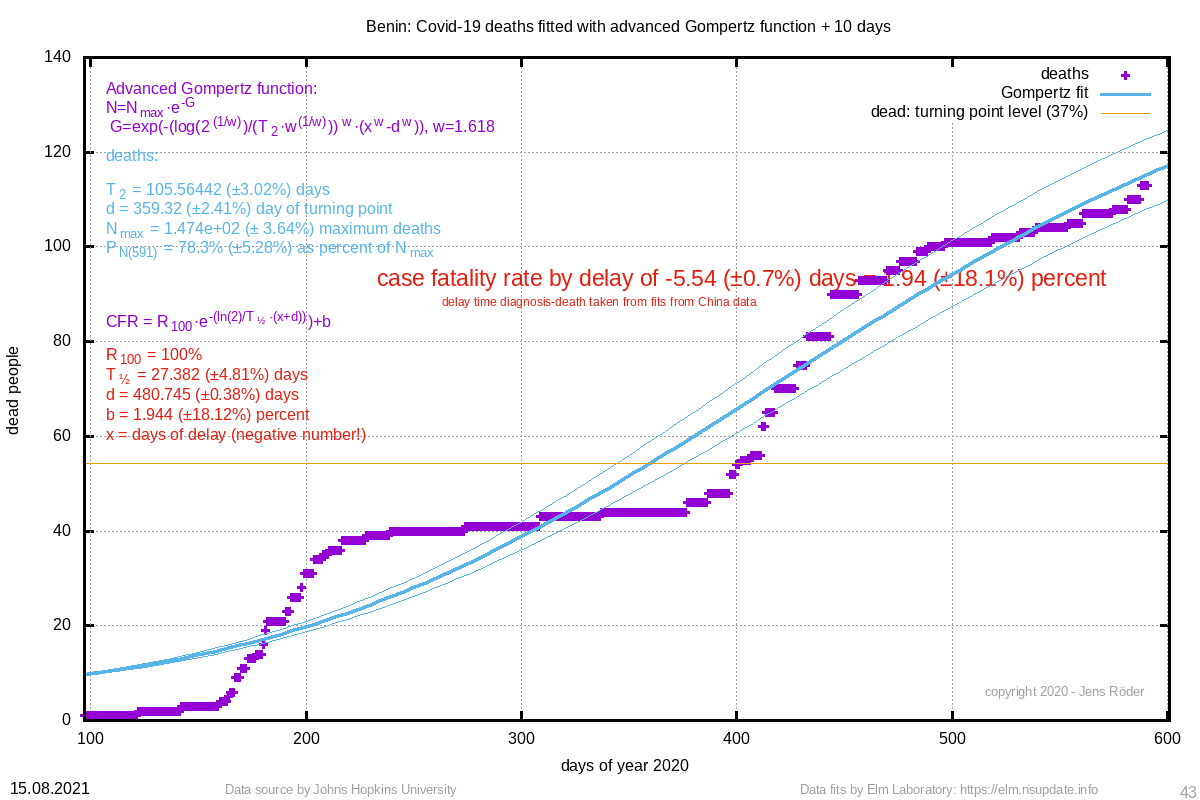 | 1.94 (±18.1%) | 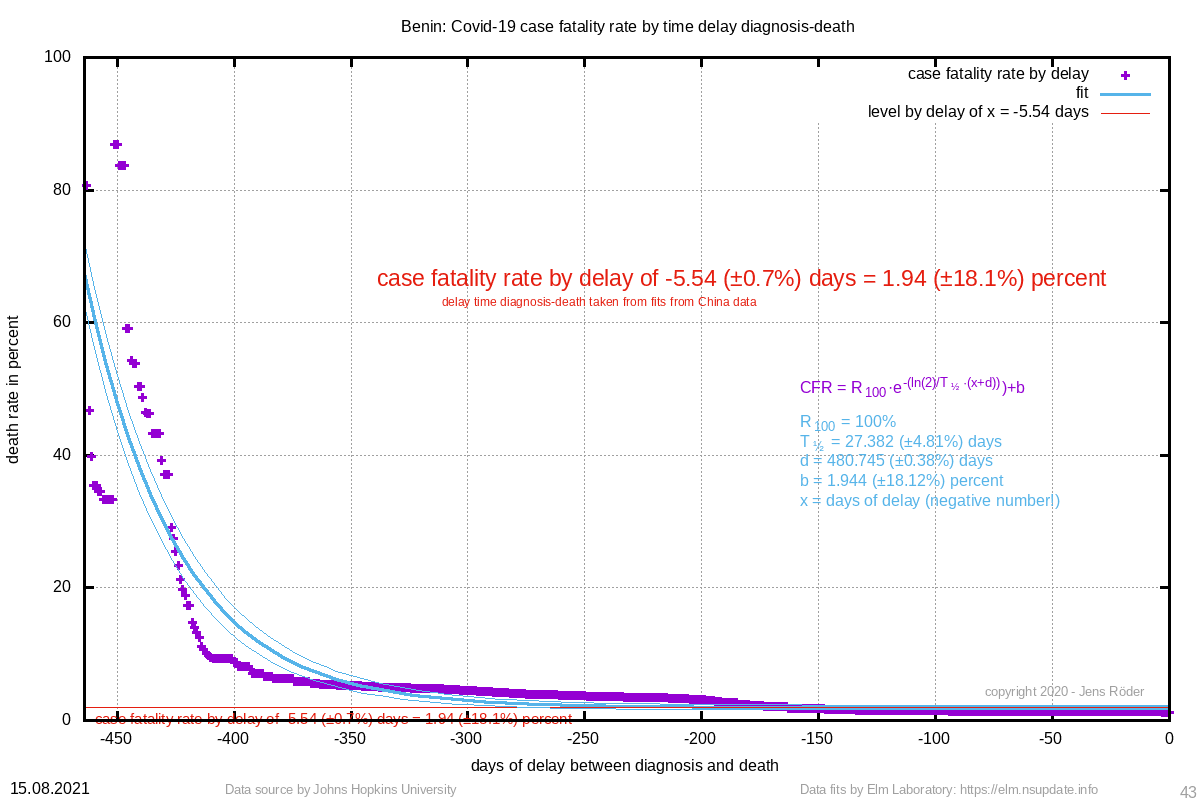 | 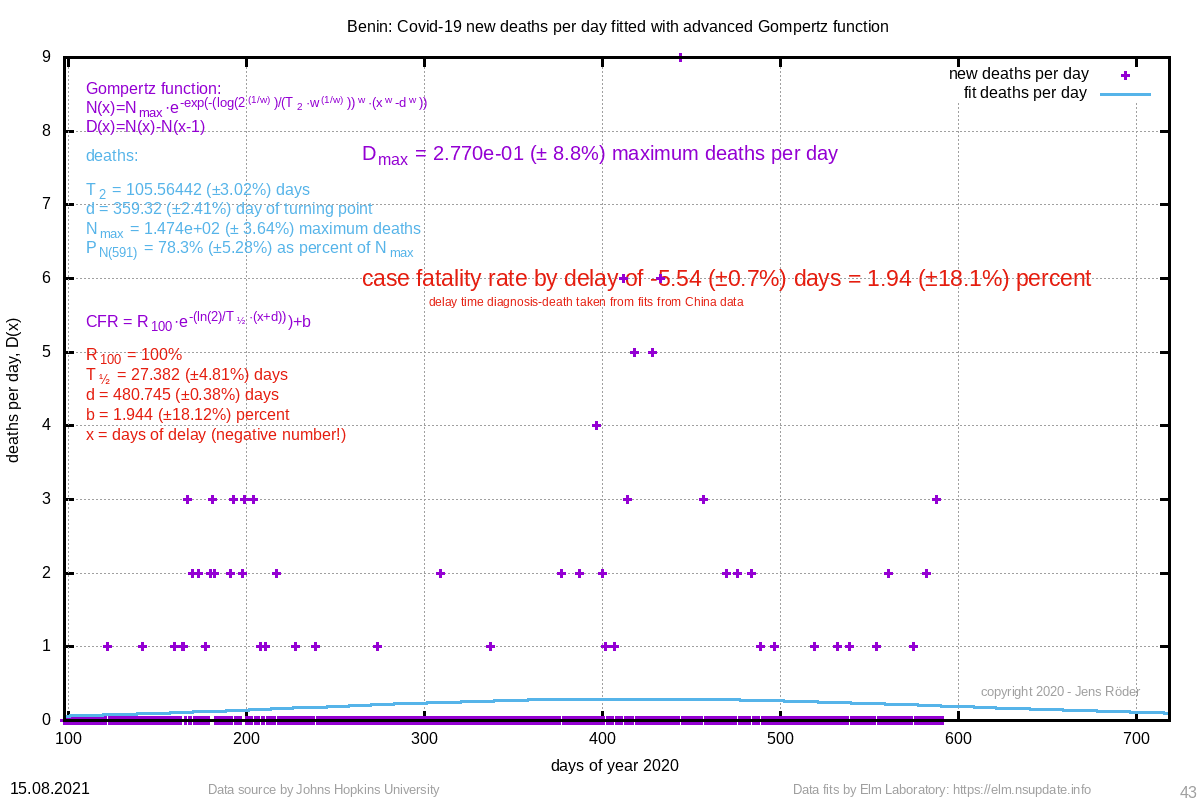 | 105.564 (±3.0%) | 359.32 (±2.4%) |
| 98 Central African Republic | 140 (±11.8%) | 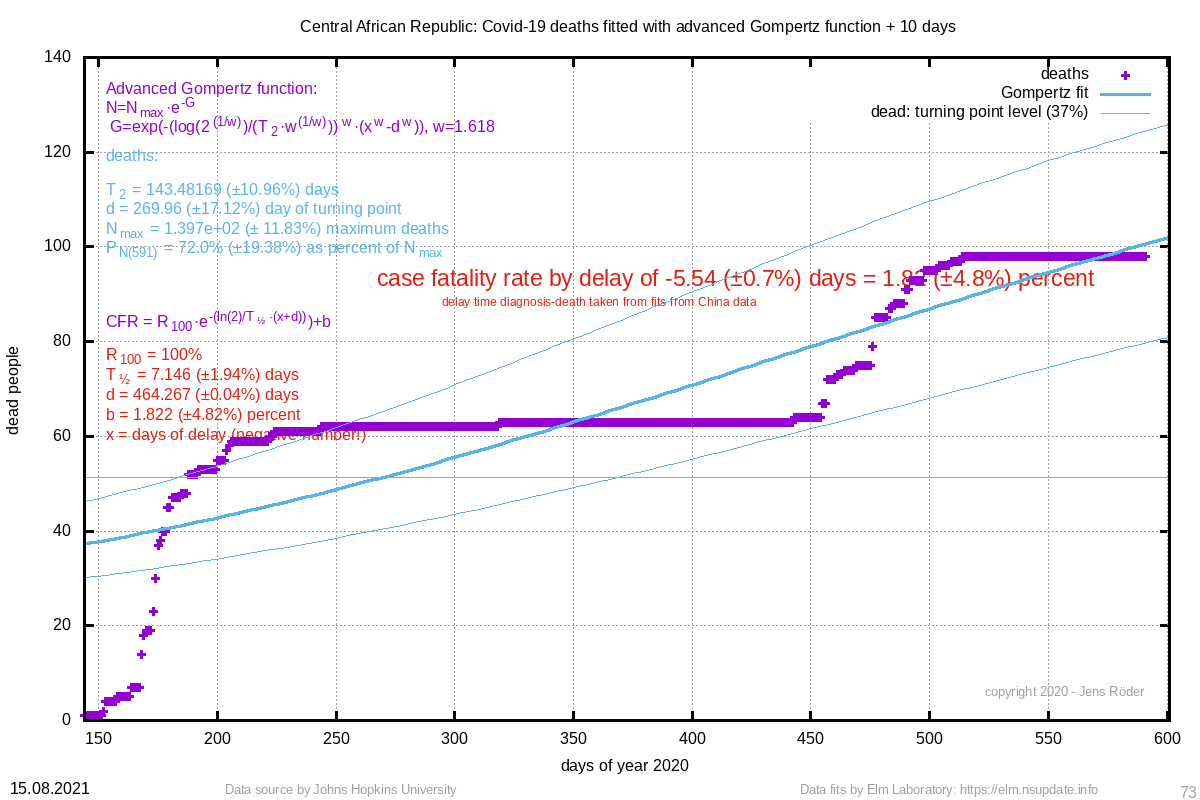 | 1.82 (±4.8%) | 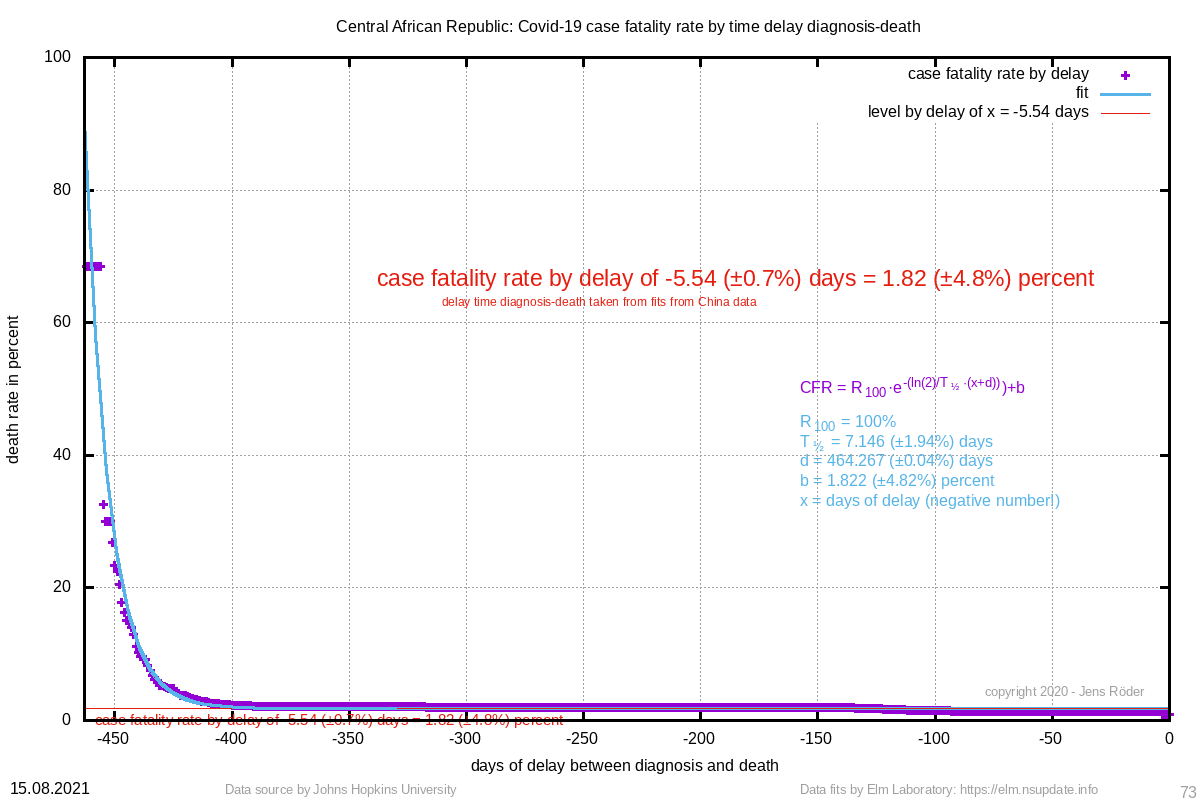 | 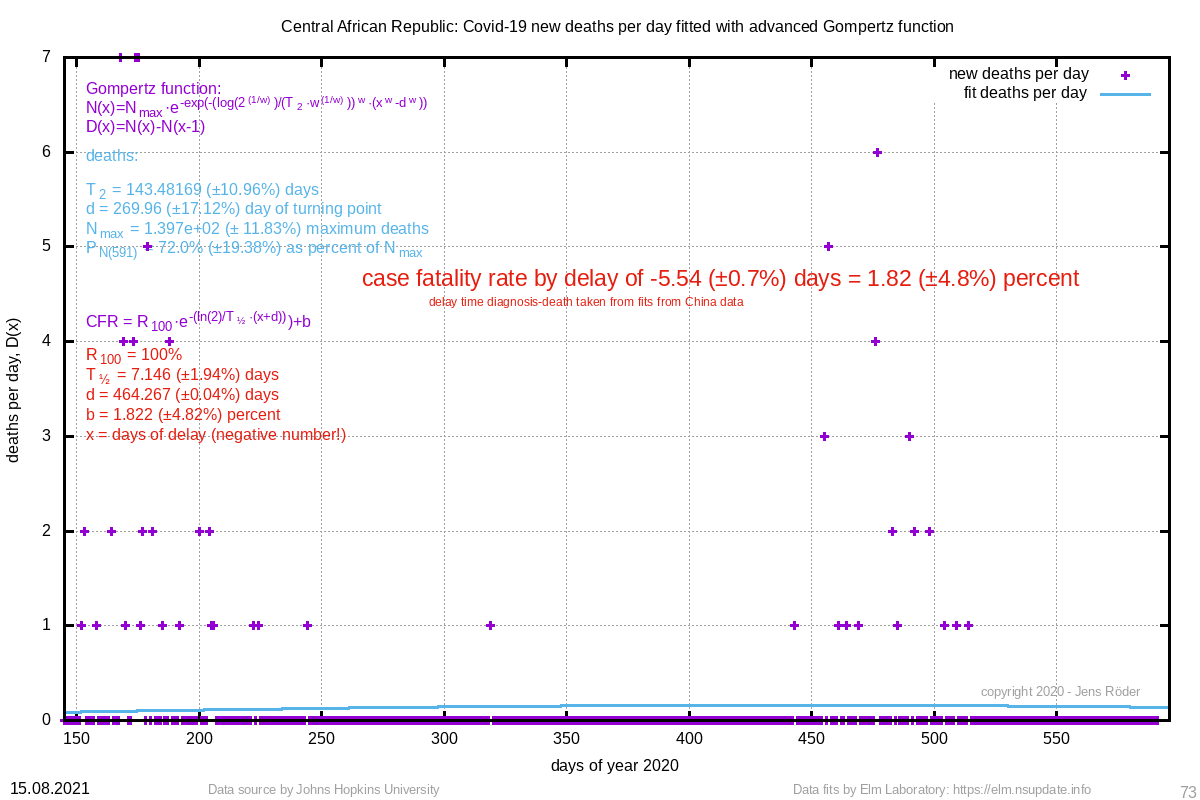 | 143.482 (±11.0%) | 269.96 (±17.1%) |
| 97 New South Wales, Australia | 54 (±0.5%) | 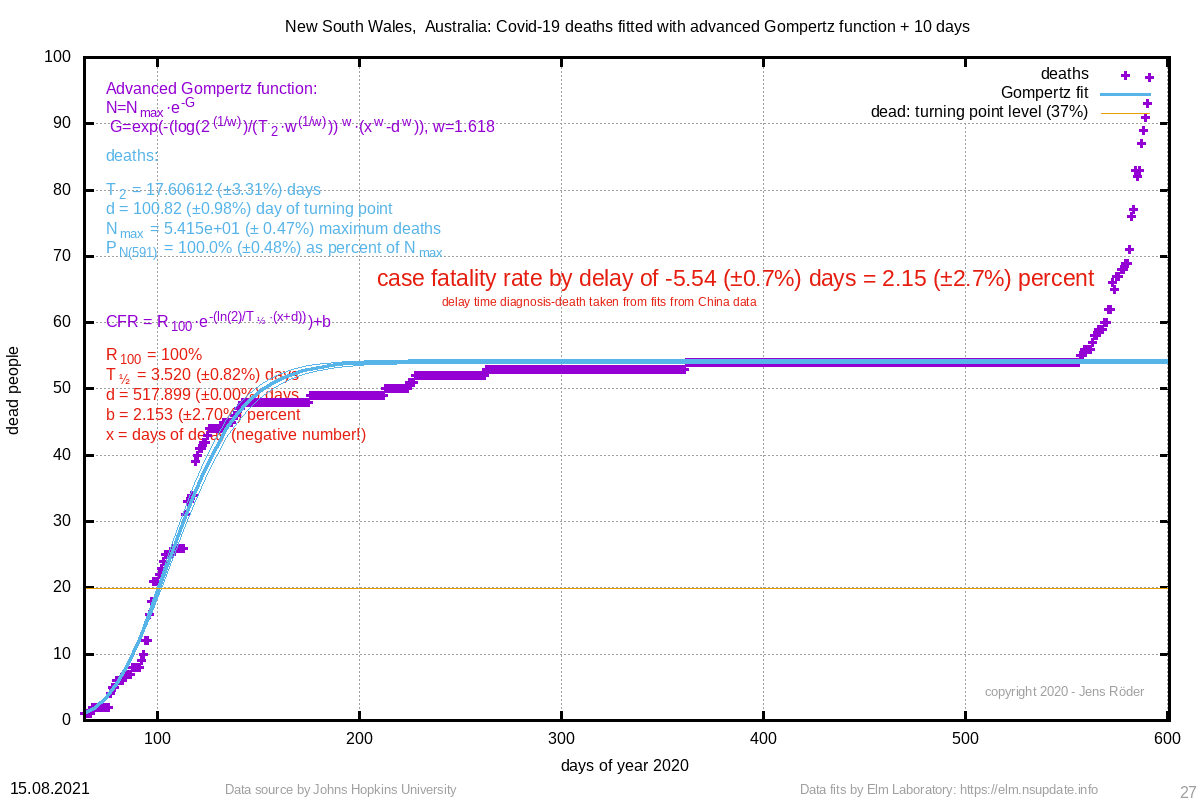 | 2.15 (±2.7%) | 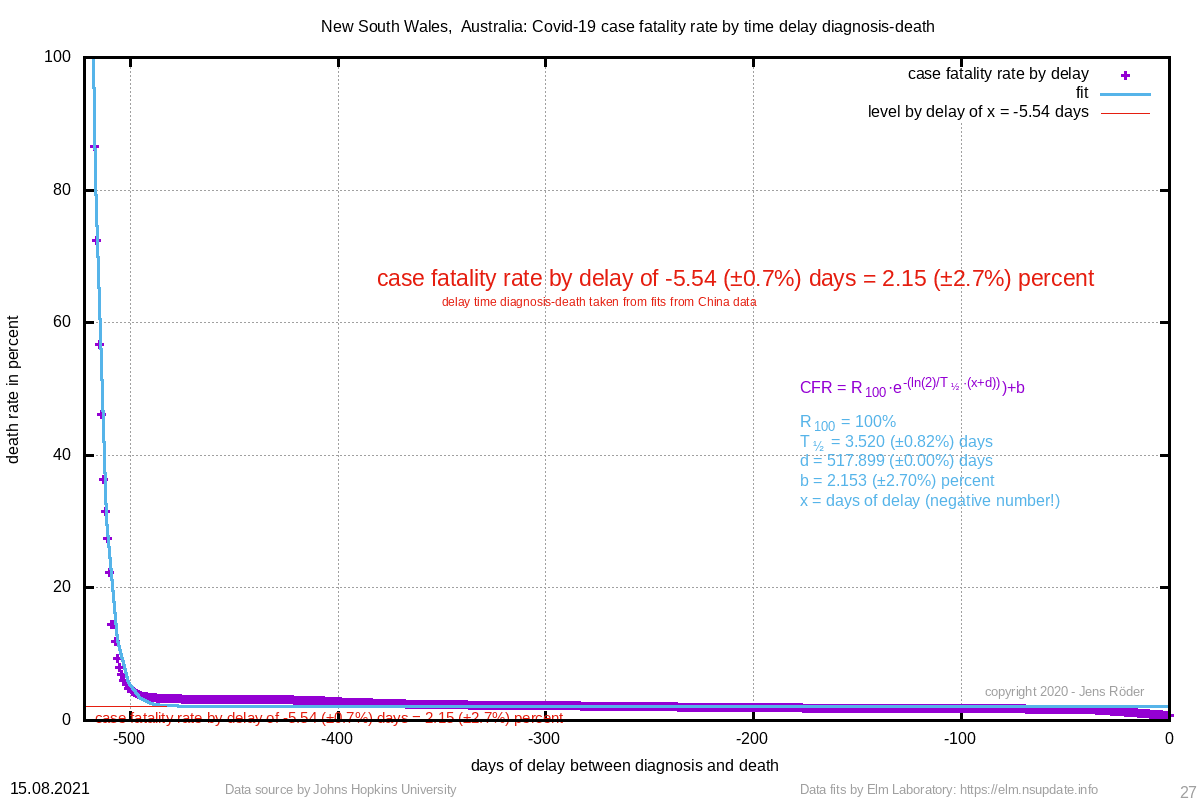 |  | 17.606 (±3.3%) | 100.82 (±1.0%) |
| 95 Saint Lucia | 88 (±0.4%) | 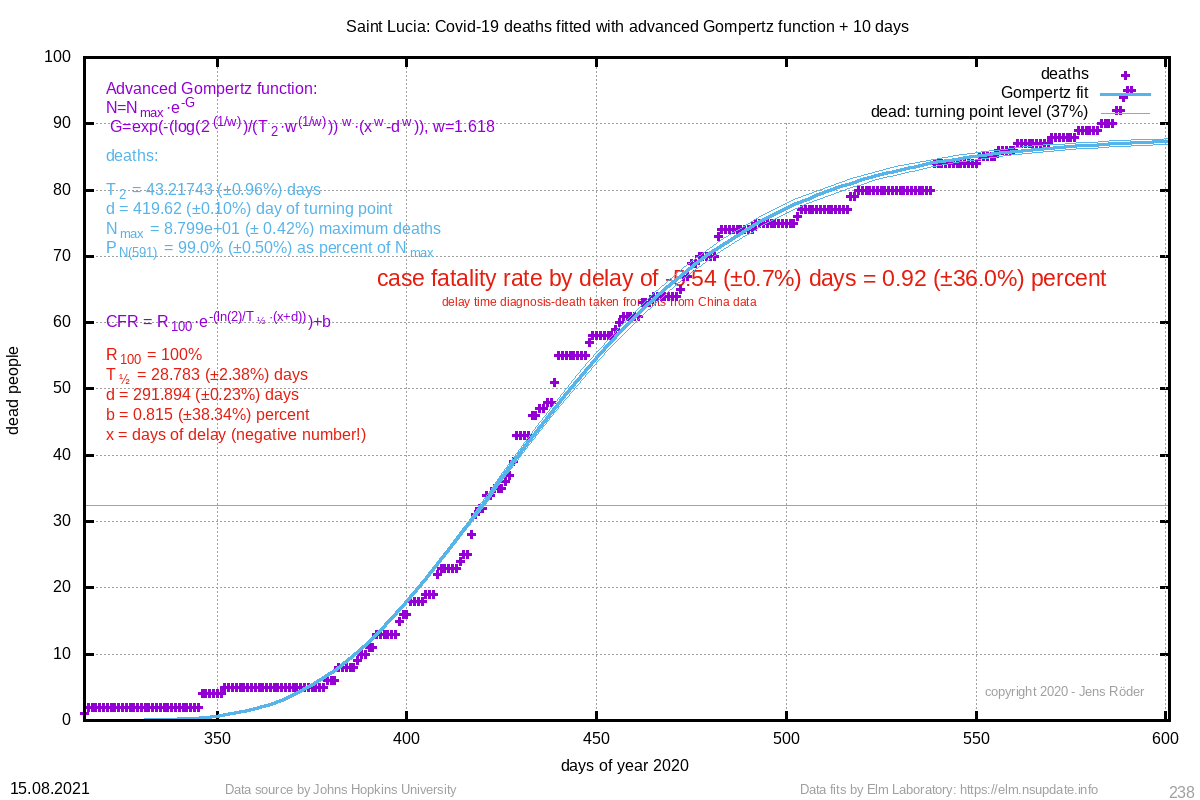 | 0.92 (±36.0%) | 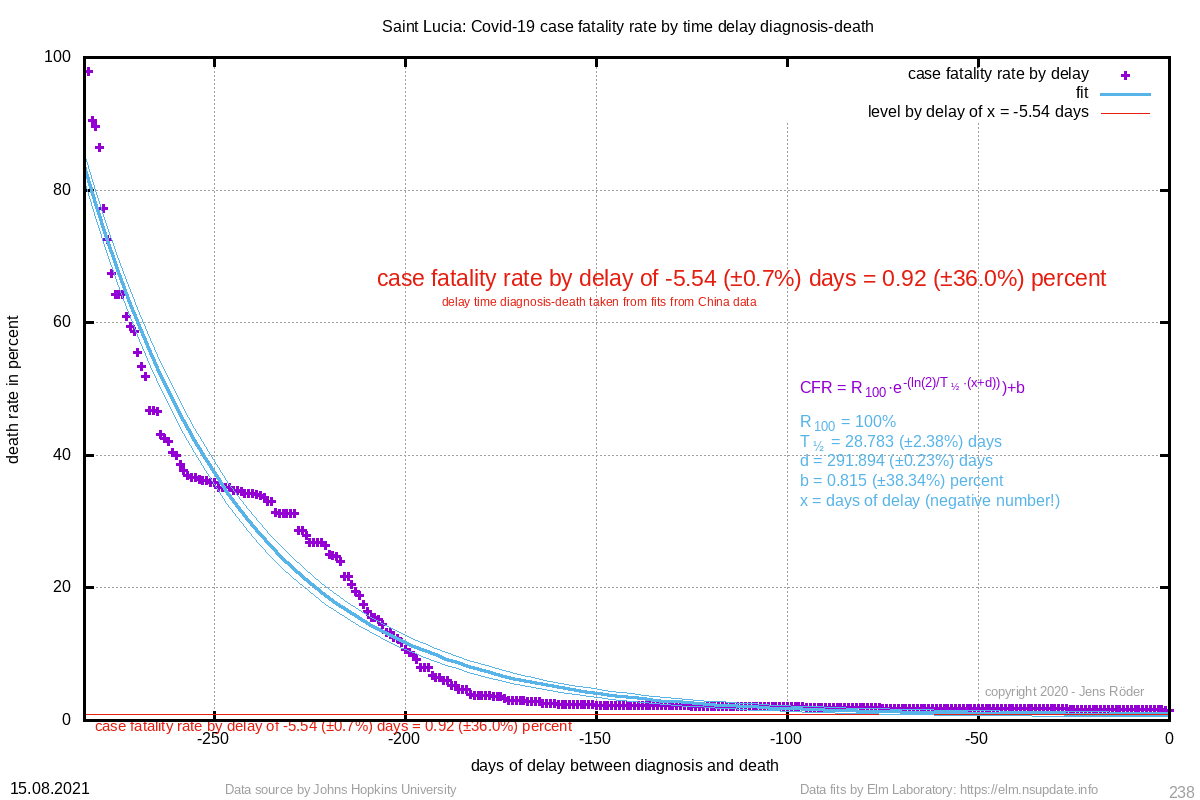 |  | 43.217 (±1.0%) | 419.62 (±0.1%) |
| 93 Nova Scotia, Canada | 70 (±0.7%) |  | 6.22 (±2.0%) |  | 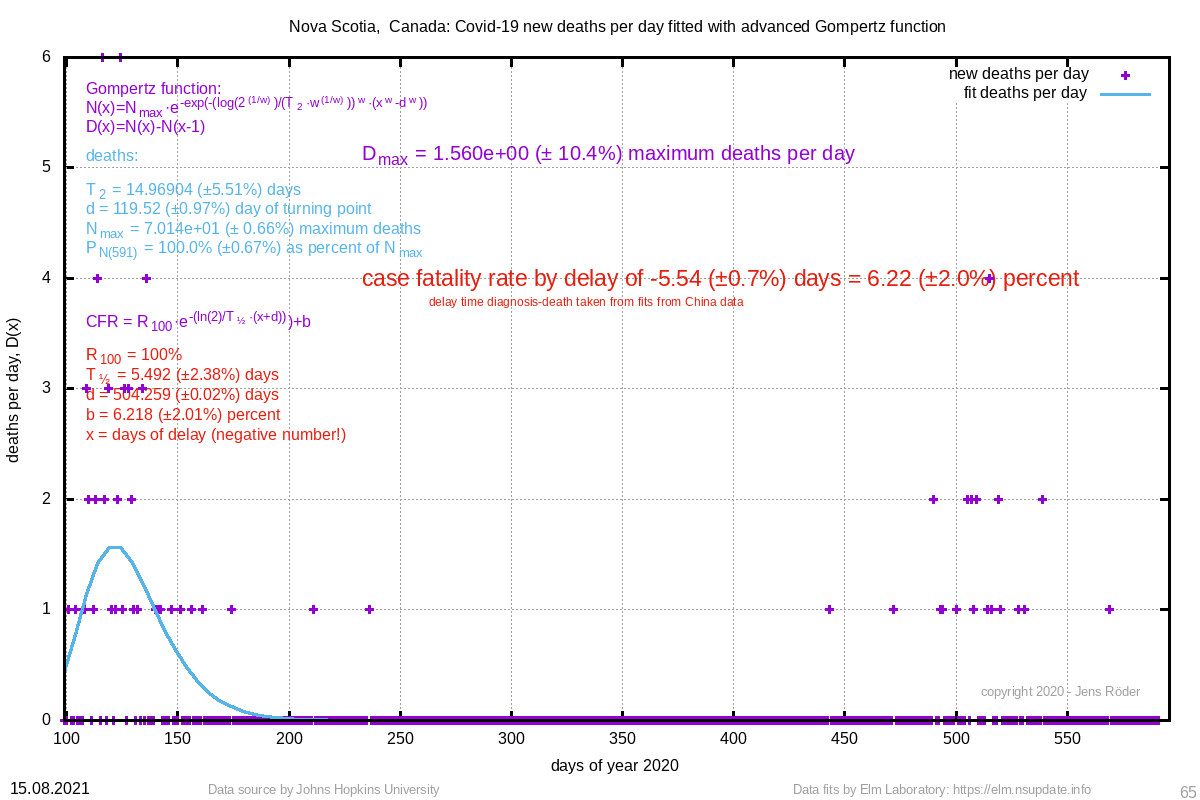 | 14.969 (±5.5%) | 119.52 (±1.0%) |
| 89 Guinea-Bissau | 81 (±2.1%) | 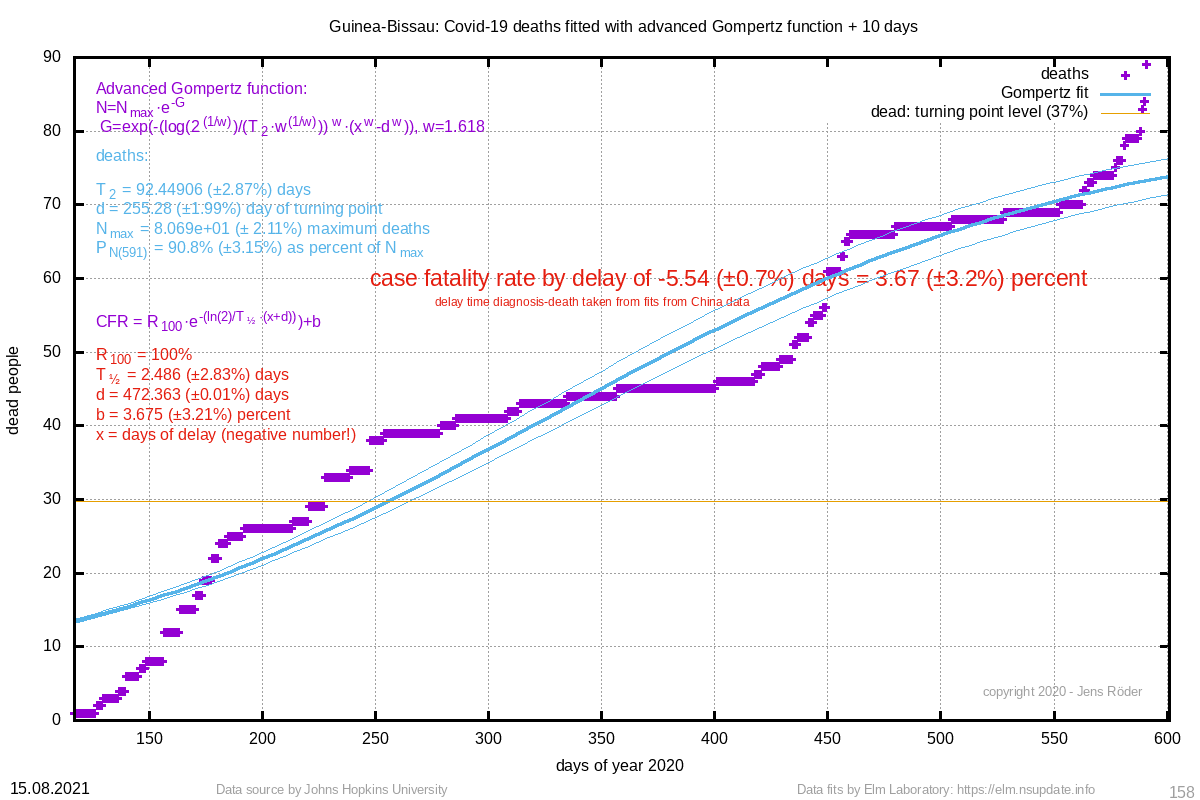 | 3.67 (±3.2%) | 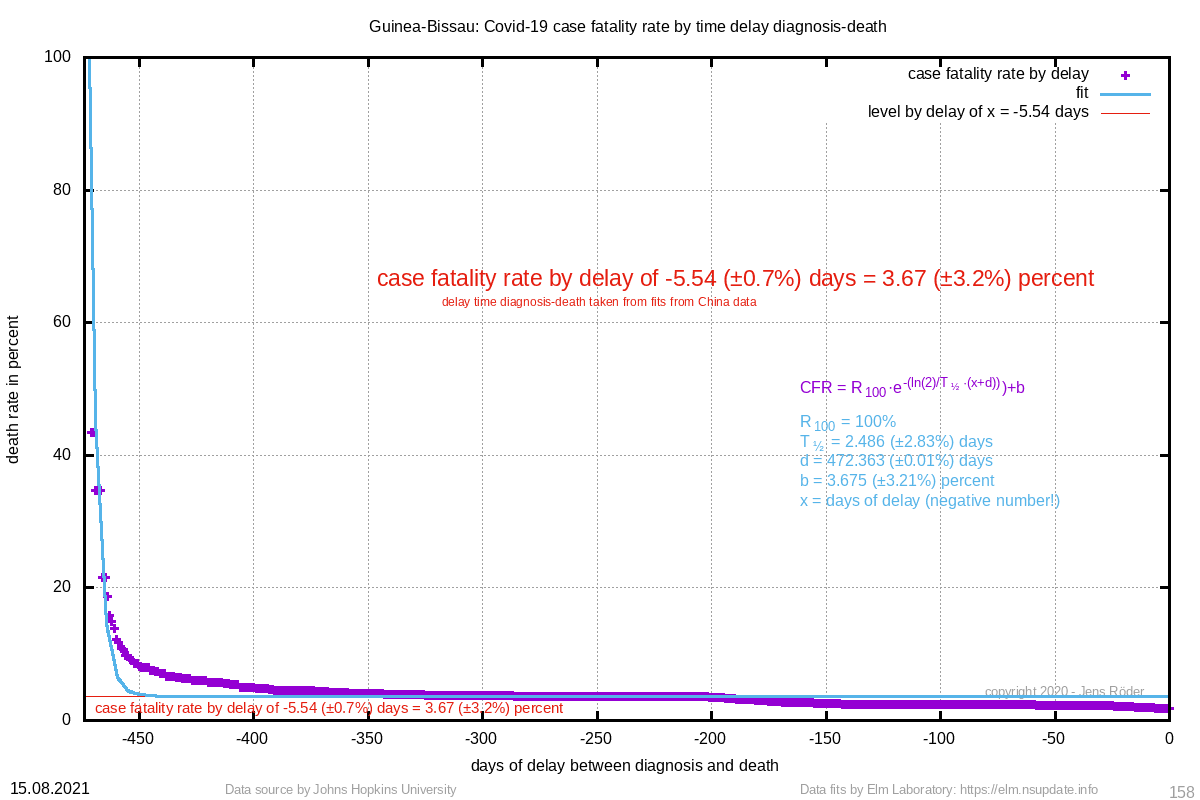 | 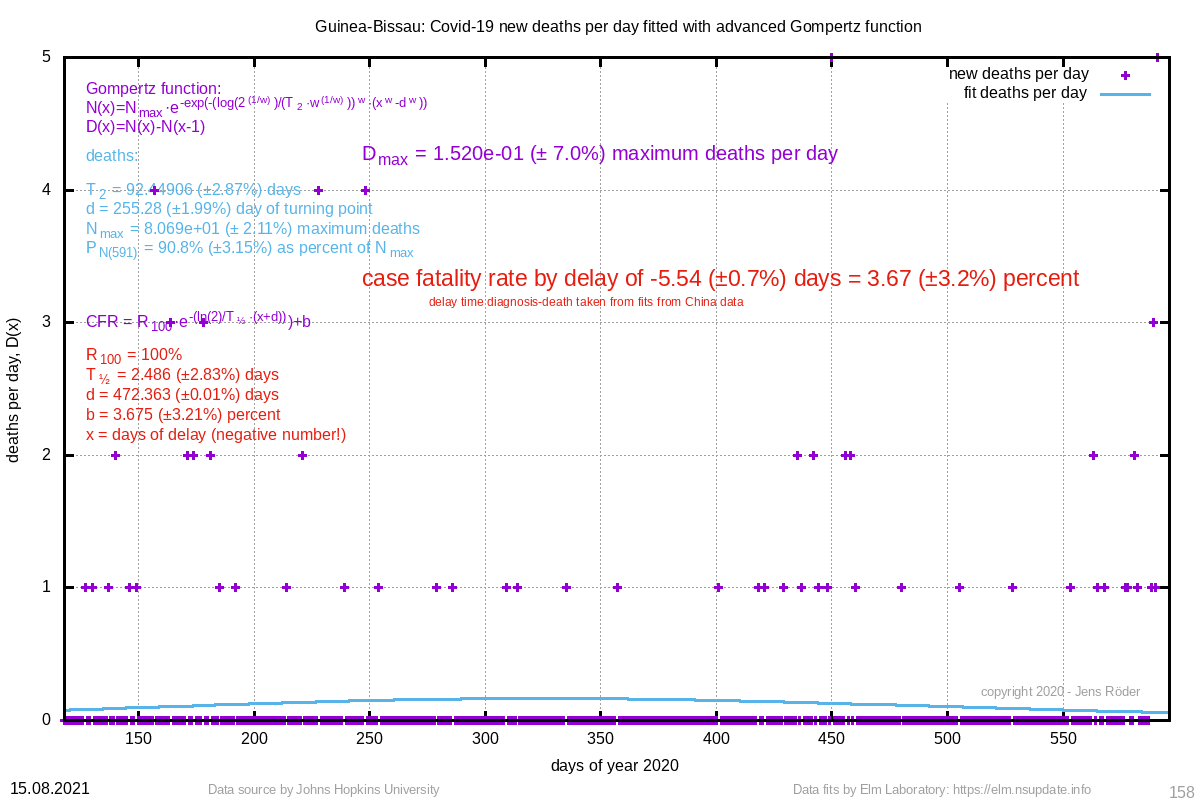 | 92.449 (±2.9%) | 255.28 (±2.0%) |
| 48 Barbados | 18193384 (±1116.0%) | 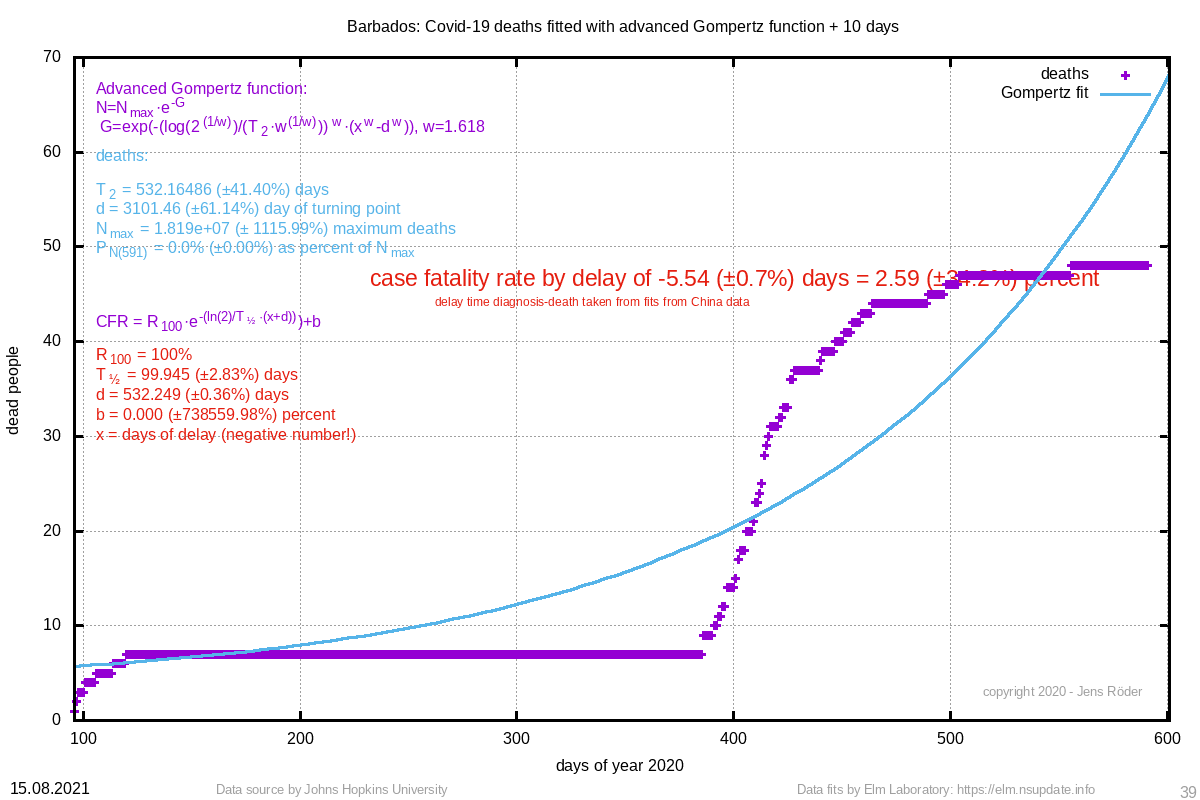 | 2.59 (±34.2%) | 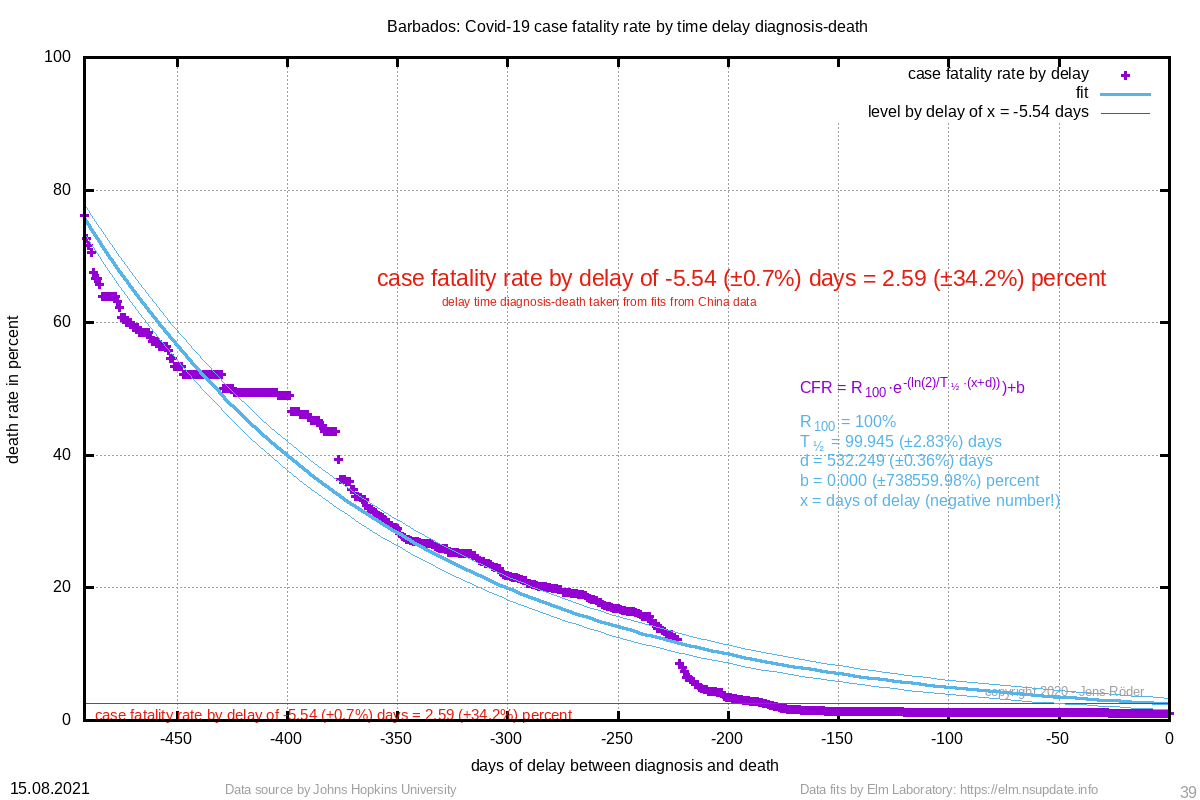 | 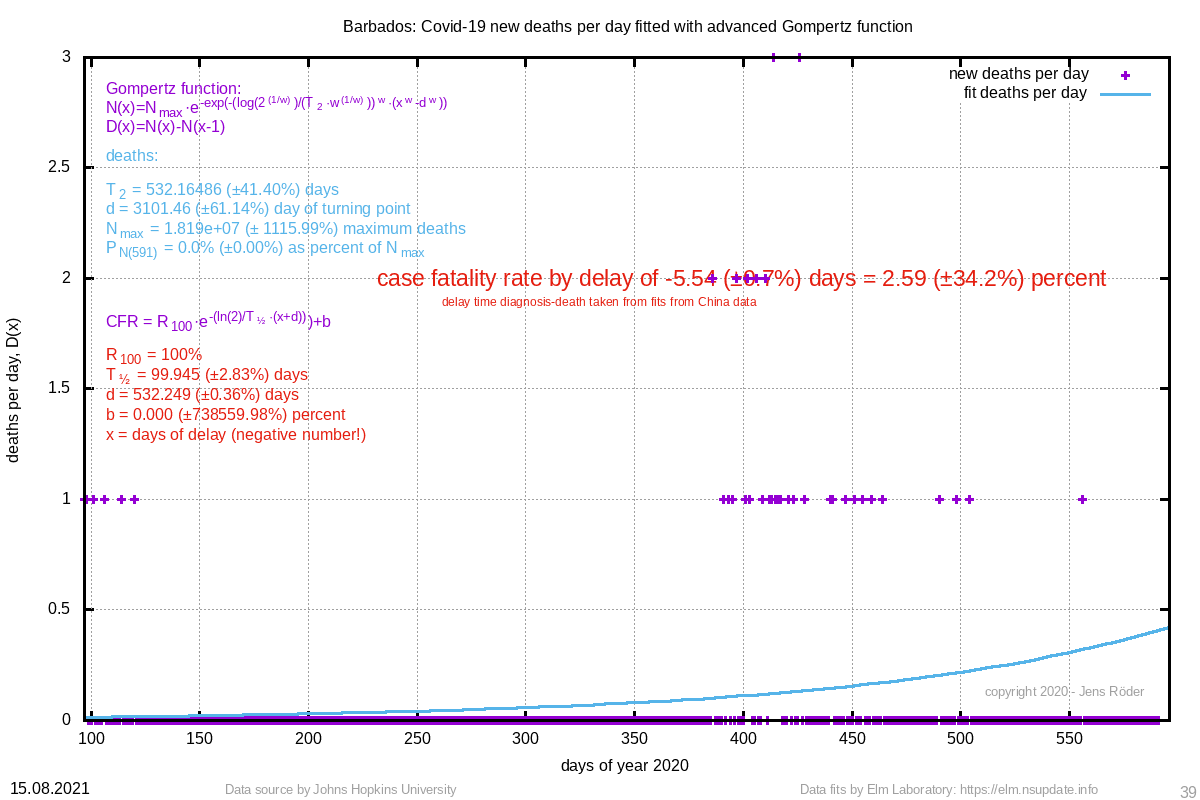 | 532.165 (±41.4%) | 3101.46 (±61.1%) |
| 46 New Brunswick, Canada | 52 (±1.0%) |  | 2.20 (±39.9%) | 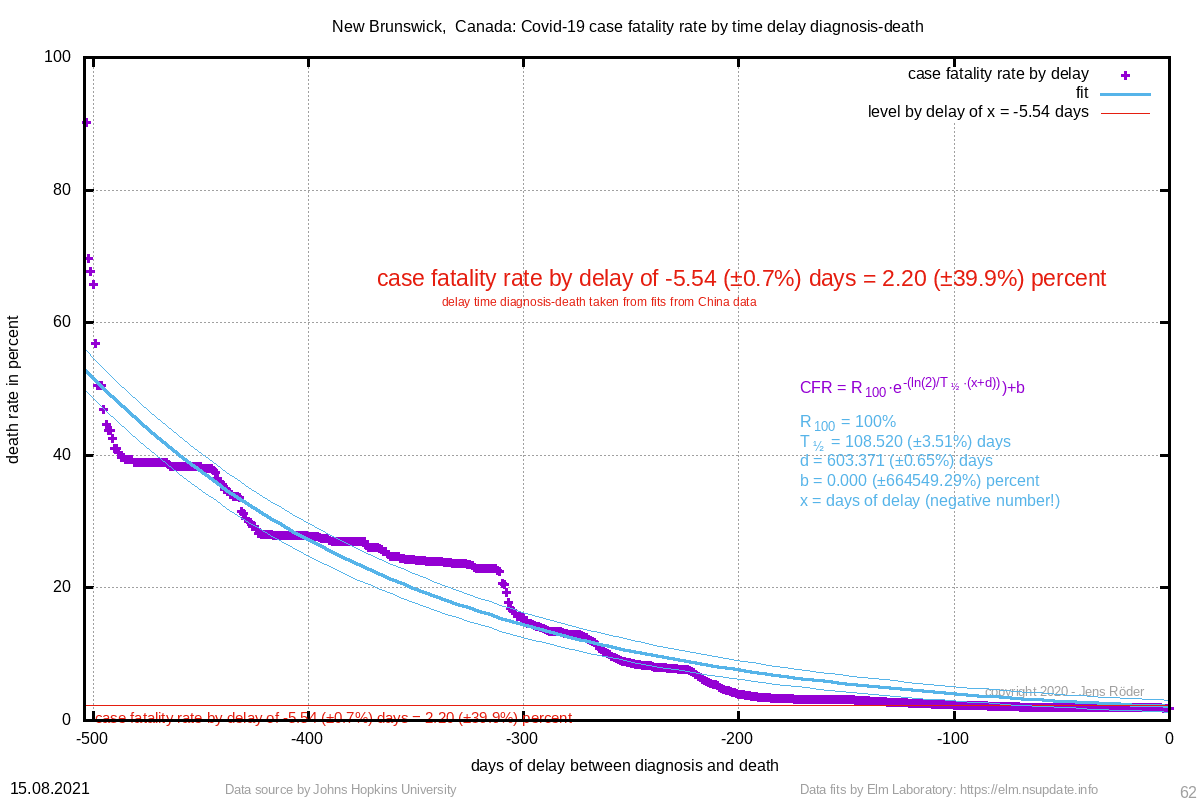 | 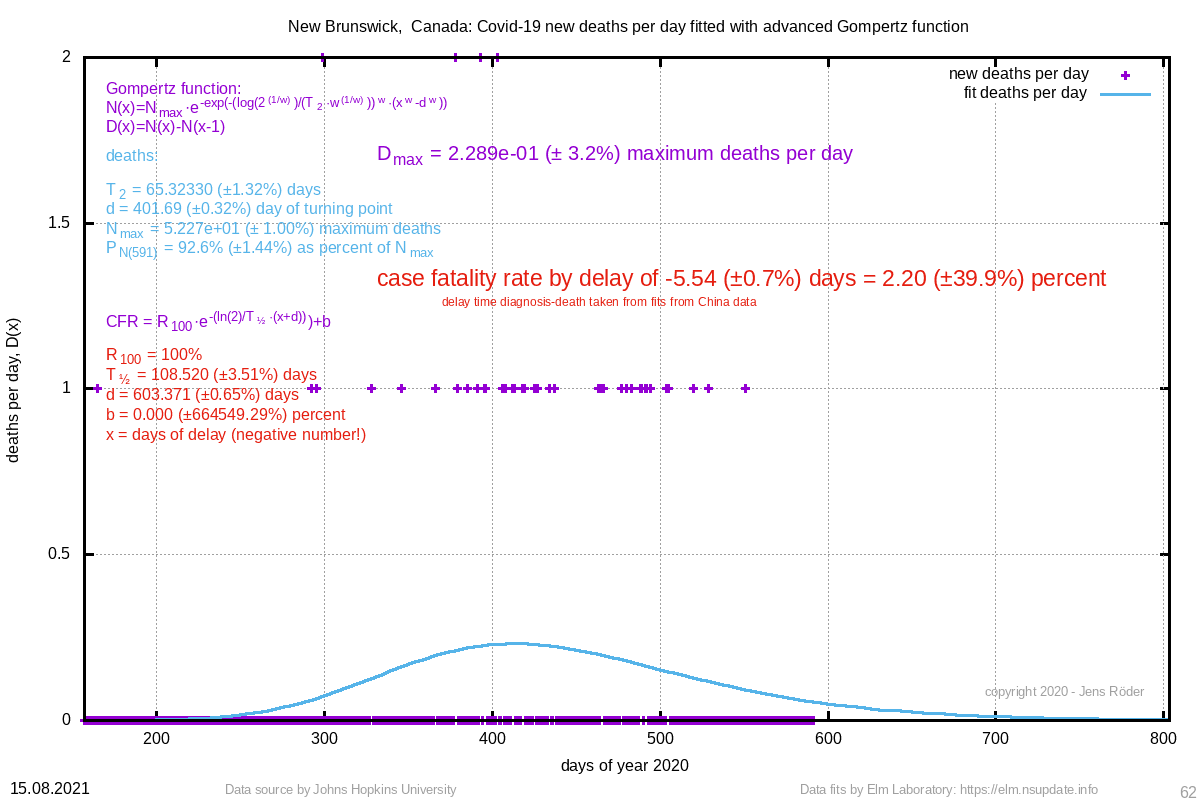 | 65.323 (±1.3%) | 401.69 (±0.3%) |
| 22 Henan, China | 22 (±0.1%) | 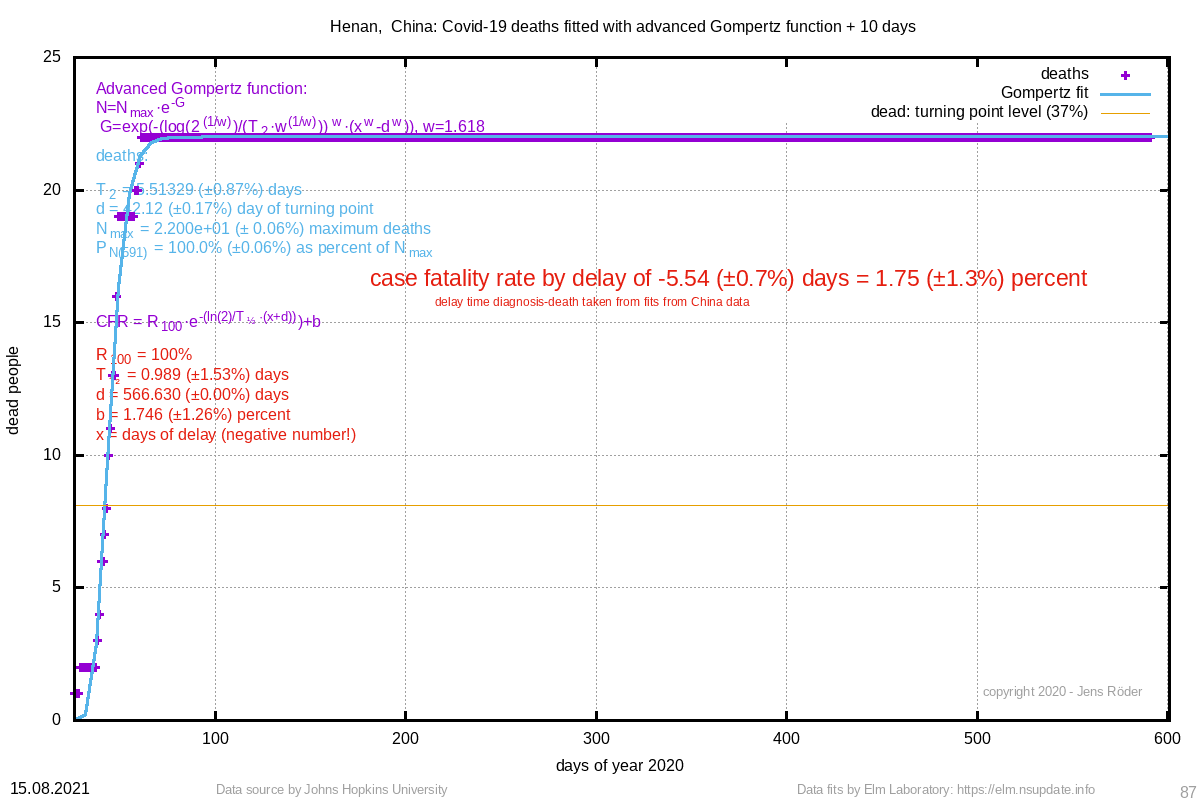 | 1.75 (±1.3%) | 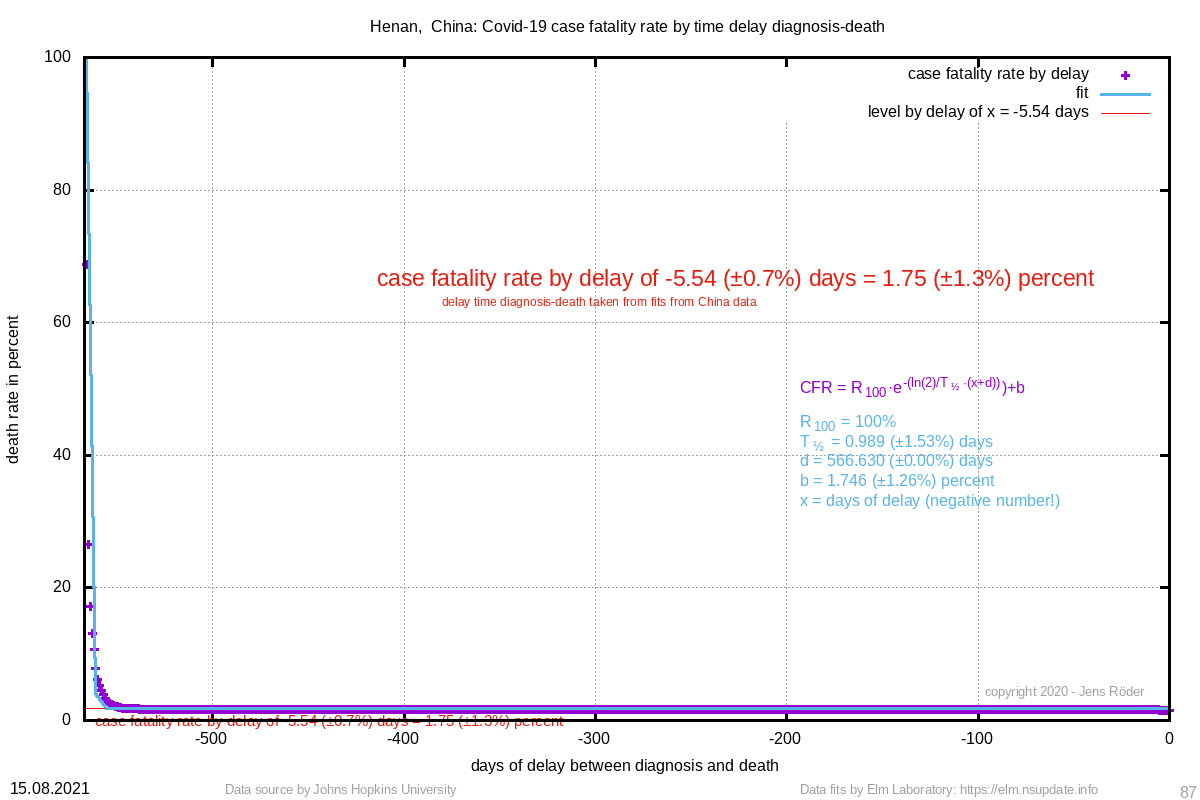 | 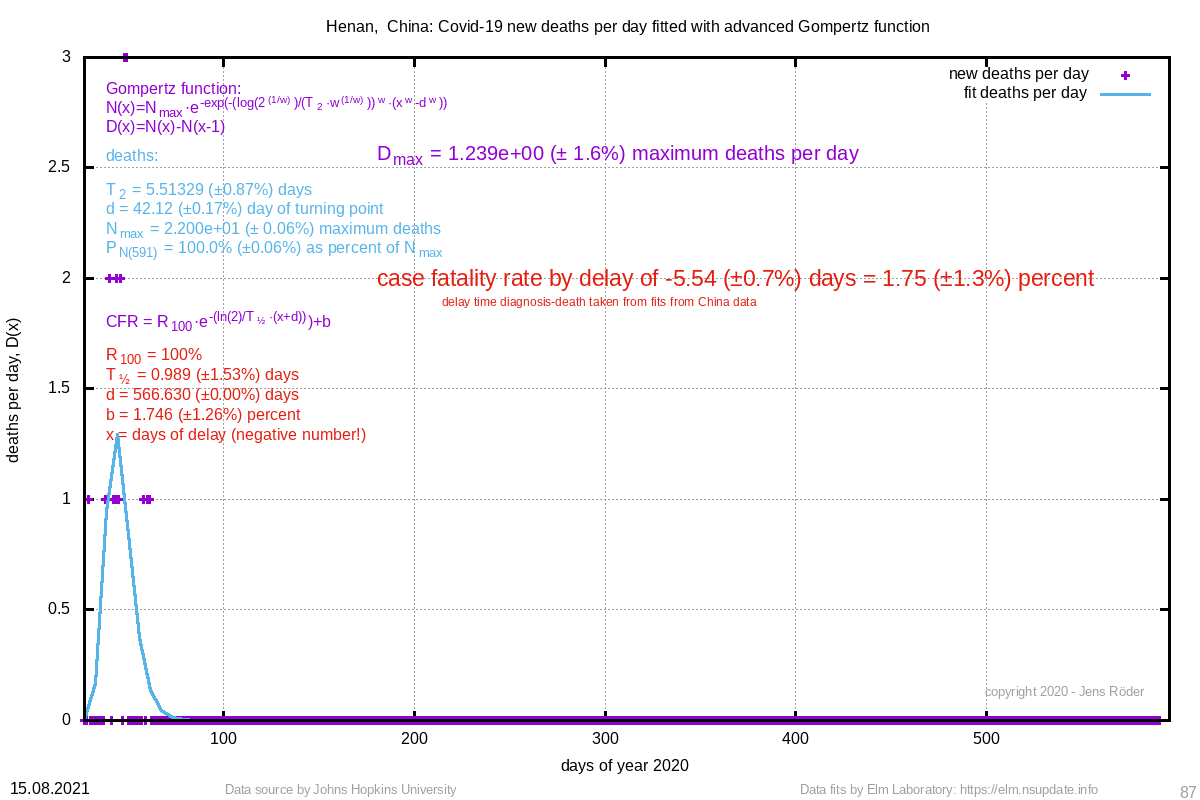 | 5.513 (±0.9%) | 42.12 (±0.2%) |
For countries in this list, the number of dead people must be at minimum 13 people. In the list of numbers of a country, there must be at least 7 different numbers. The turning point is guessed by using half the maximum number and then looks for the first value above that value. If the turning point is at the last value, the fit is omitted.
Locations or countries with not enough data points or other reasons are skipped and can be found in this list.