
COVID-19 Regional Numbers of Infected People
fit with advanced Gompertz function
with Advanced Gompertz Function
All the fits of the data of individual areas are created fully automatically. You may check on the graph (click on the image) if the fit has a sufficient quality, matching the data points as best as possible. There may be some cases, where by too unexpected real data, the fit is not giving a good forecast. So please use common sense to evaluate the data.
Locations or countries with not enough data points or other reasons are skipped and can be found in this list.
The table shows from the left: The maximum last cumulative number, the expected maximum number by fit, graph and location, the T2 also known as doubling time of the exponential growth, the day of turning point of the function.
The turning point is important, showing the turn from purely exponential growth to the process of fading out by limited number of victims.
In the middle of the graph is written the doubling time, that describes the time it needs to double the number of cases. This number is calculated using the logistic function and describes the growth before the turning point, where numbers rise quickly. In a simple picture, the T2 of the Gompertz function describes the later part and the doubling time of the logisitic the first part.
Color code on numbers of infected people: Below 500 , between 500 and 999, between 1000 and 9999, between 10000 and 49999, between 50000 and 99999, above 100000.
The color code on locations describes percentages of last number and expected Nmax: Above 95%, between 90% and 95%, between 80% and 89%, between 70% and 79%, between 60% and 69%, when number of cases is above 50 and Nmax is below 50% or the doubling time is below 3.5 days! Above 130%, a reoccurrence of an outbreak is indicated.
The color code on turning, that is: More than 20 days passed, more than 10 days passed, more than 5 days passed, ahead 5 days, ahead 10 days, more than 10 days ahead.
The location color code tells you, how well the Covid-19 outbreak has faded out and is under control (greenish). In red and magenta the areas are on fast rise in numbers. The color code in numbers tells you how severe the outbreak was in that region.
Applied maths is explained here.
If you like to support my work:
 (by click on image you accept third party cookies, required by paypal)
For old broad desktop overview, follow this link.
Actualisation date: Sun Aug 15 04:23:03 UTC 2021
Clicking on the name will direct to a page with all images for the country.
| Ncurrent location |
Nmax (err) | cumulative_inf. | infected_daily | T2 (err) | dturning_point (err) |
| 20319000 Brazil | 28887412 (±1.6%) | 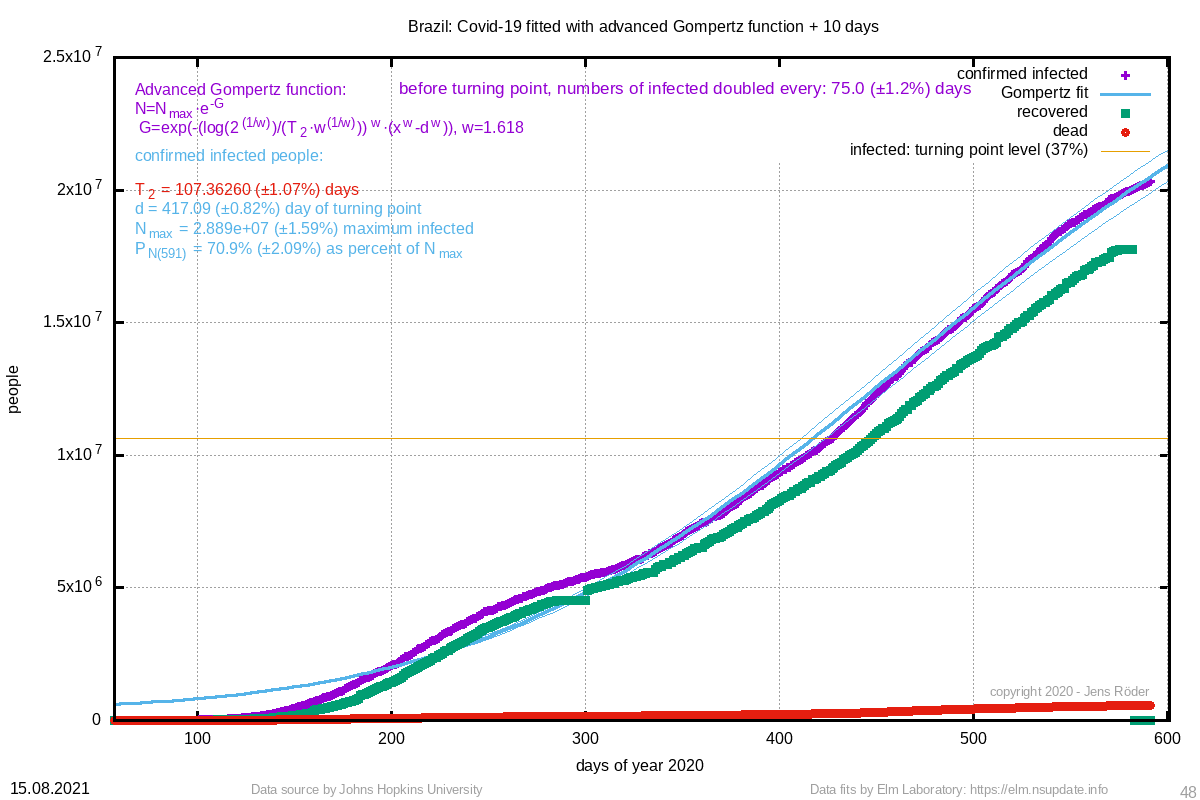 |  | 107.363 (±1.1%) | 417.09 (±0.8%) |
| 5074725 Argentina | 10201882 (±4.5%) |  | 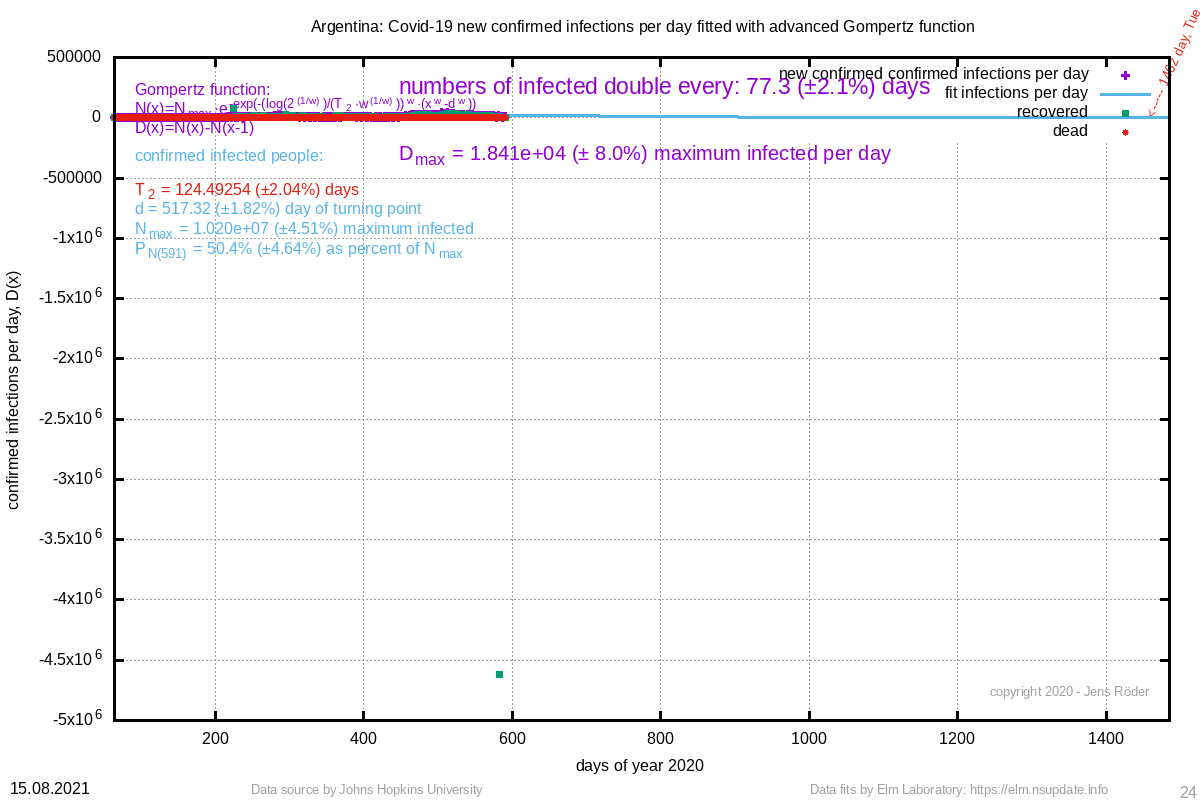 | 124.493 (±2.0%) | 517.32 (±1.8%) |
| 1405333 Bangladesh | 2579068 (±11.1%) |  | 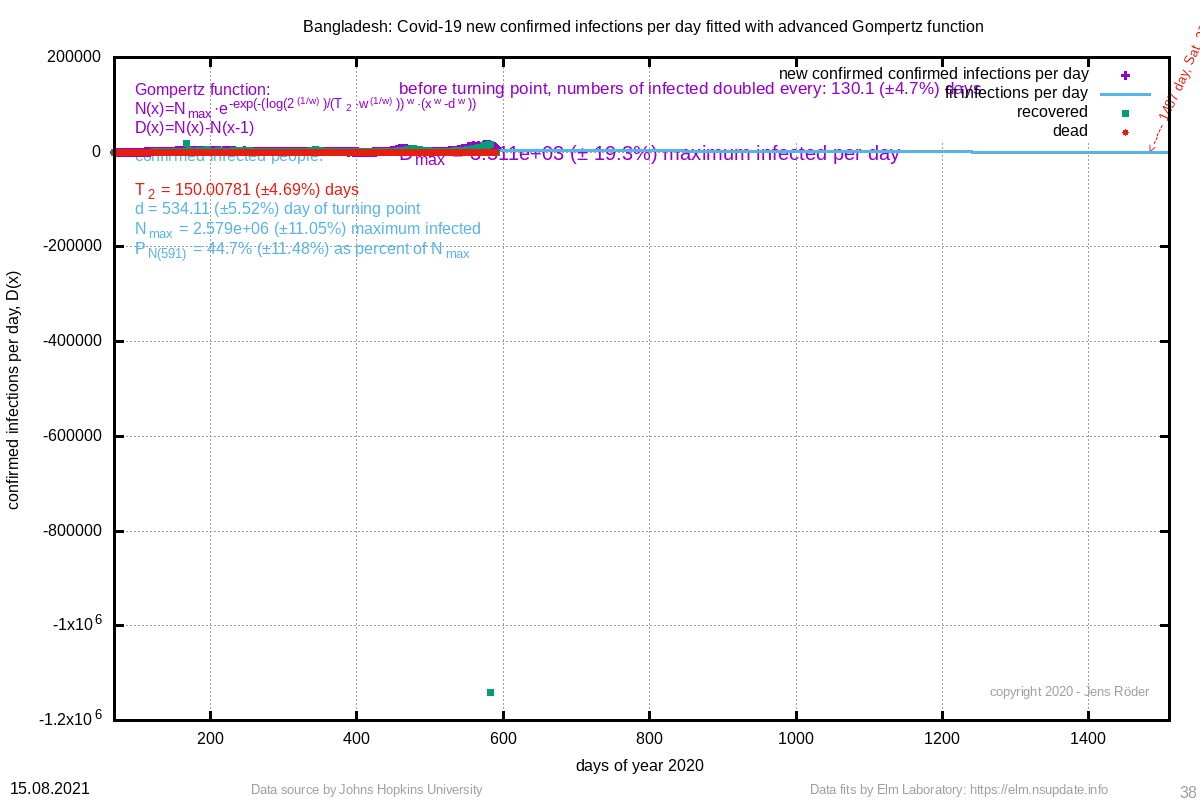 | 150.008 (±4.7%) | 534.11 (±5.5%) |
| 493767 Ecuador | 655060 (±1.3%) | 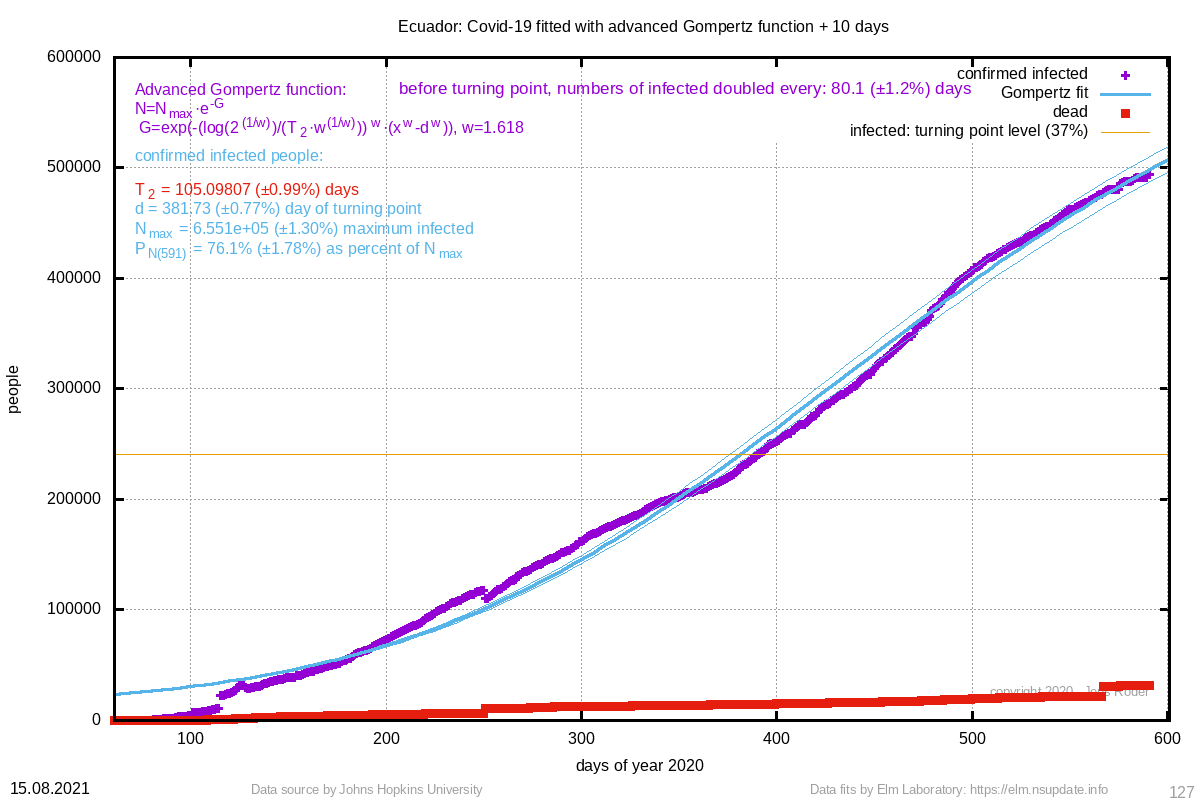 | 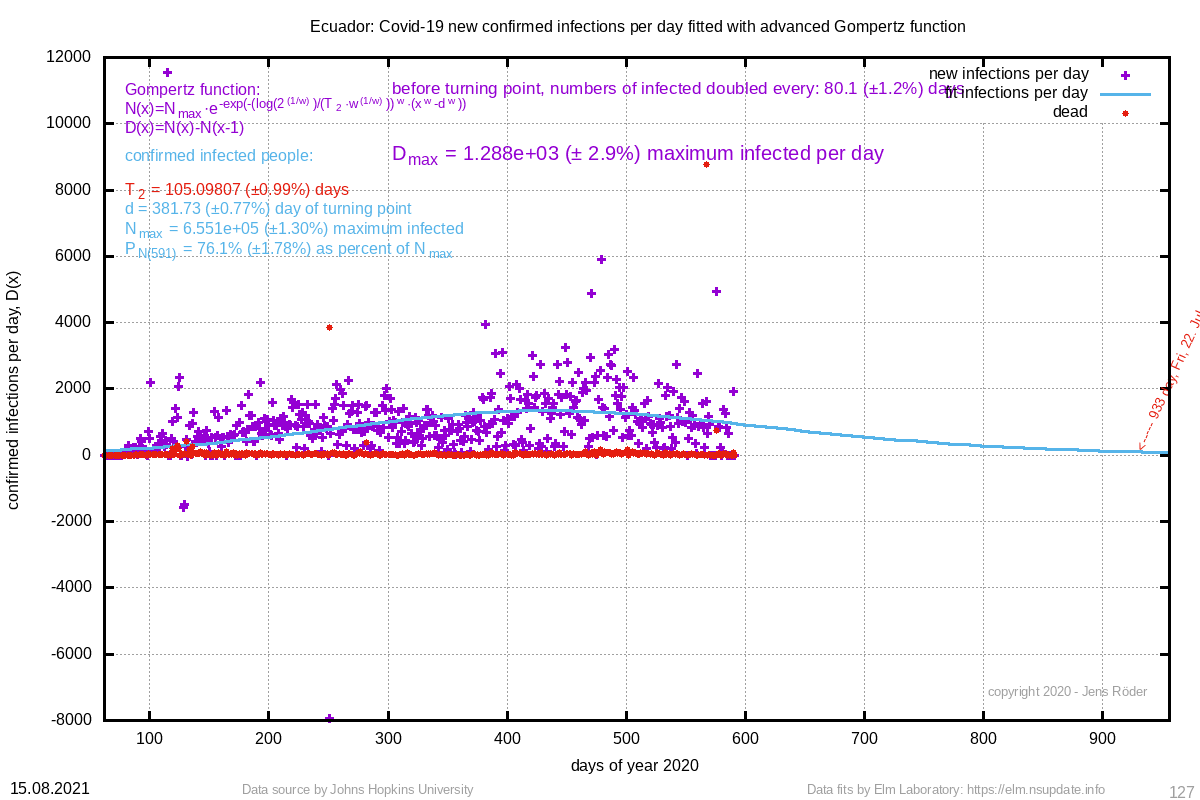 | 105.098 (±1.0%) | 381.73 (±0.8%) |
| 481631 Bolivia | 887876 (±4.9%) | 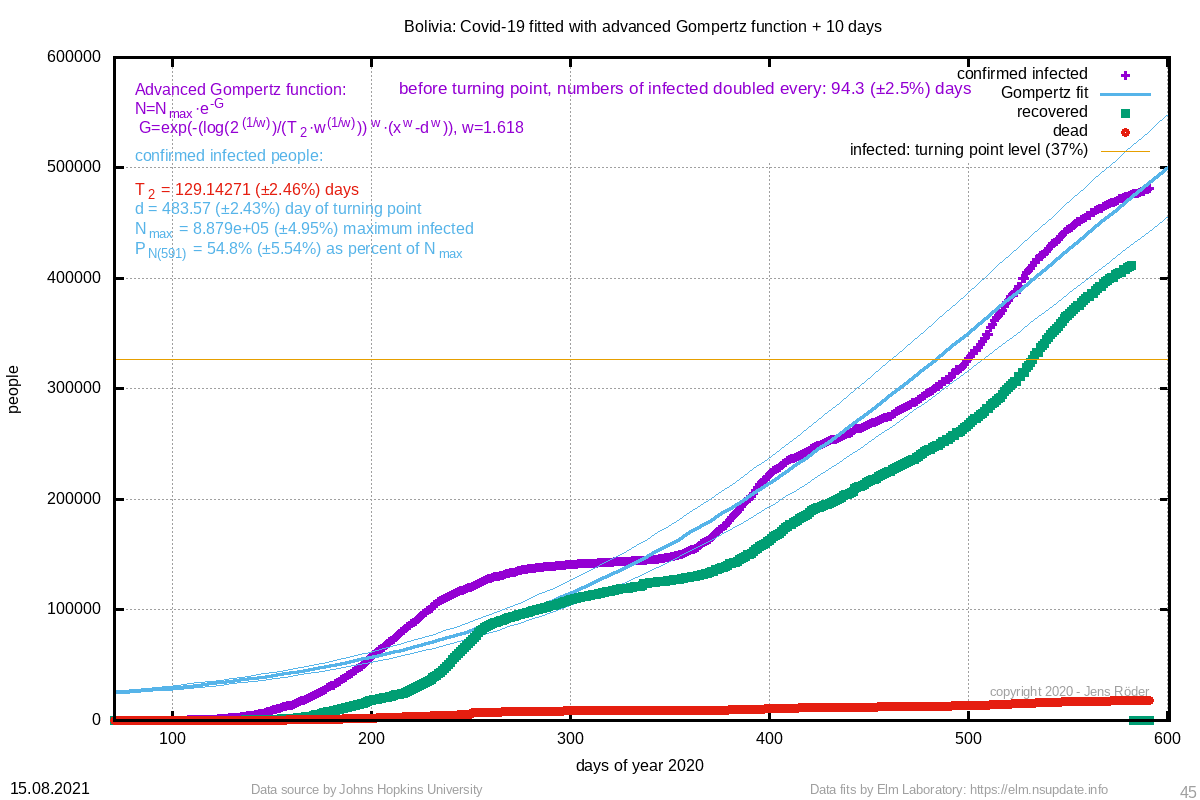 | 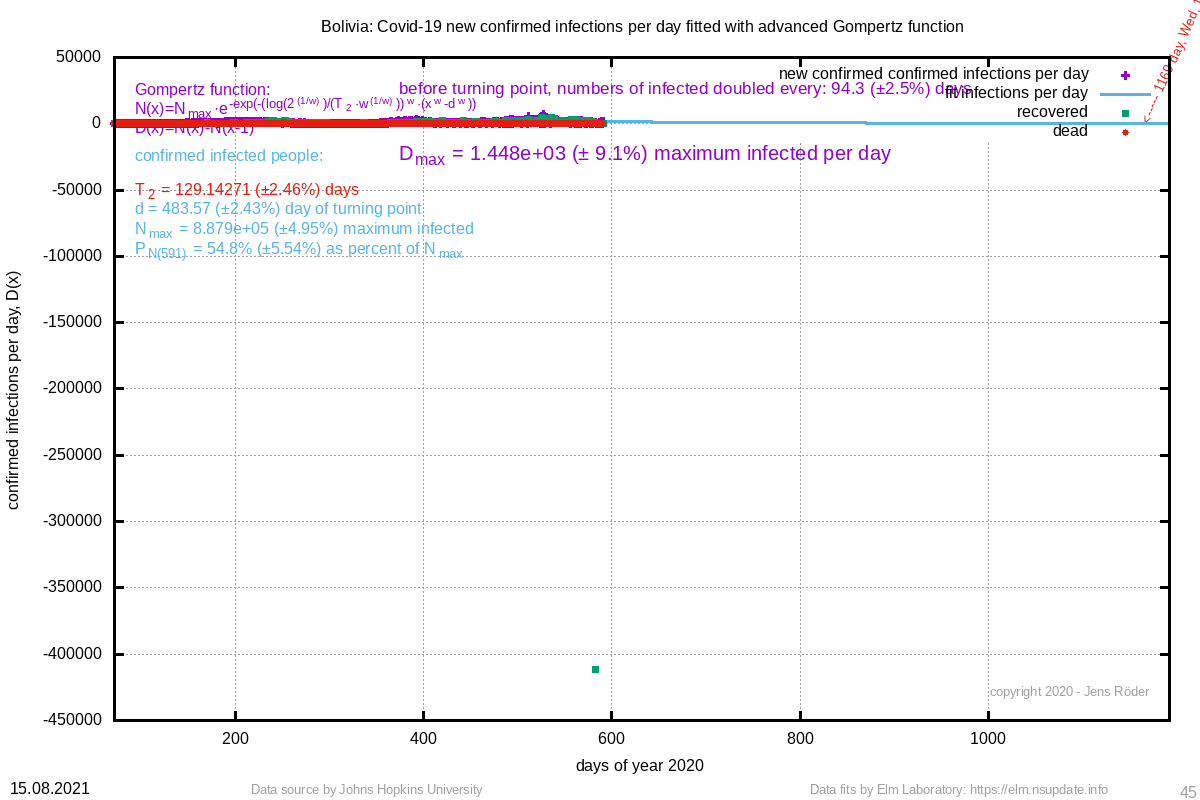 | 129.143 (±2.5%) | 483.57 (±2.4%) |
| 458847 Belarus | 565973 (±1.2%) | 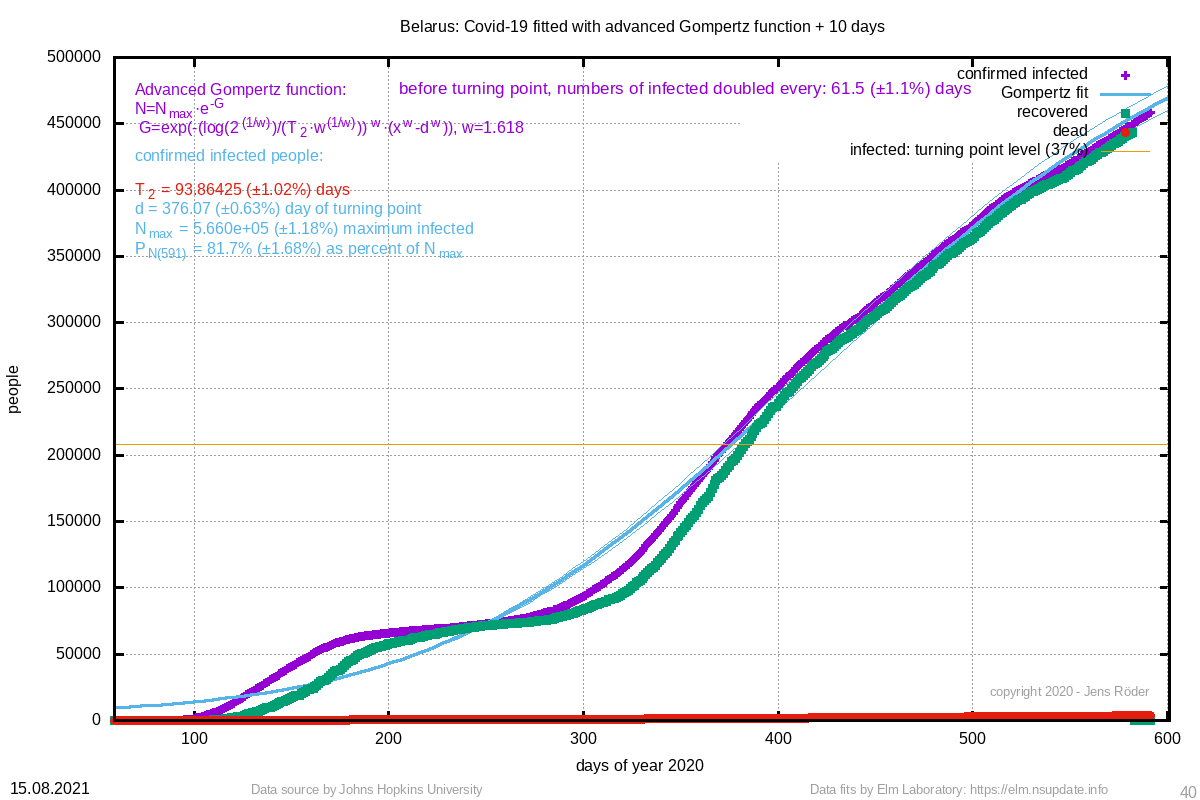 | 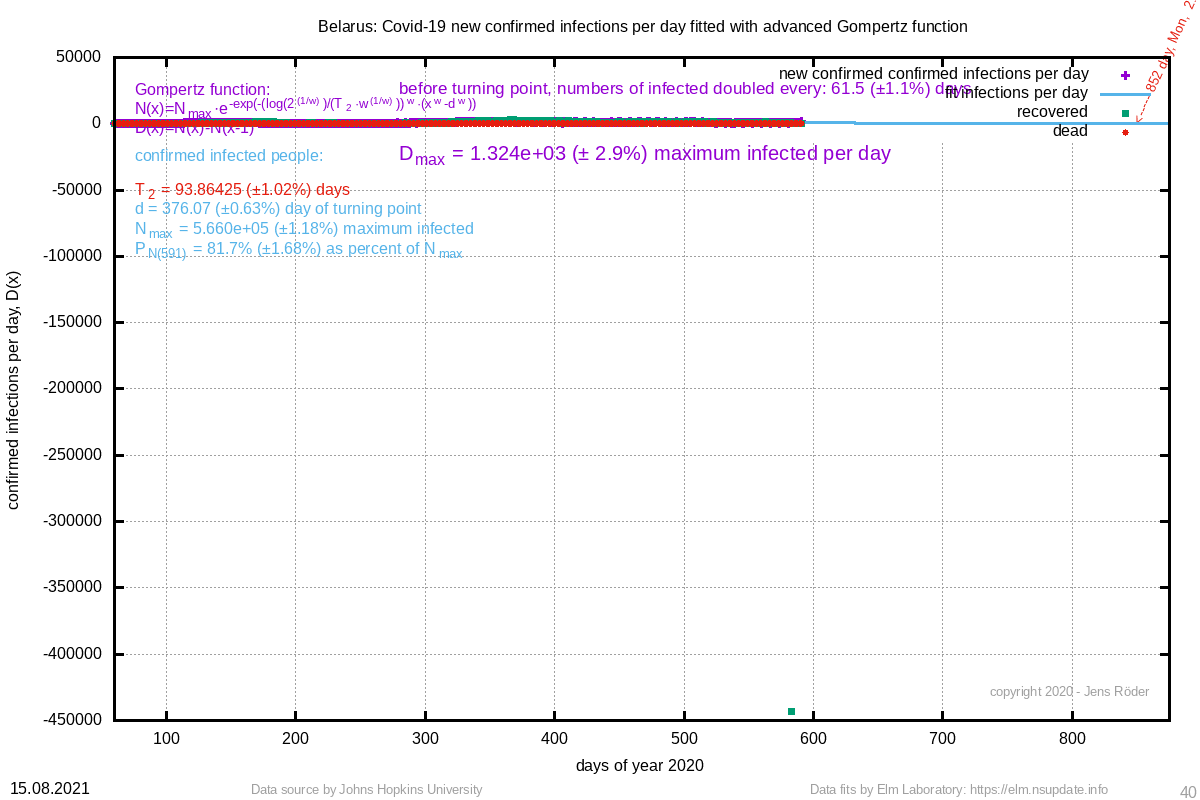 | 93.864 (±1.0%) | 376.07 (±0.6%) |
| 345637 Dominican Republic | 373710 (±0.9%) | 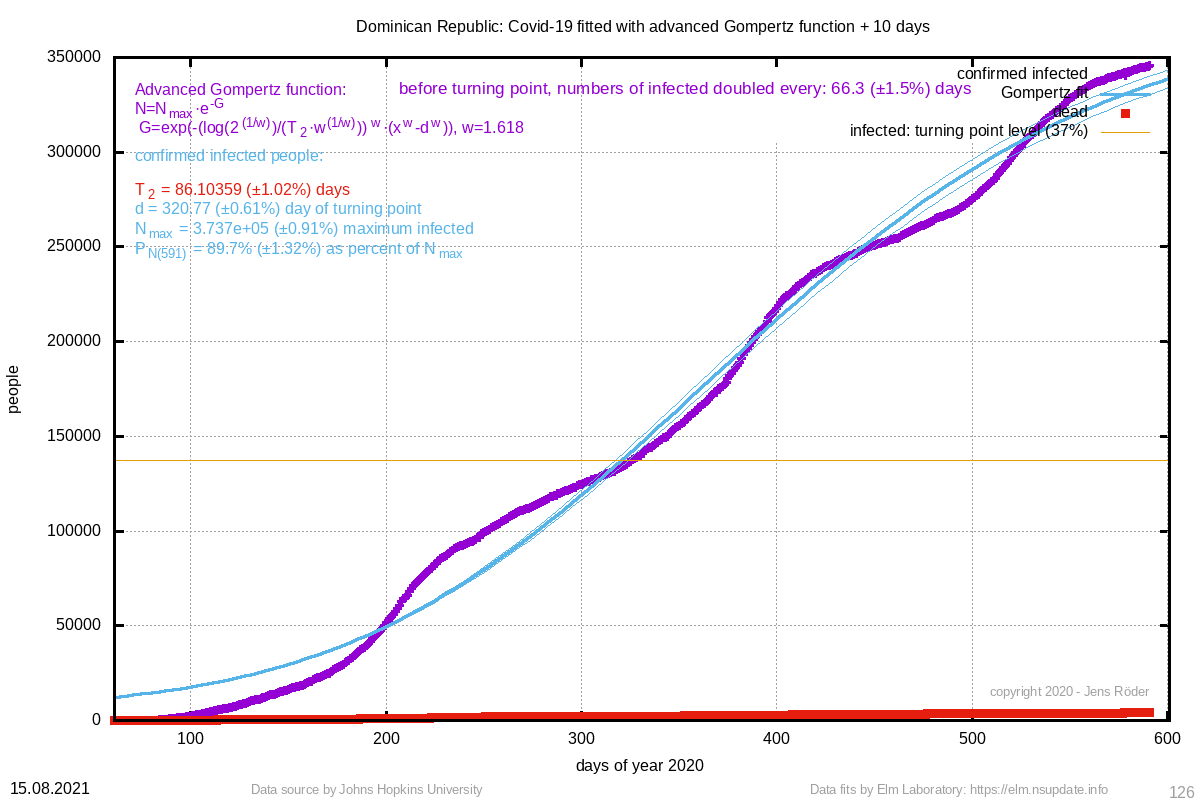 | 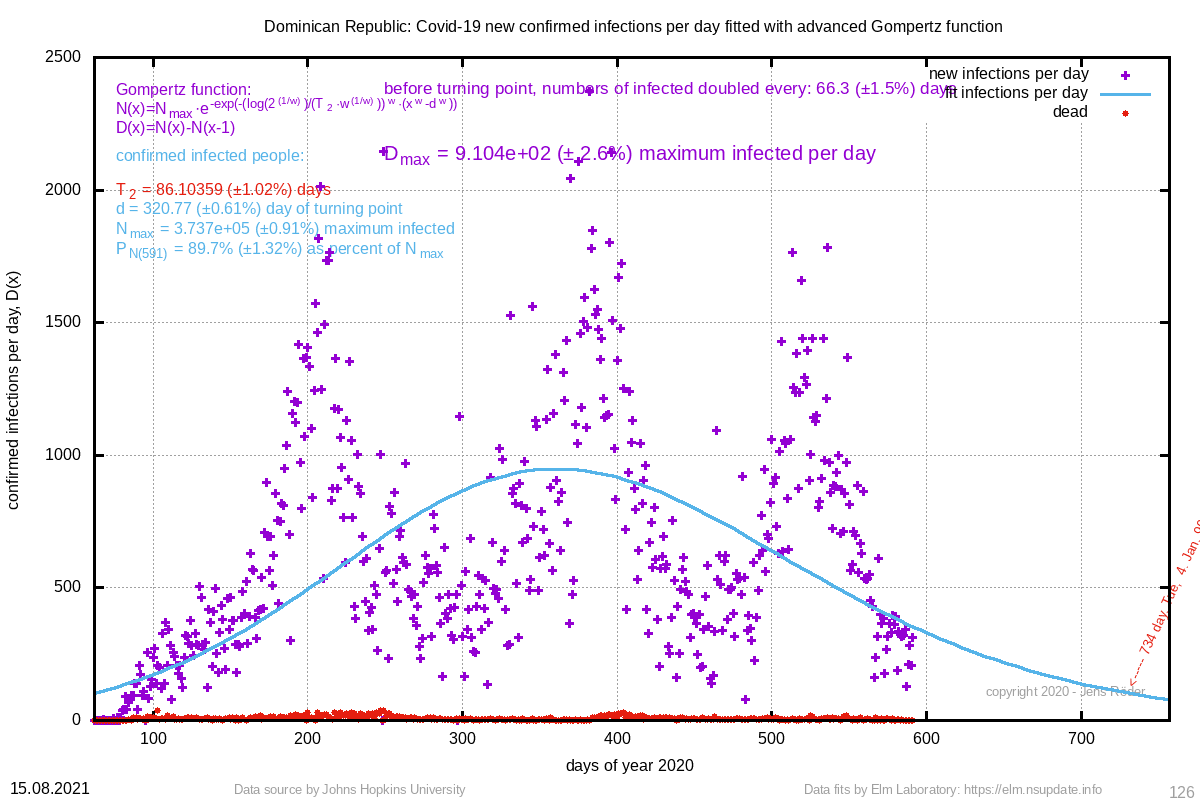 | 86.104 (±1.0%) | 320.77 (±0.6%) |
| 270692 Bahrain | 701845 (±7.3%) | 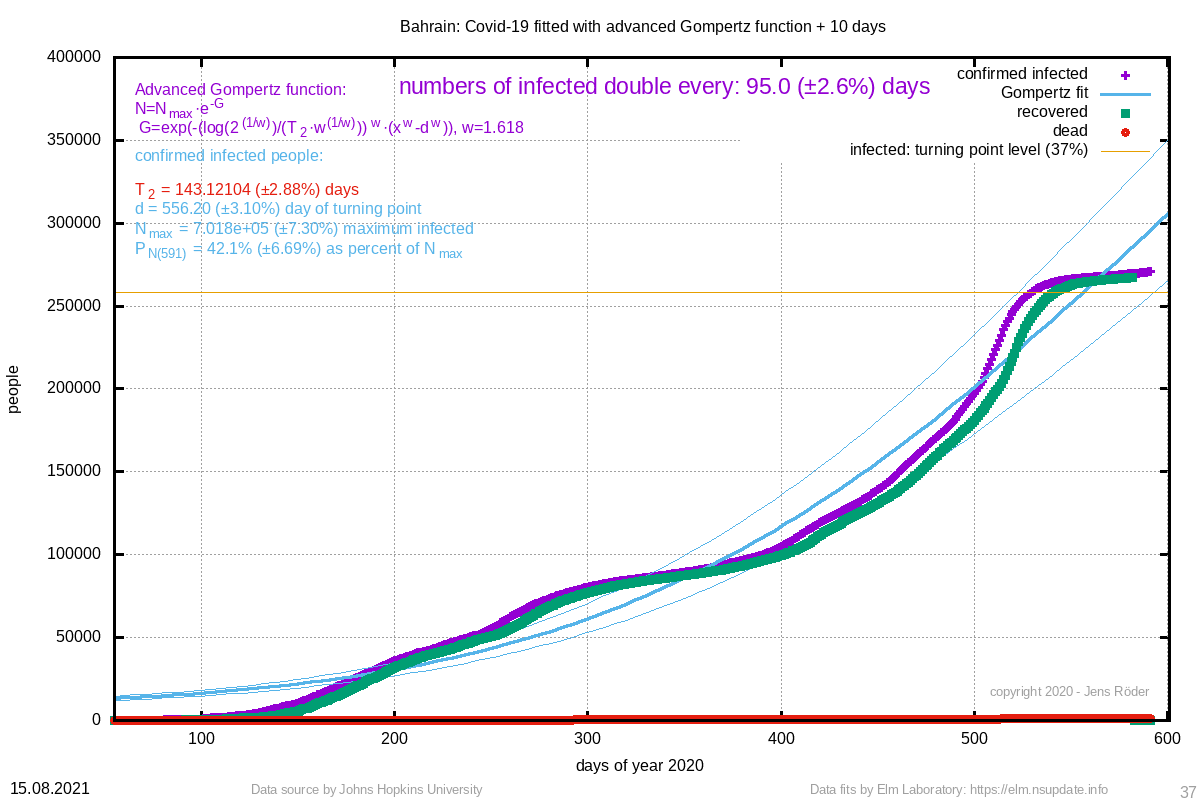 | 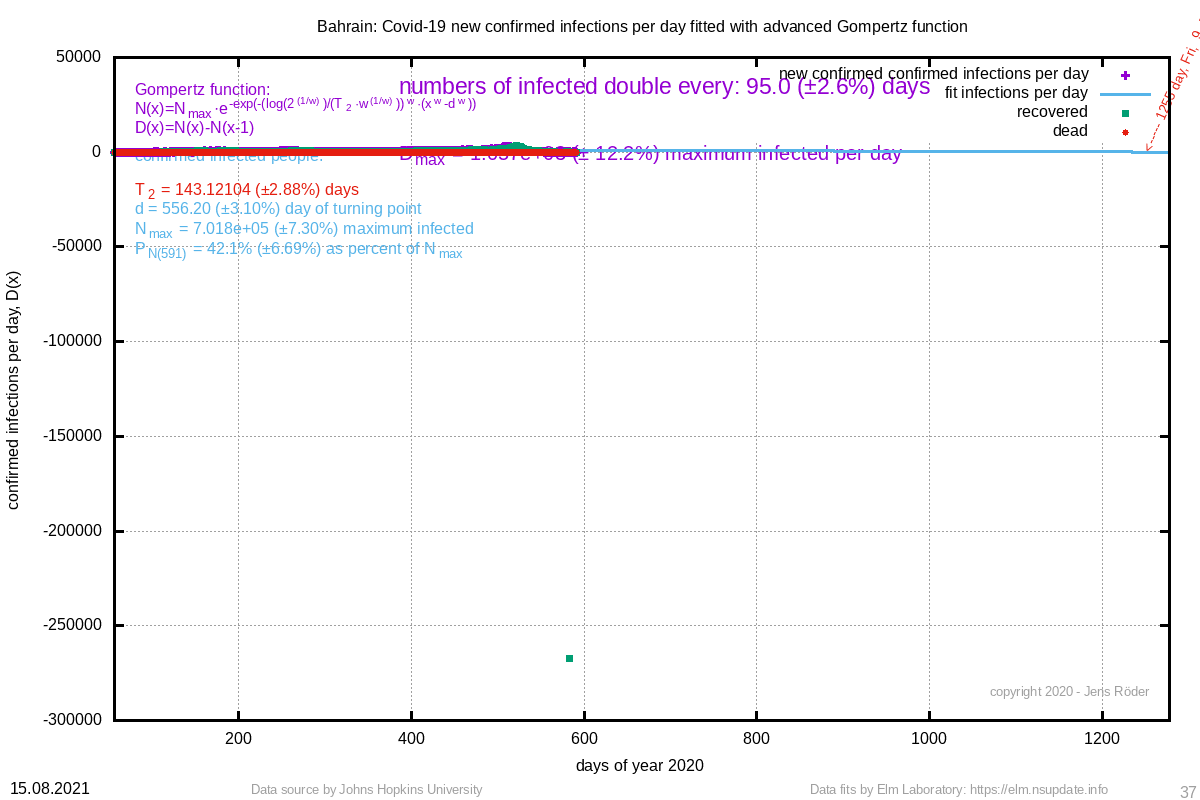 | 143.121 (±2.9%) | 556.20 (±3.1%) |
| 233797 Armenia | 236640 (±0.6%) | 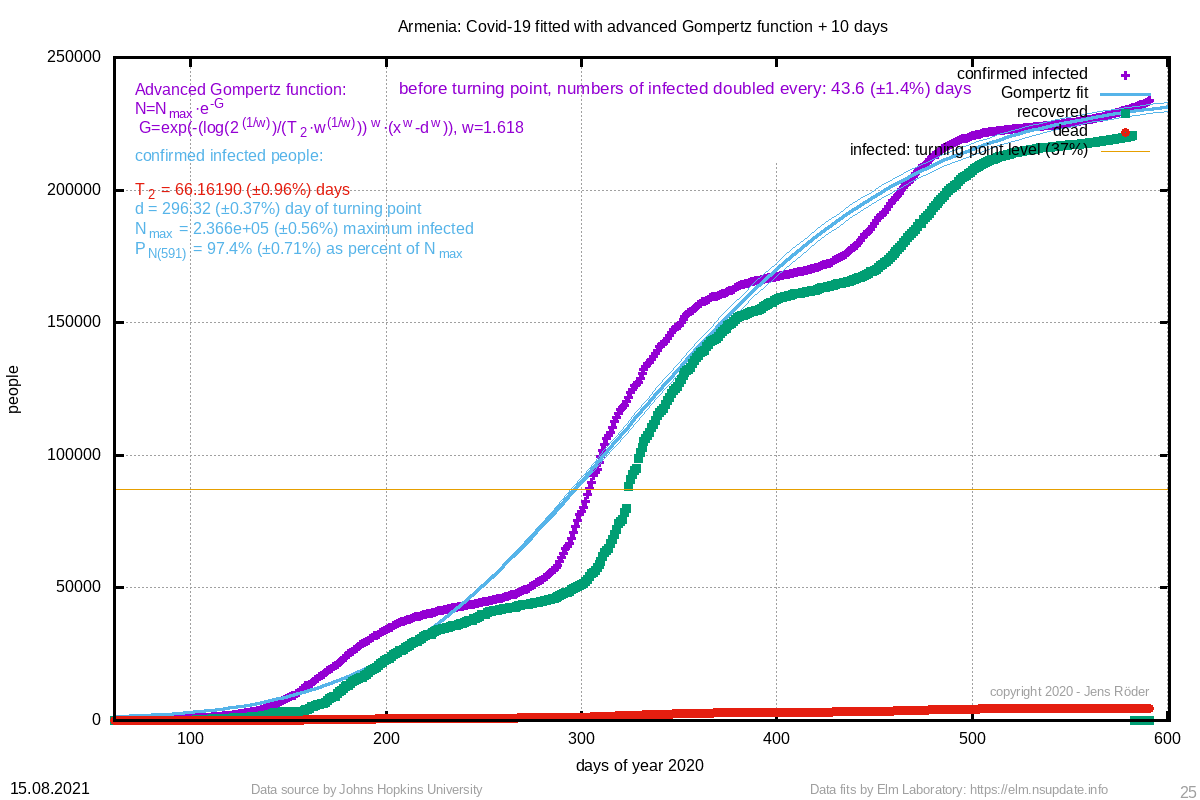 | 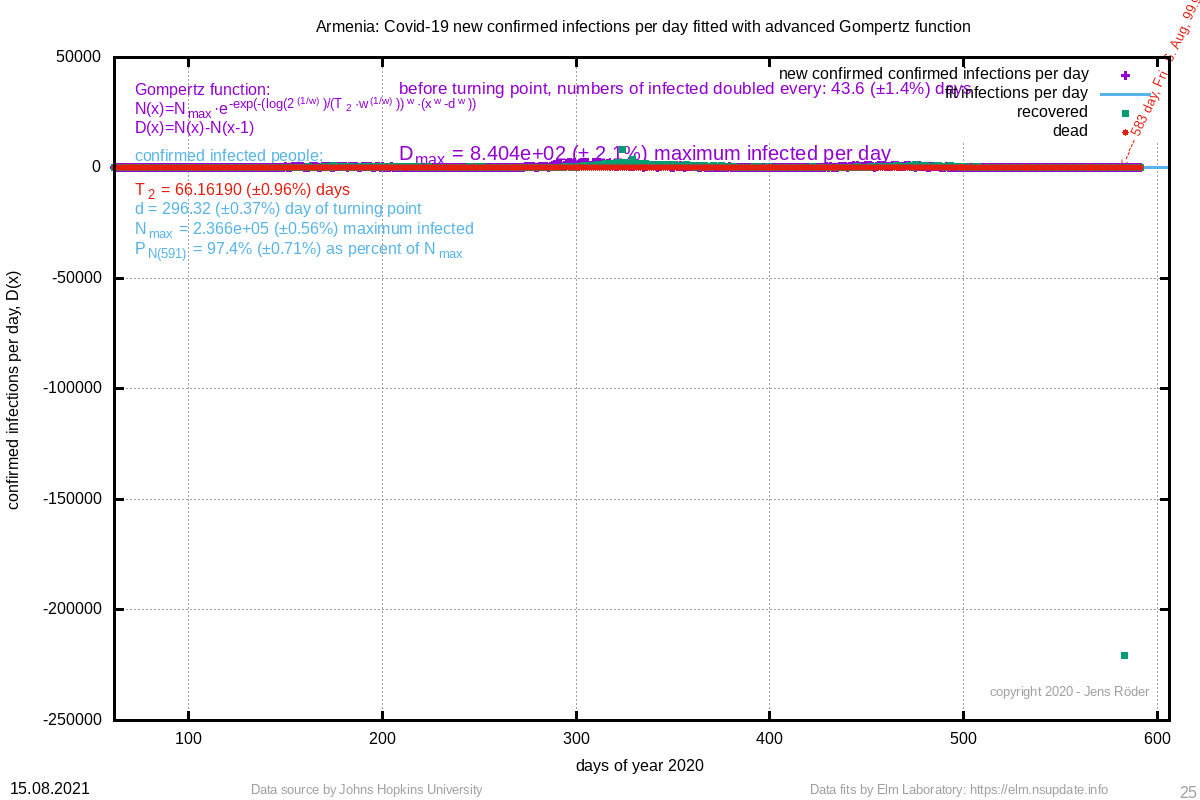 | 66.162 (±1.0%) | 296.32 (±0.4%) |
| 185902 Algeria | 14381 (±1.4%) |  | 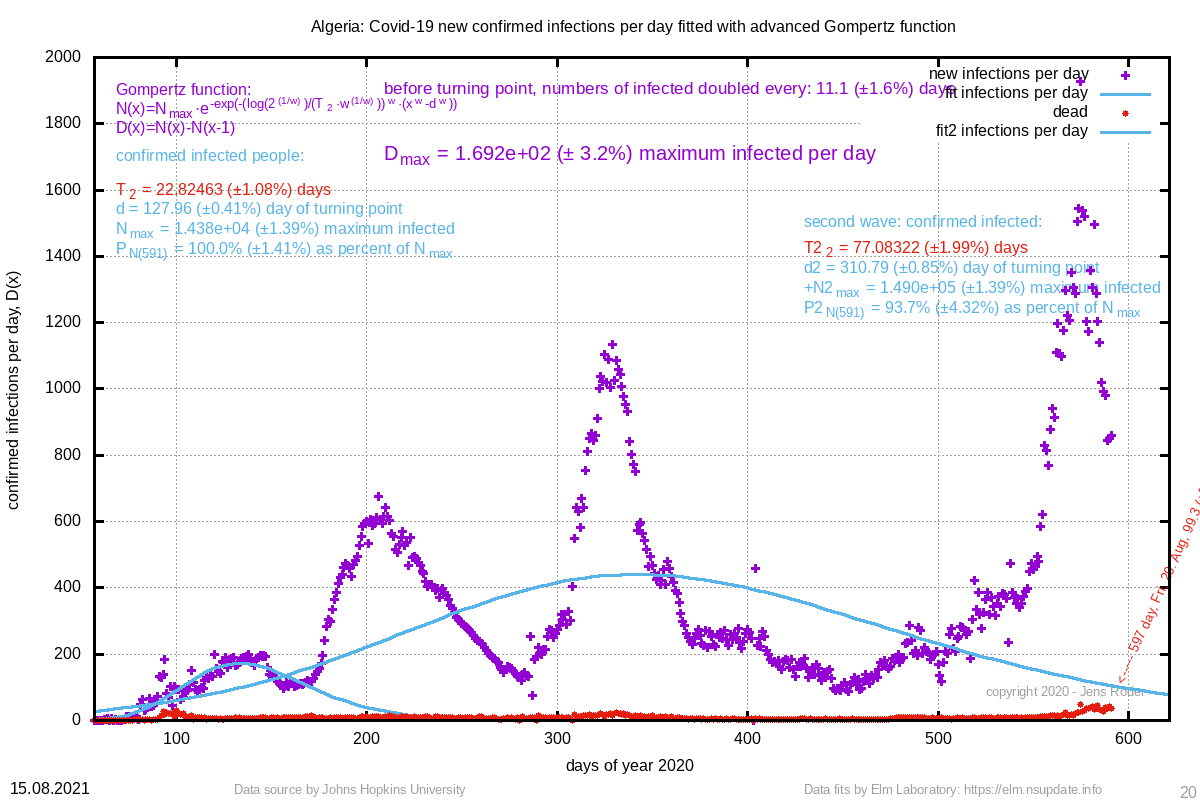 | 22.825 (±1.1%) | 127.96 (±0.4%) |
| 151770 Afghanistan | 2599527470 (±584.7%) | 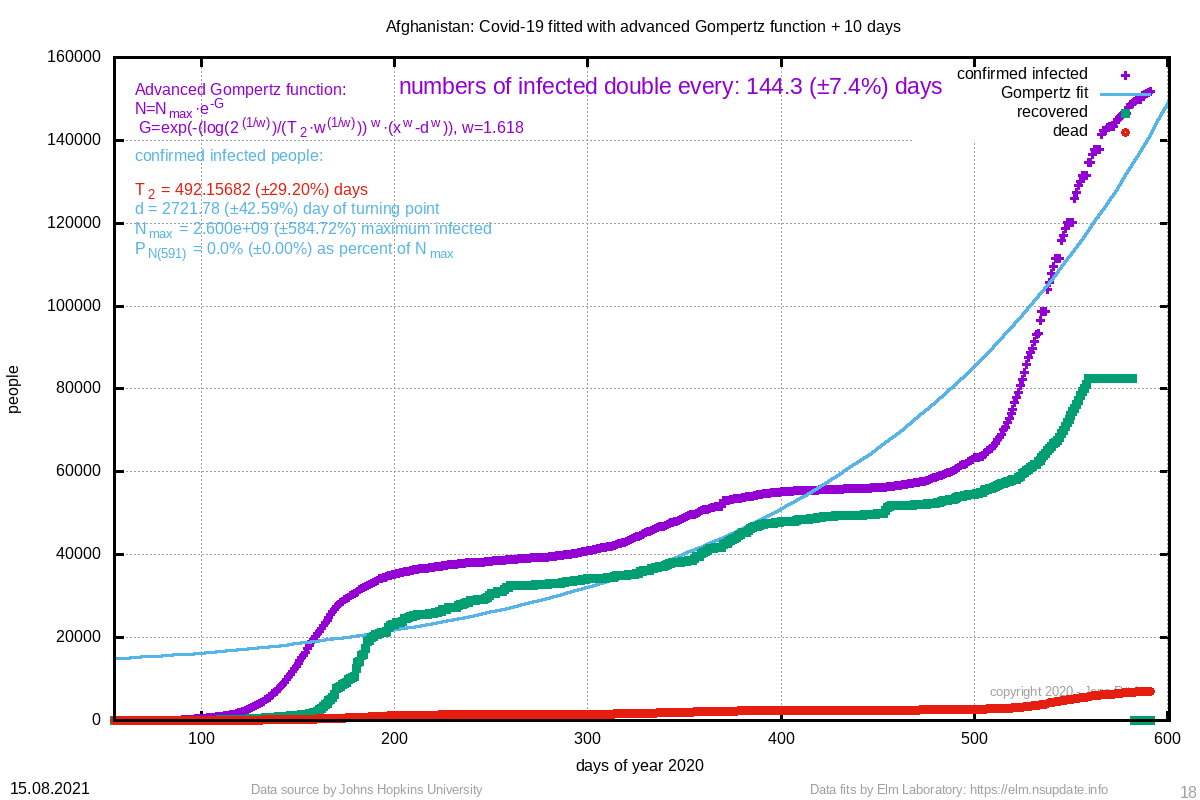 | 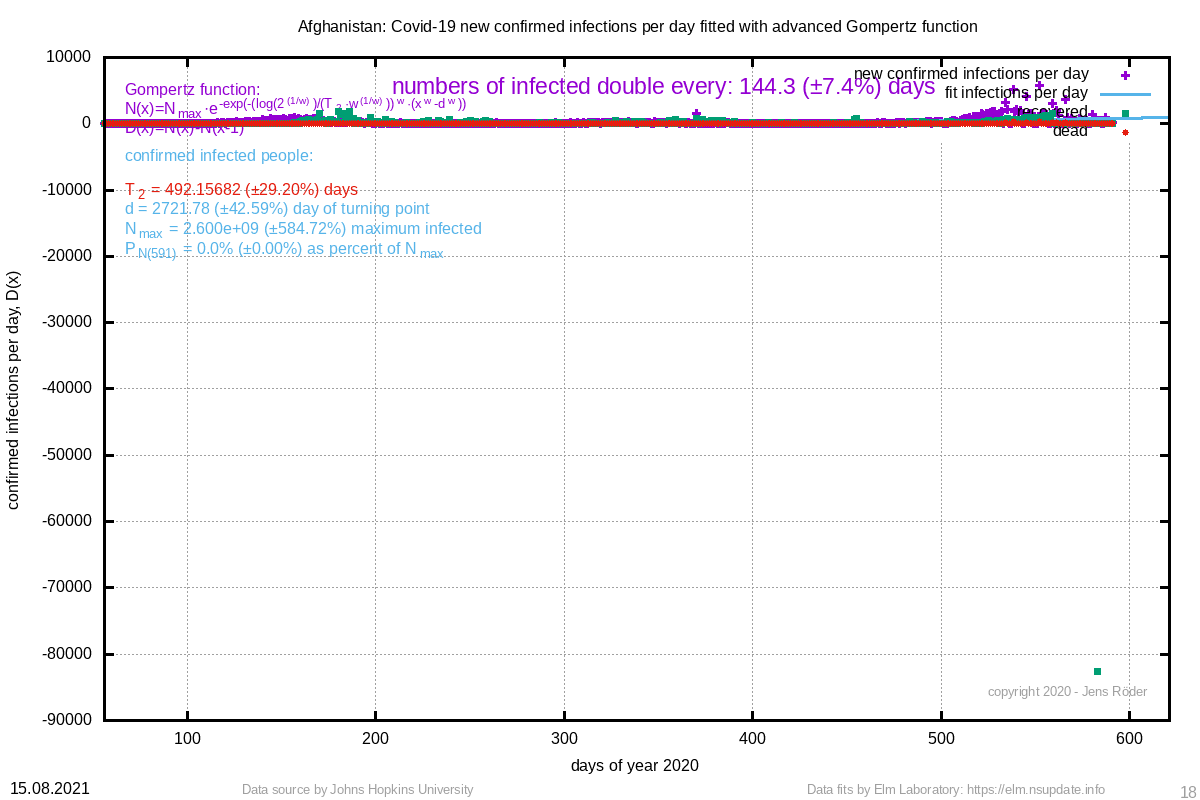 | 492.157 (±29.2%) | 2721.78 (±42.6%) |
| 136758 Botswana | 12591638 (±63.9%) | 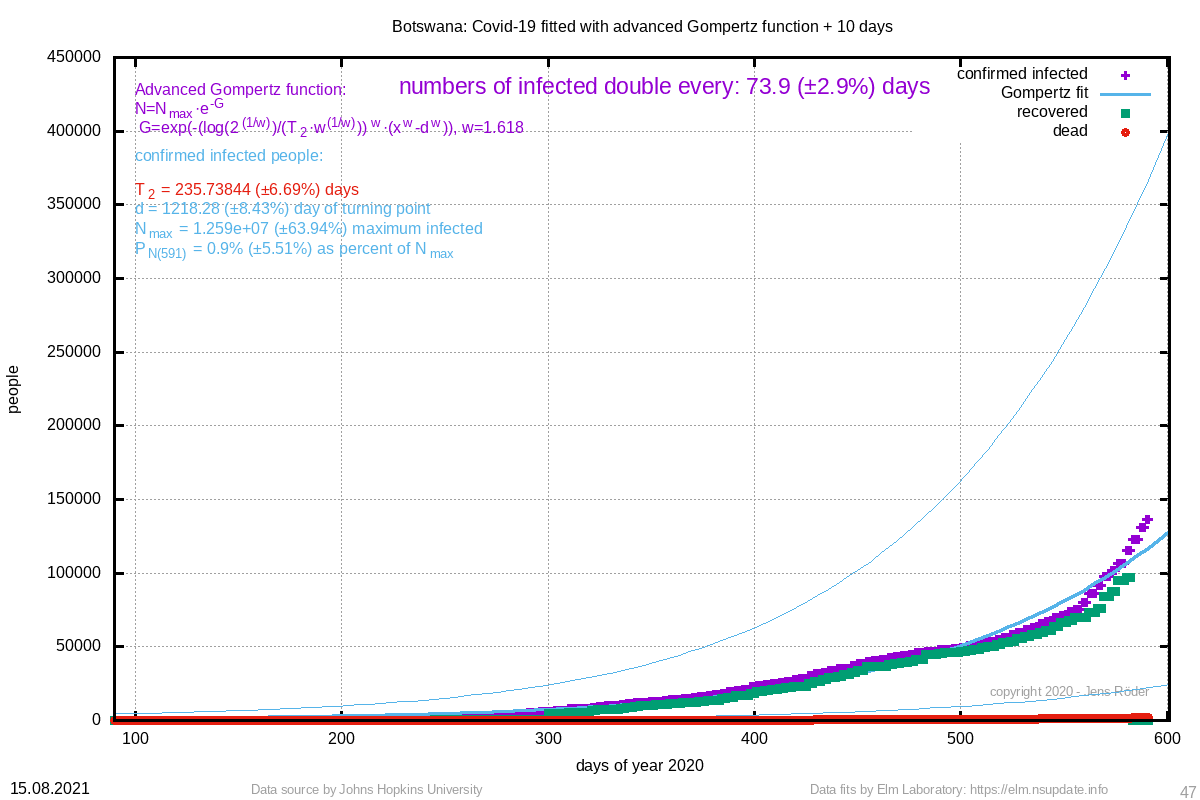 | 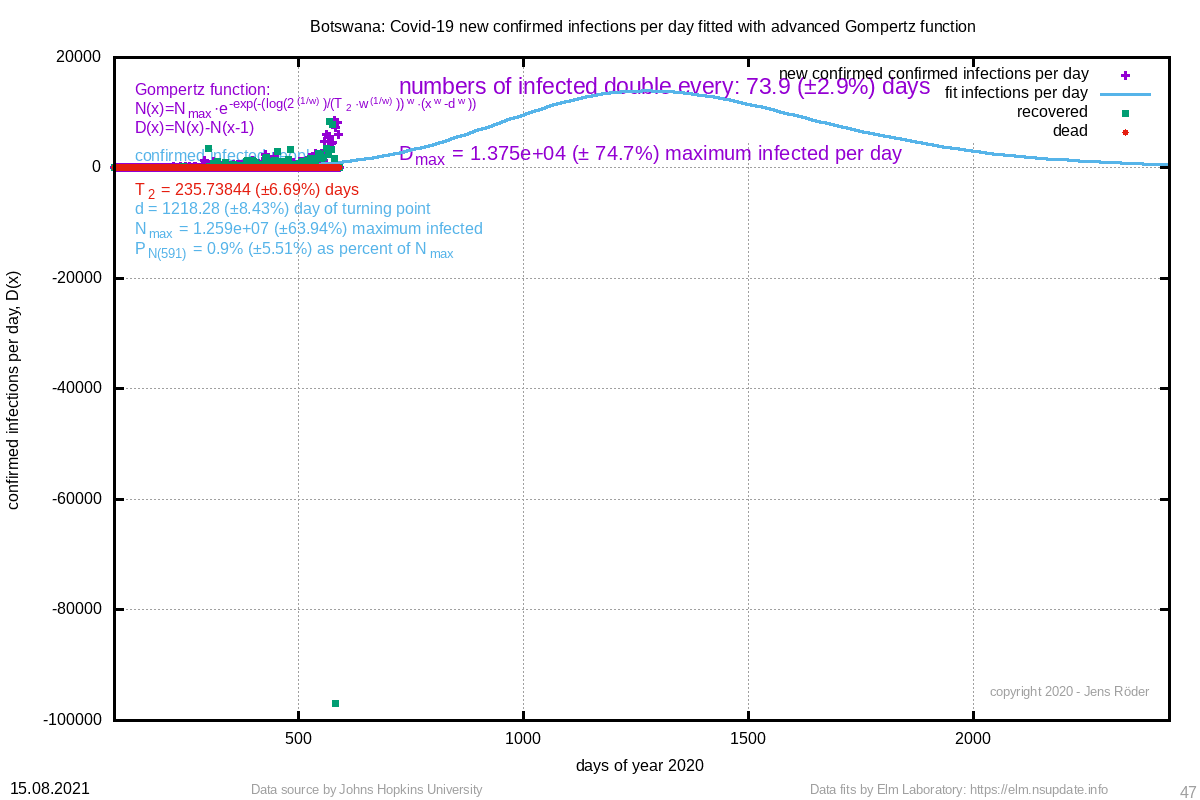 | 235.738 (±6.7%) | 1218.28 (±8.4%) |
| 135140 Albania | 141167 (±0.5%) | 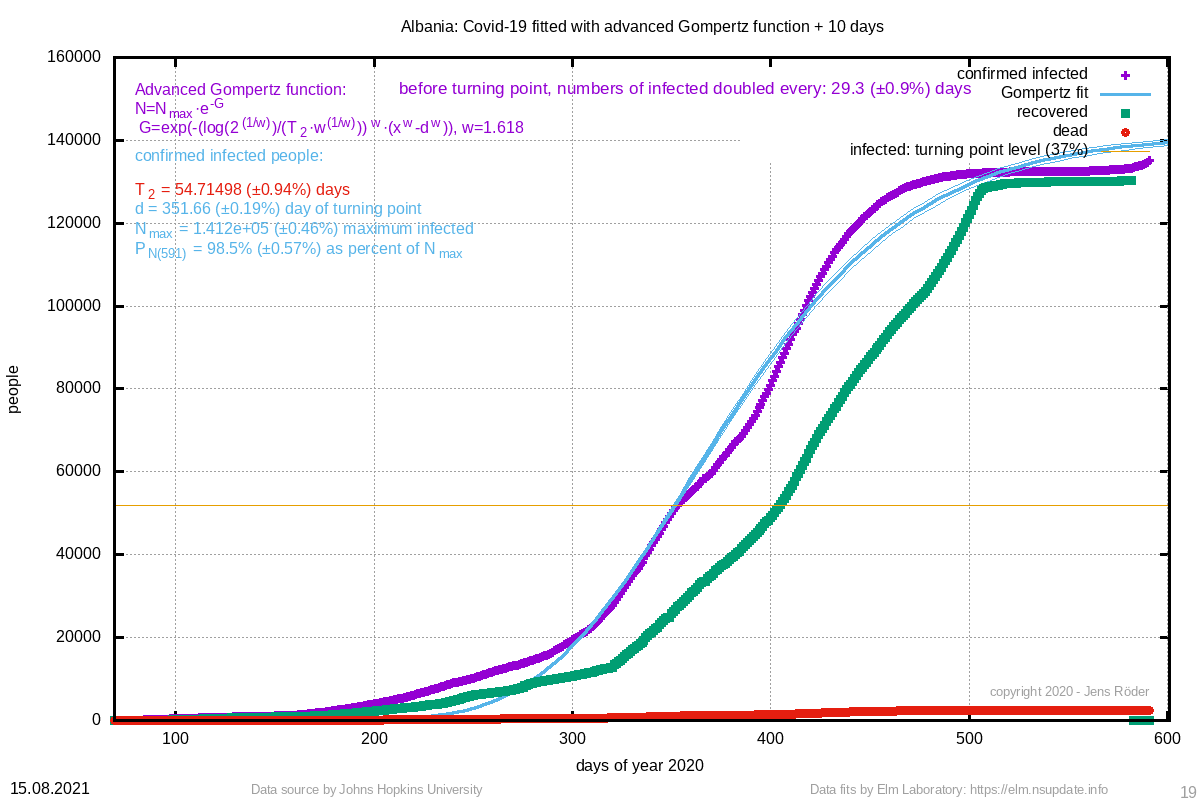 |  | 54.715 (±0.9%) | 351.66 (±0.2%) |
| 82454 Cameroon | 193769 (±8.2%) | 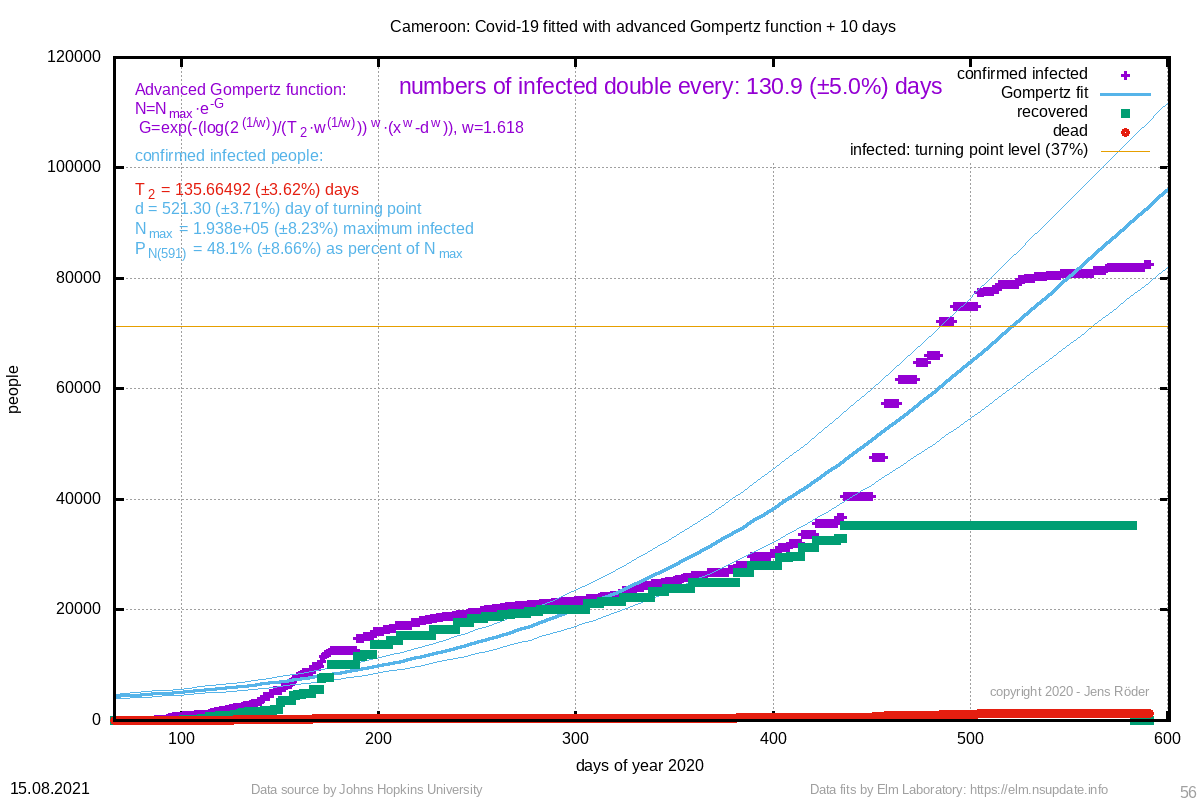 | 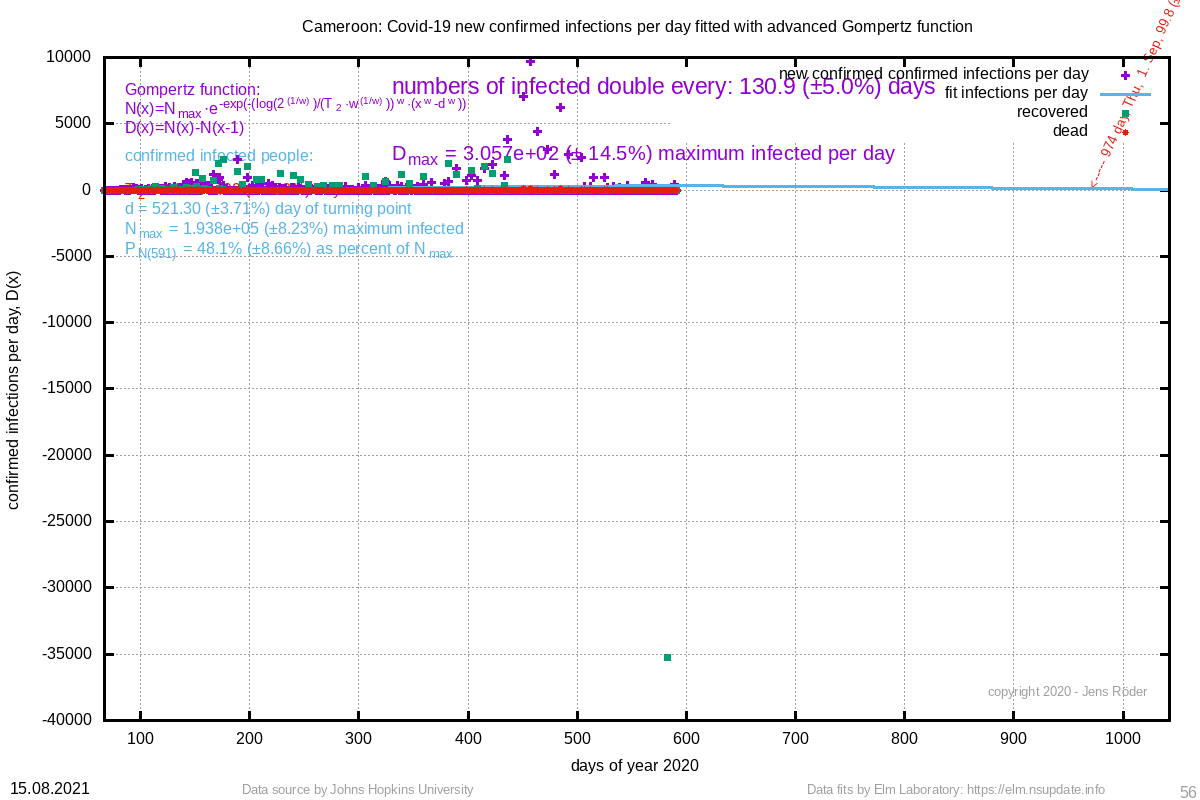 | 135.665 (±3.6%) | 521.30 (±3.7%) |
| 52971 Congo (Kinshasa) | 1291095 (±200.5%) | 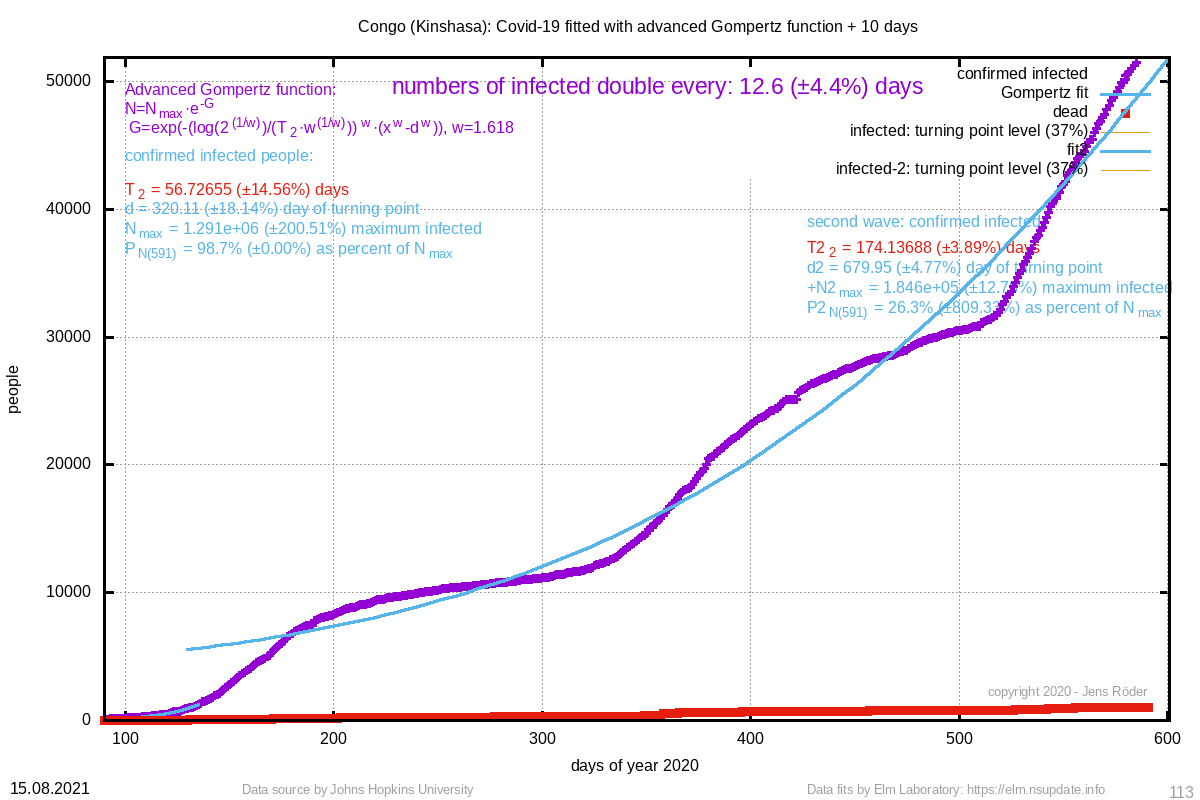 | 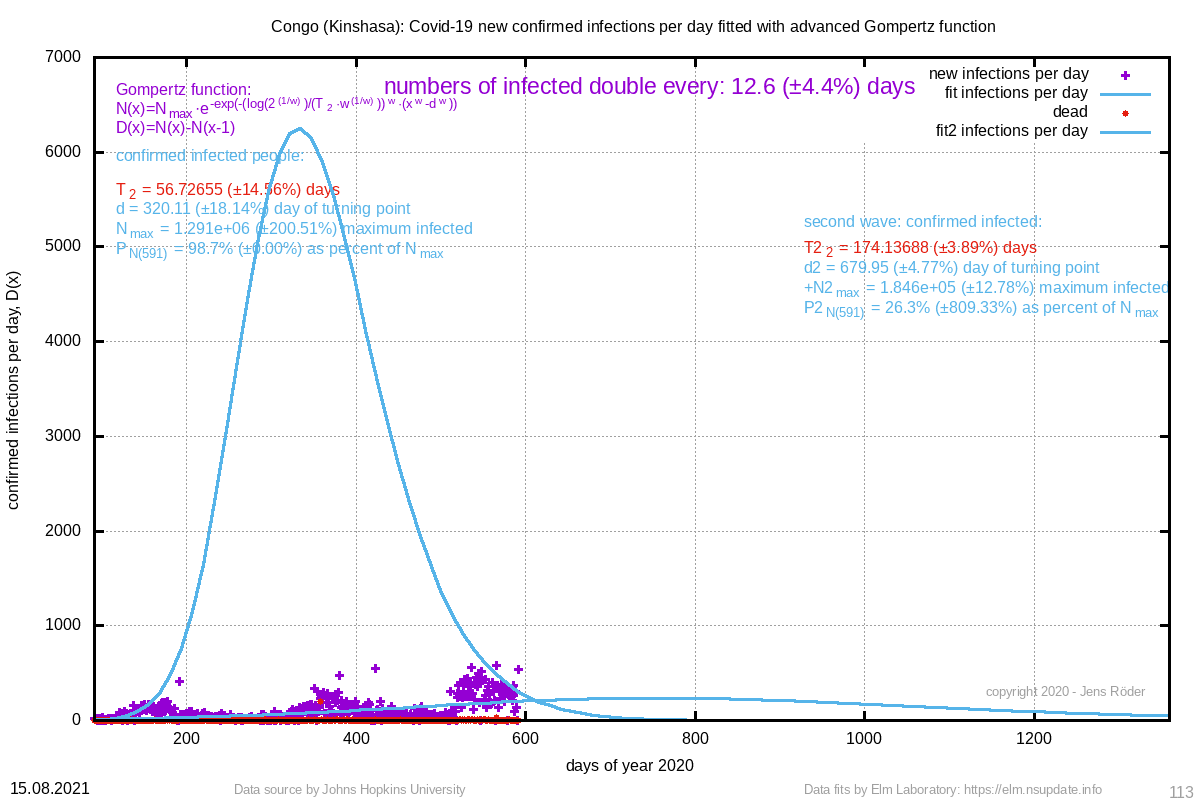 | 56.727 (±14.6%) | 320.11 (±18.1%) |
| 44328 Angola | 58501 (±3.0%) | 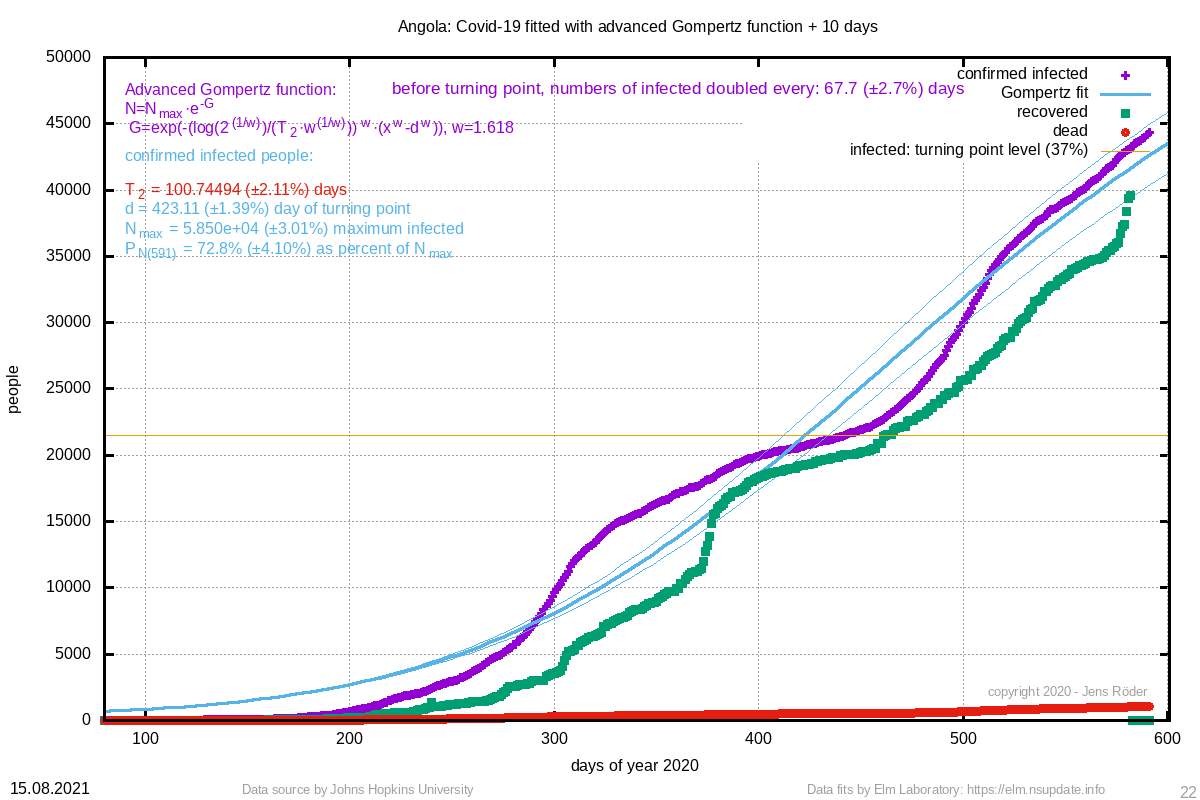 | 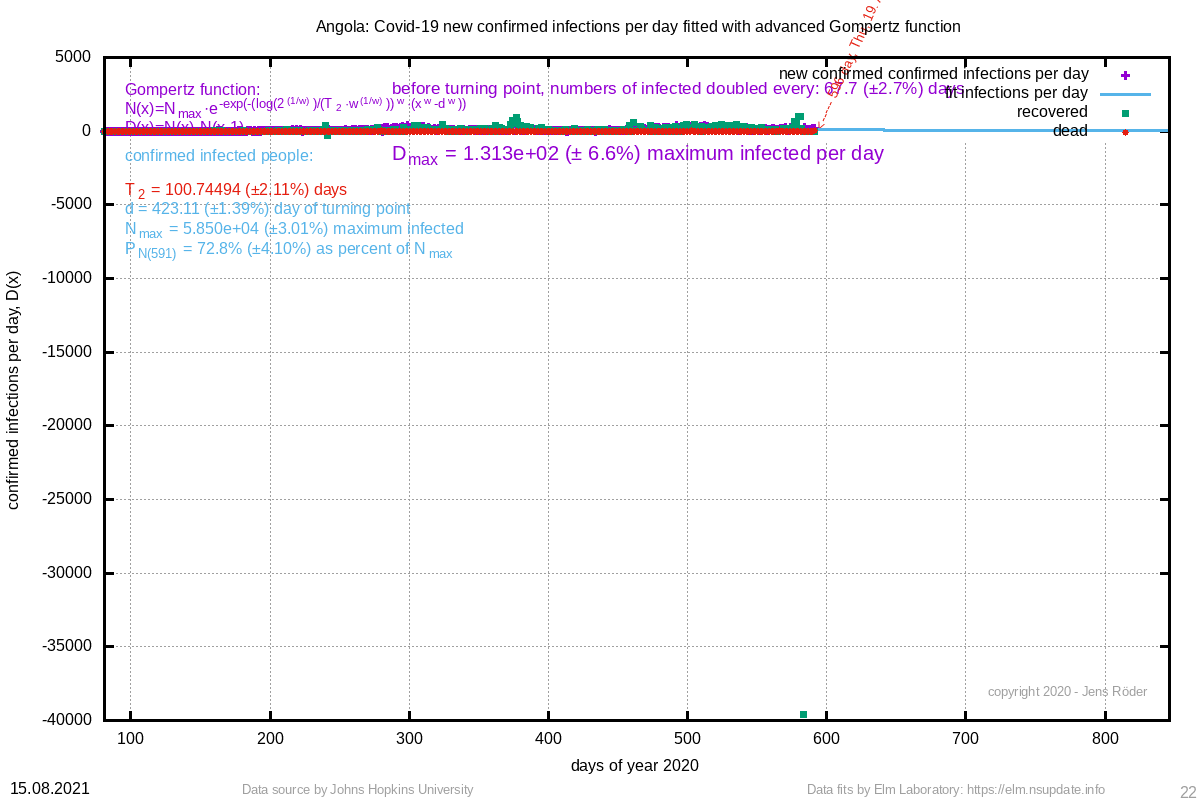 | 100.745 (±2.1%) | 423.11 (±1.4%) |
| 34286 Cabo Verde | 60662 (±3.7%) | 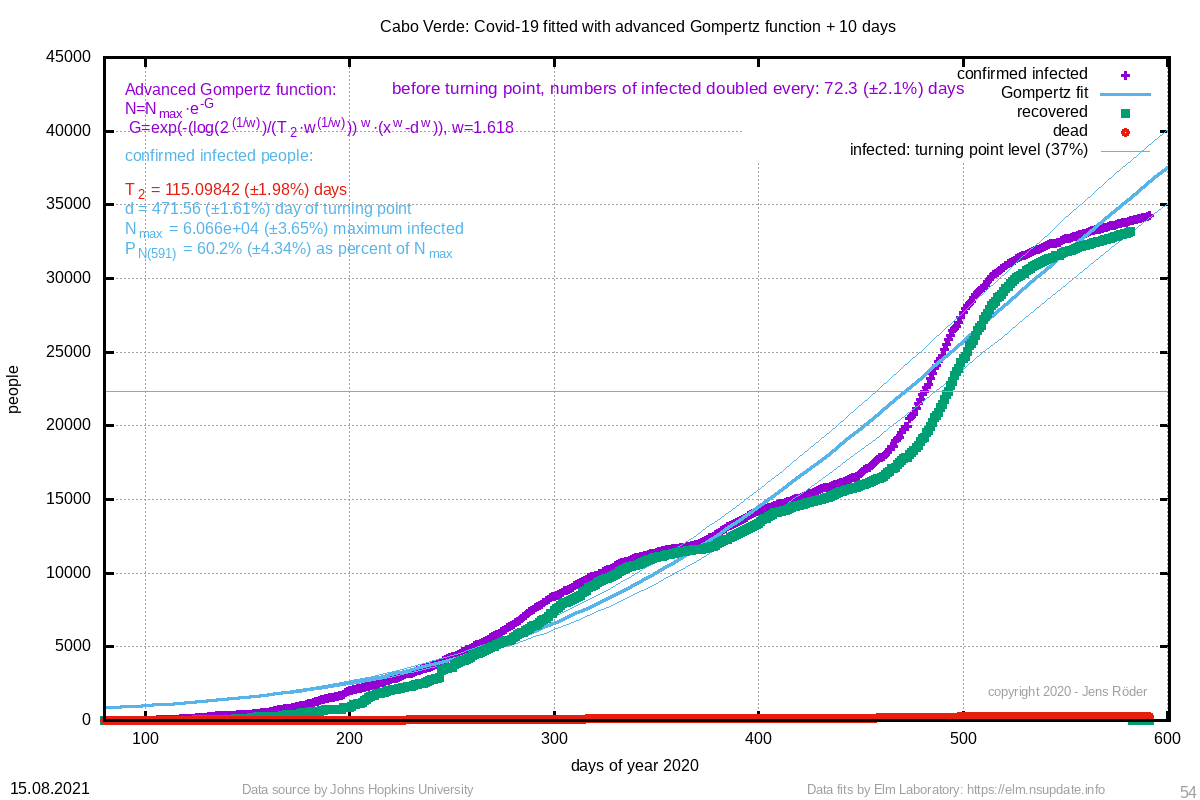 | 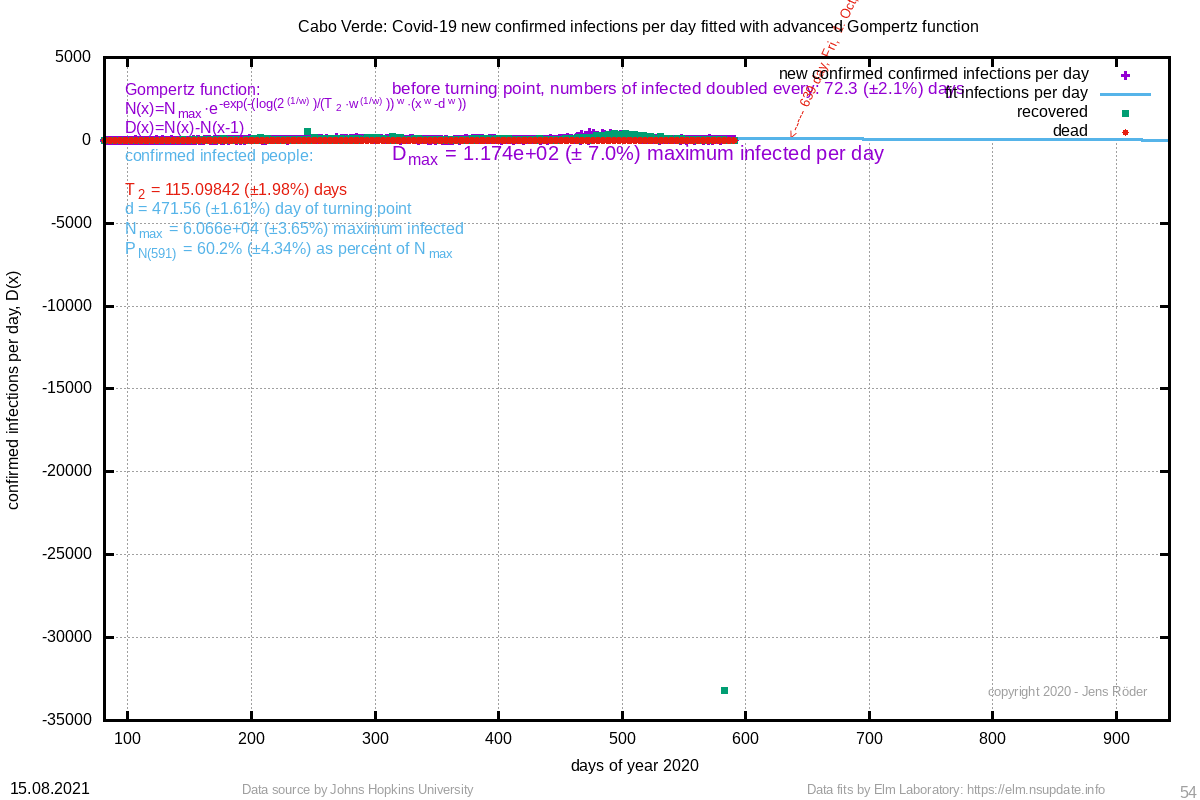 | 115.098 (±2.0%) | 471.56 (±1.6%) |
| 16141 Bahamas | 13582 (±1.5%) | 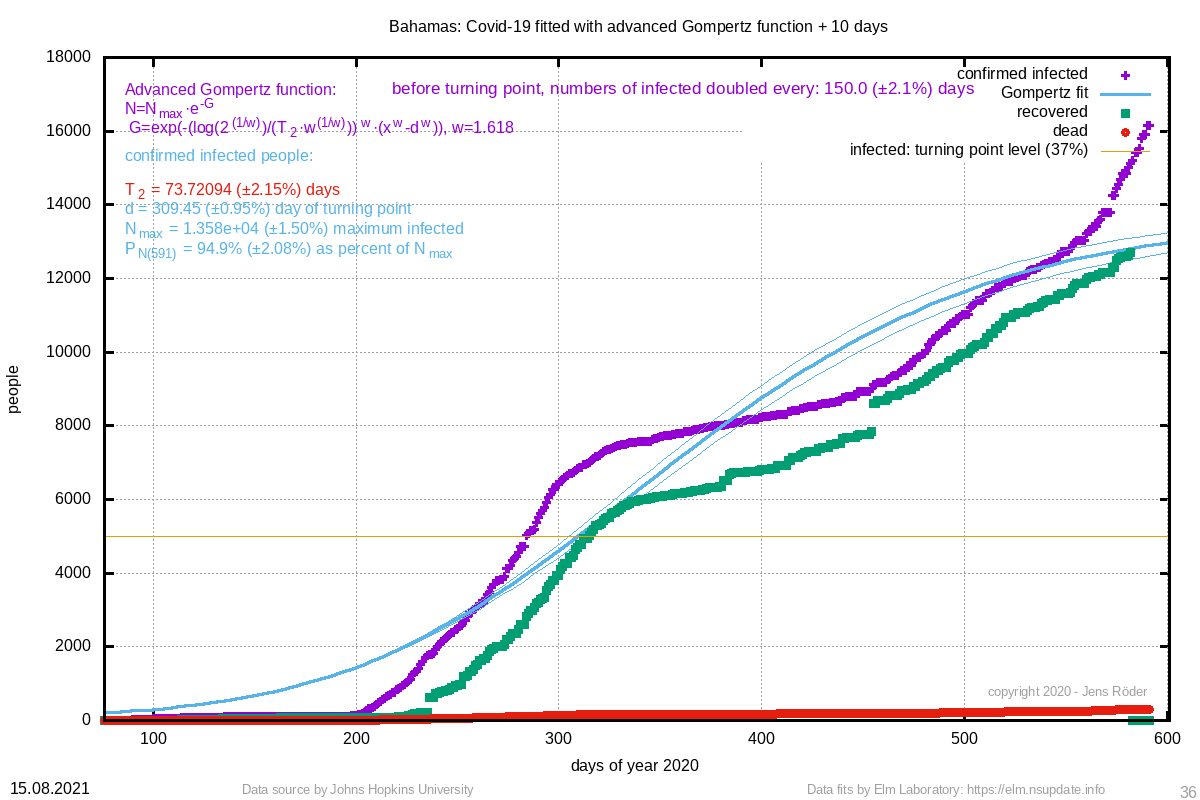 |  | 73.721 (±2.2%) | 309.45 (±0.9%) |
| 14847 Belize | 13294 (±0.3%) | 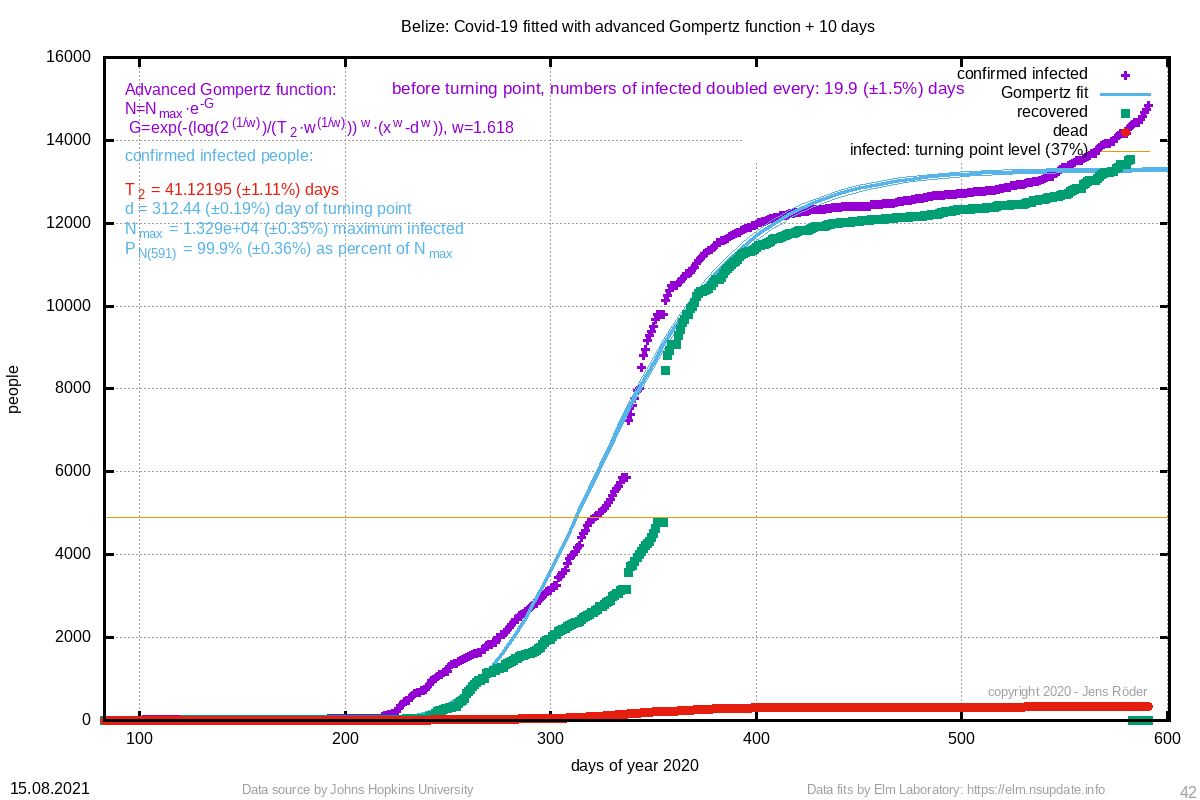 | 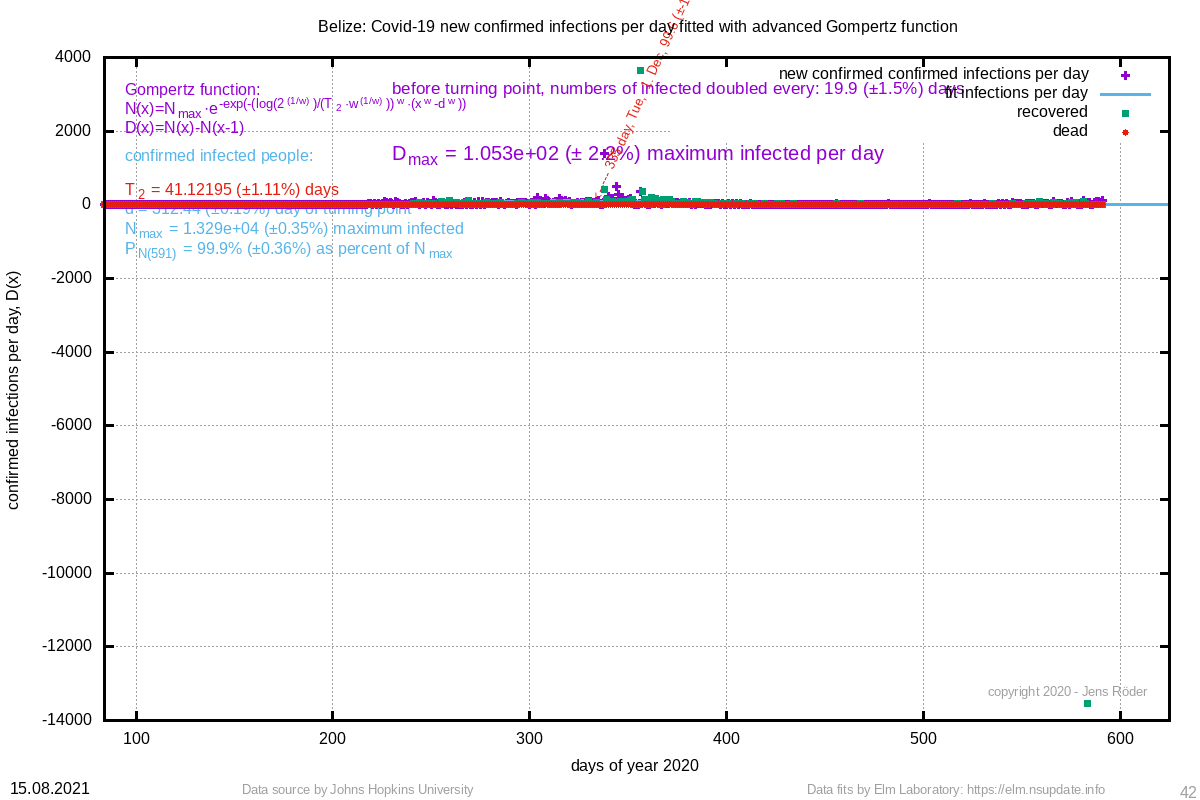 | 41.122 (±1.1%) | 312.44 (±0.2%) |
| 13668 Burkina Faso | 13987 (±0.7%) | 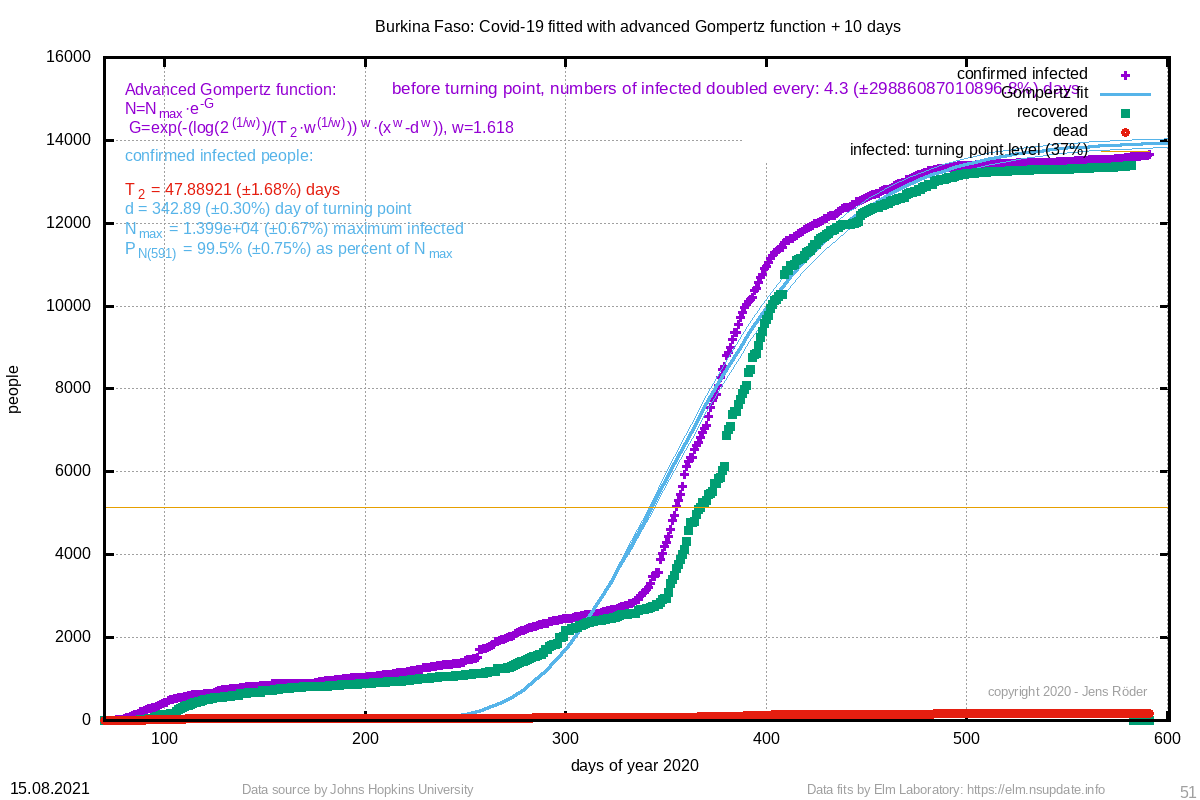 | 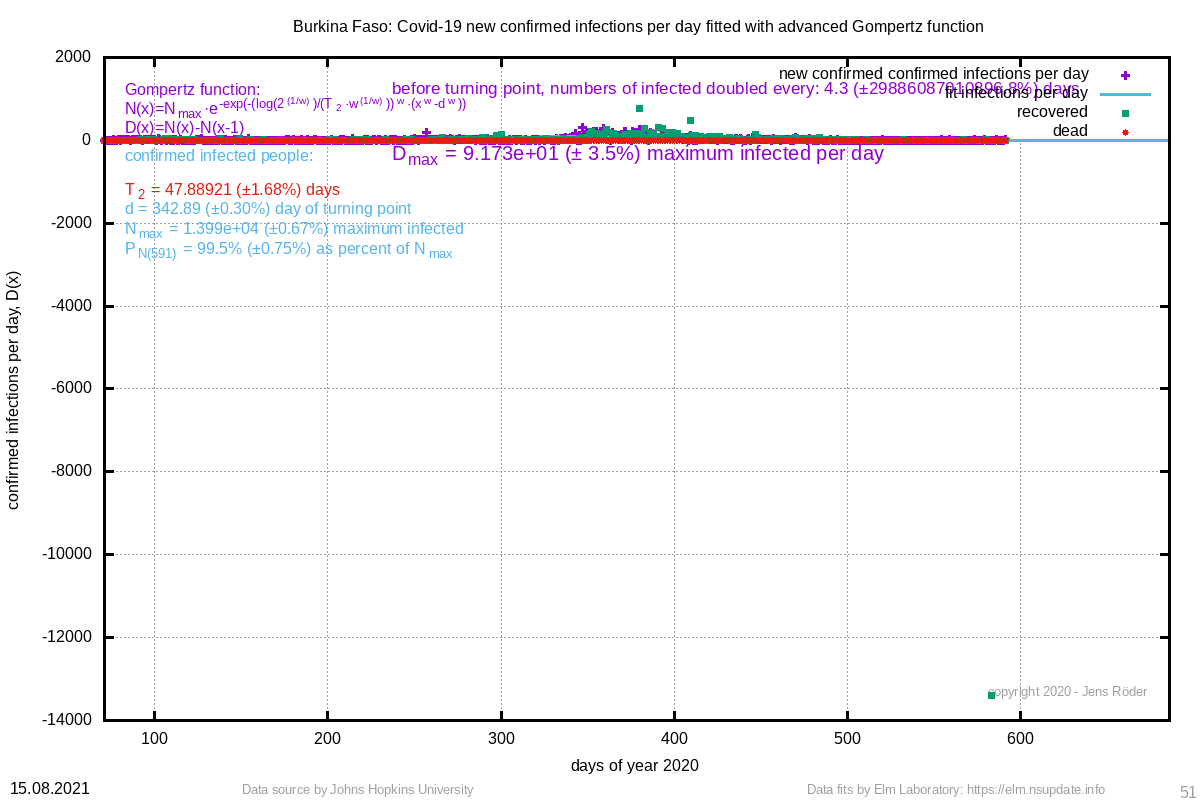 | 47.889 (±1.7%) | 342.89 (±0.3%) |
| 13356 Congo (Brazzaville) | 14609 (±1.3%) | 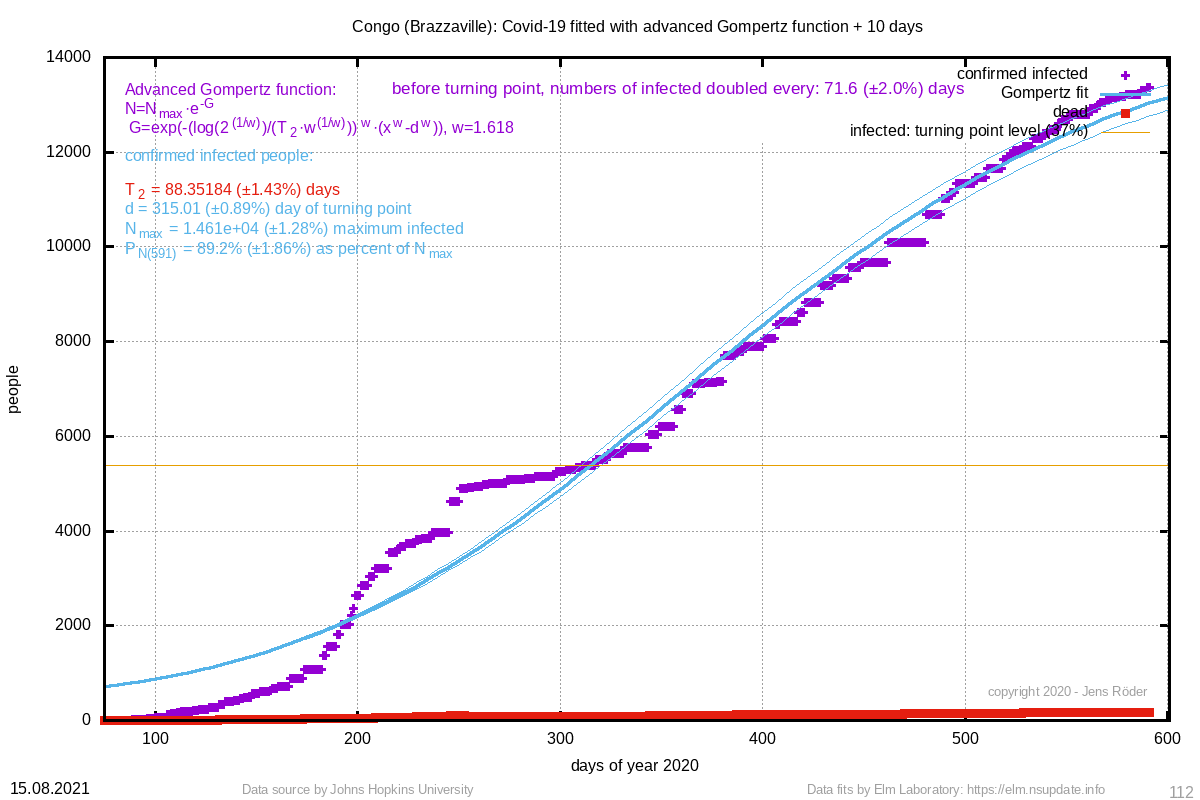 | 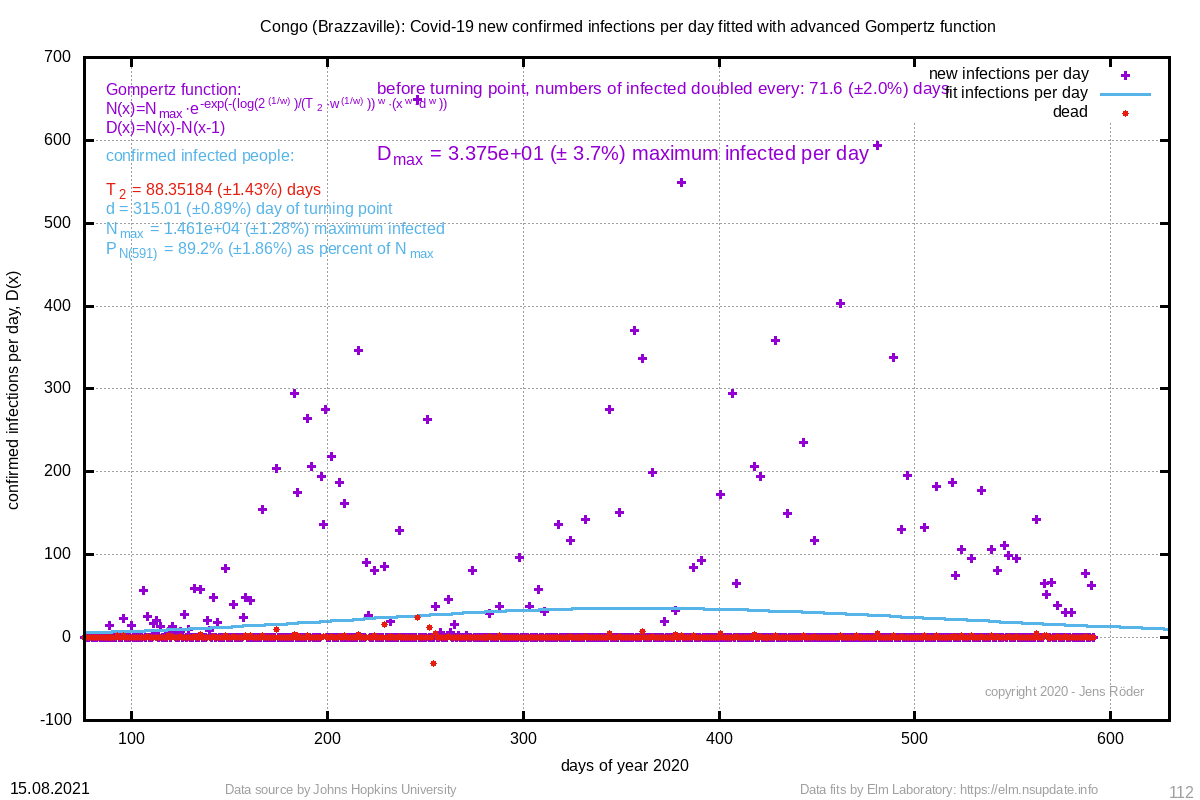 | 88.352 (±1.4%) | 315.01 (±0.9%) |
| 13092 New South Wales, Australia | 3060 (±0.2%) | 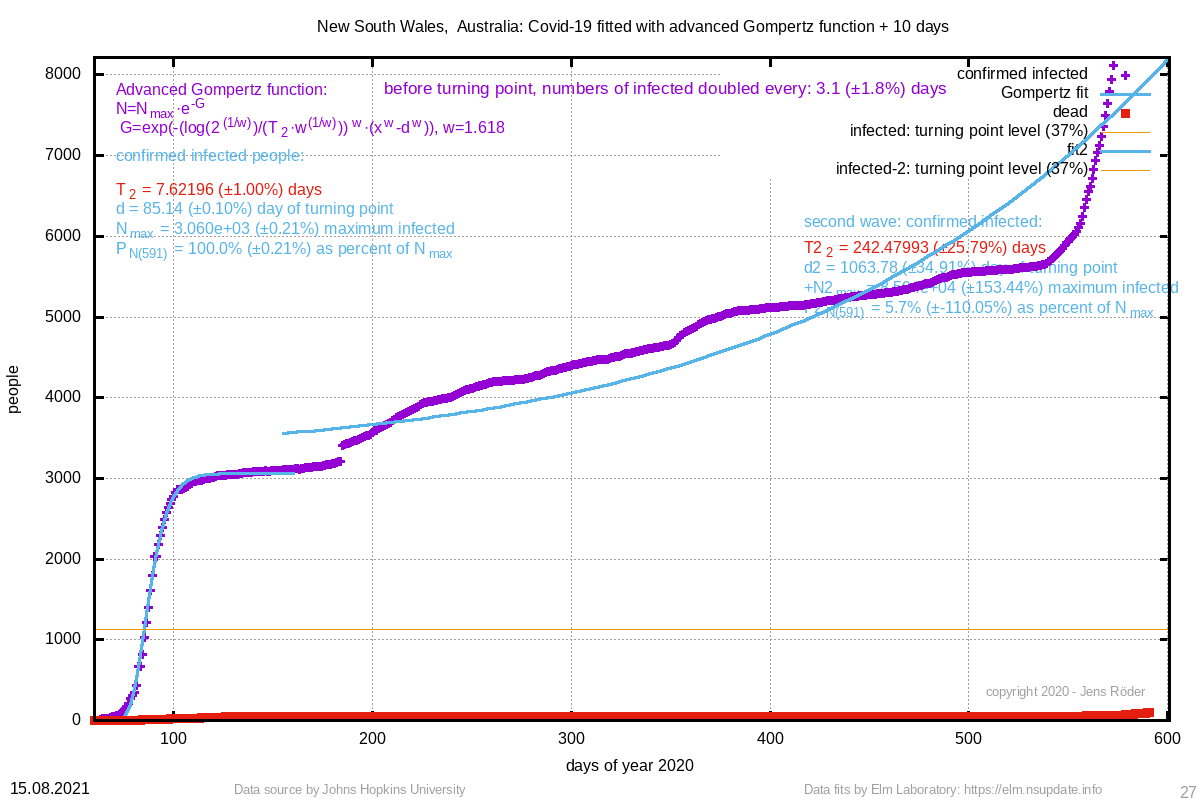 |  | 7.622 (±1.0%) | 85.14 (±0.1%) |
| 11195 Central African Republic | 5757 (±0.9%) | 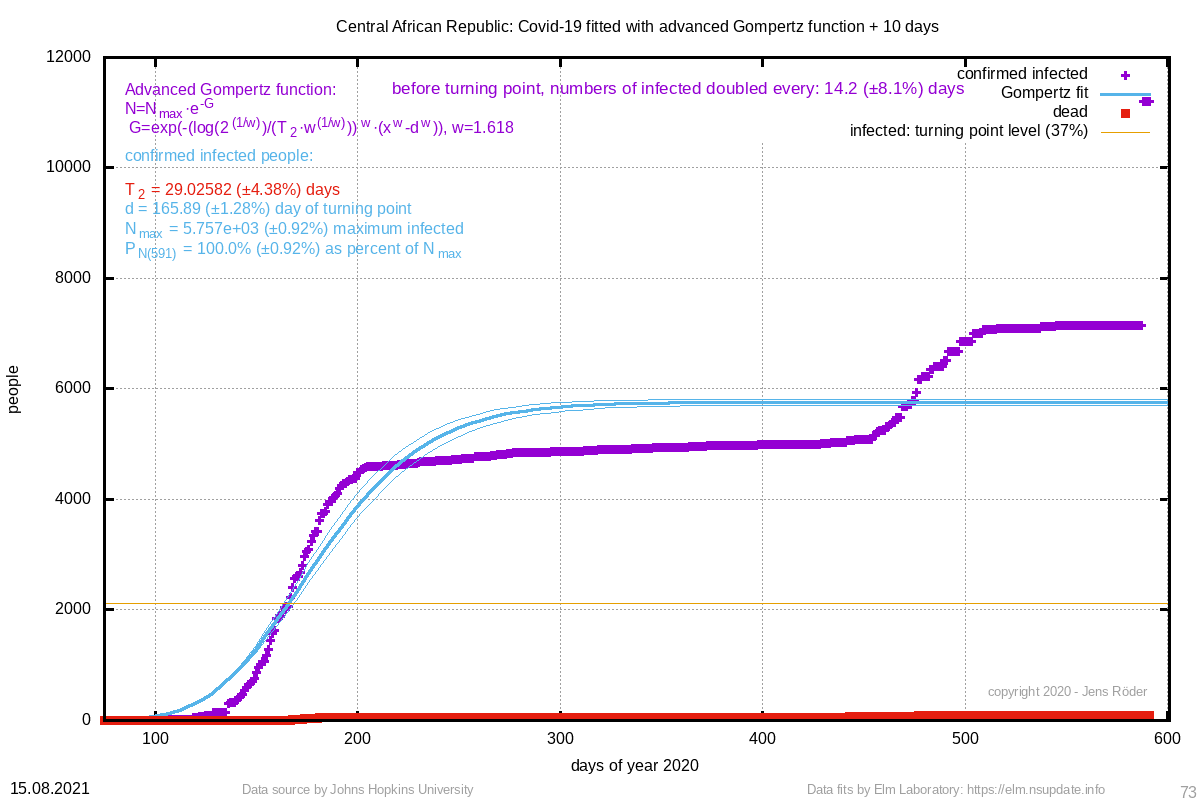 | 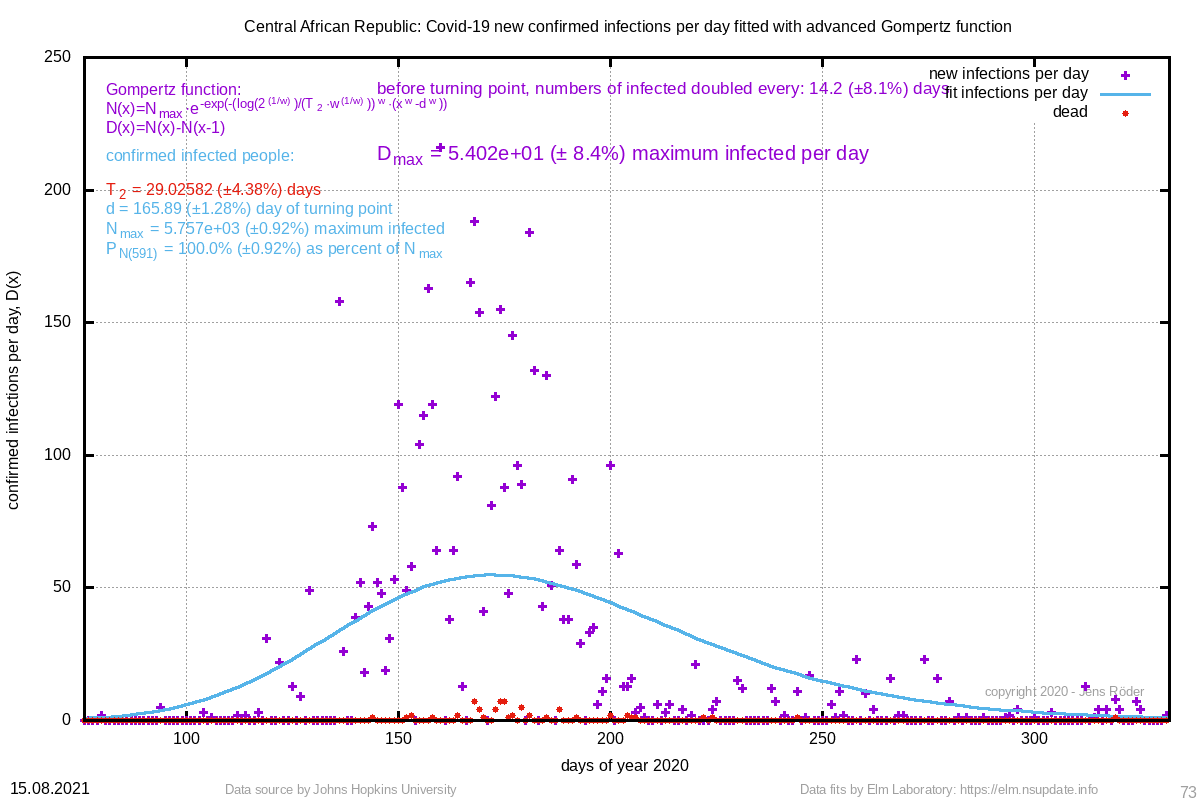 | 29.026 (±4.4%) | 165.89 (±1.3%) |
| 9620 Burundi | 37000 (±11.9%) | 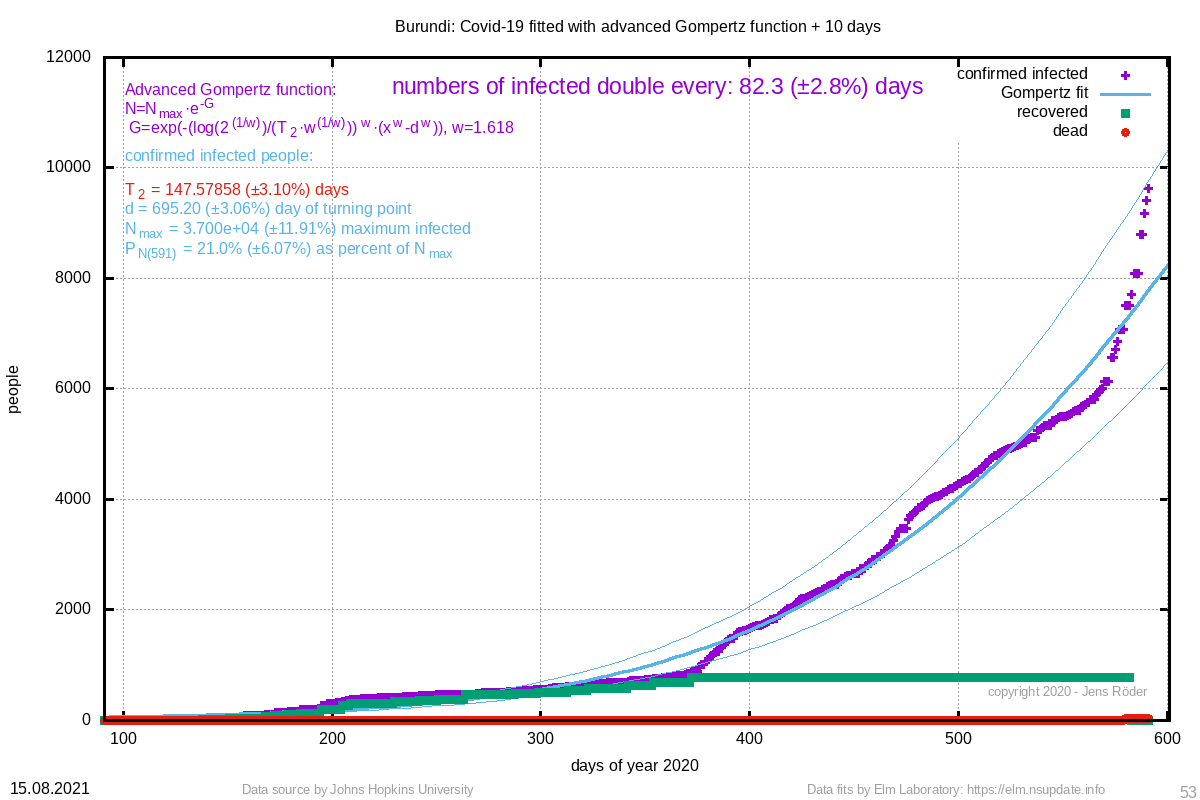 | 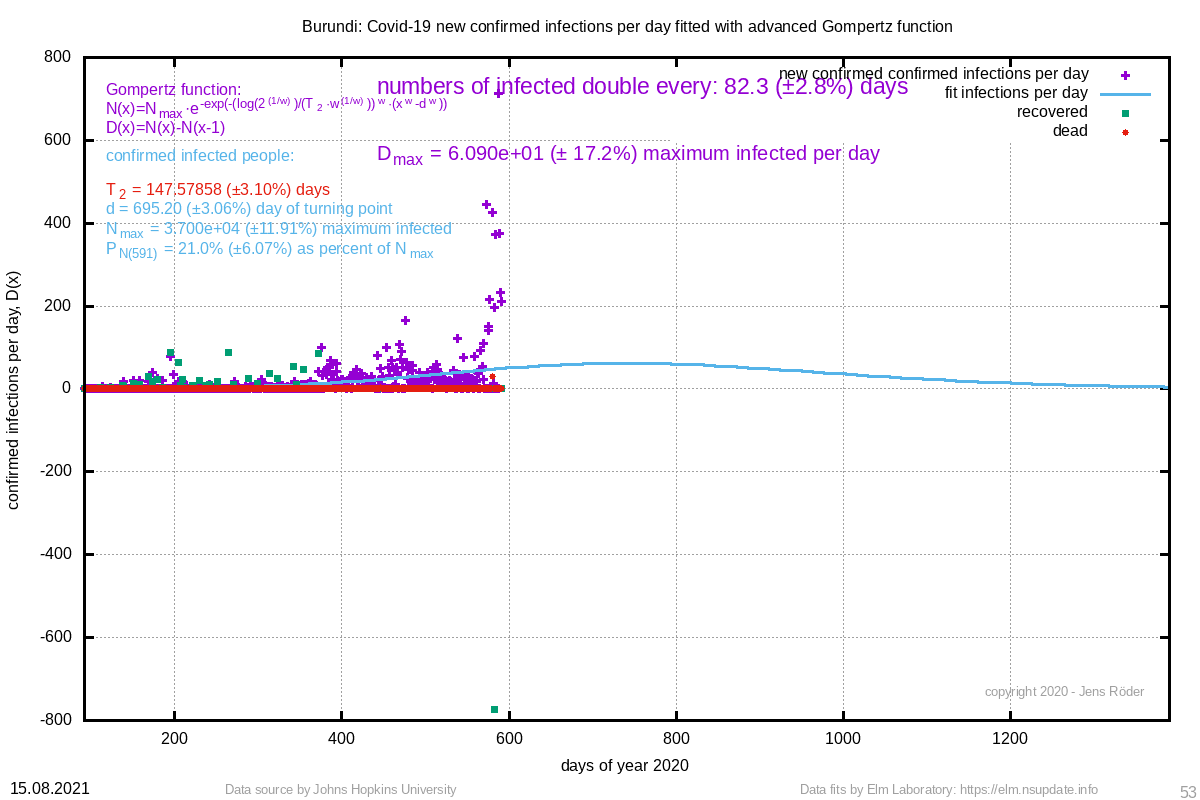 | 147.579 (±3.1%) | 695.20 (±3.1%) |
| 9065 Benin | 11172 (±2.3%) | 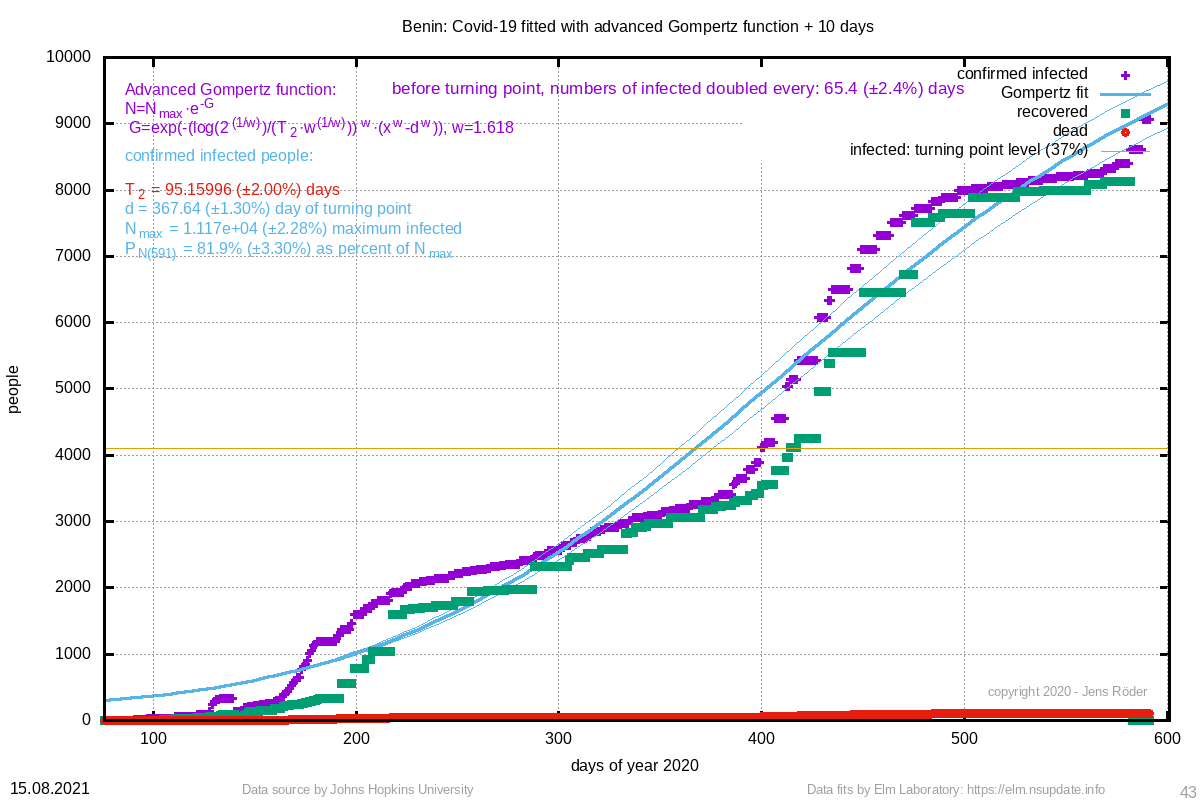 | 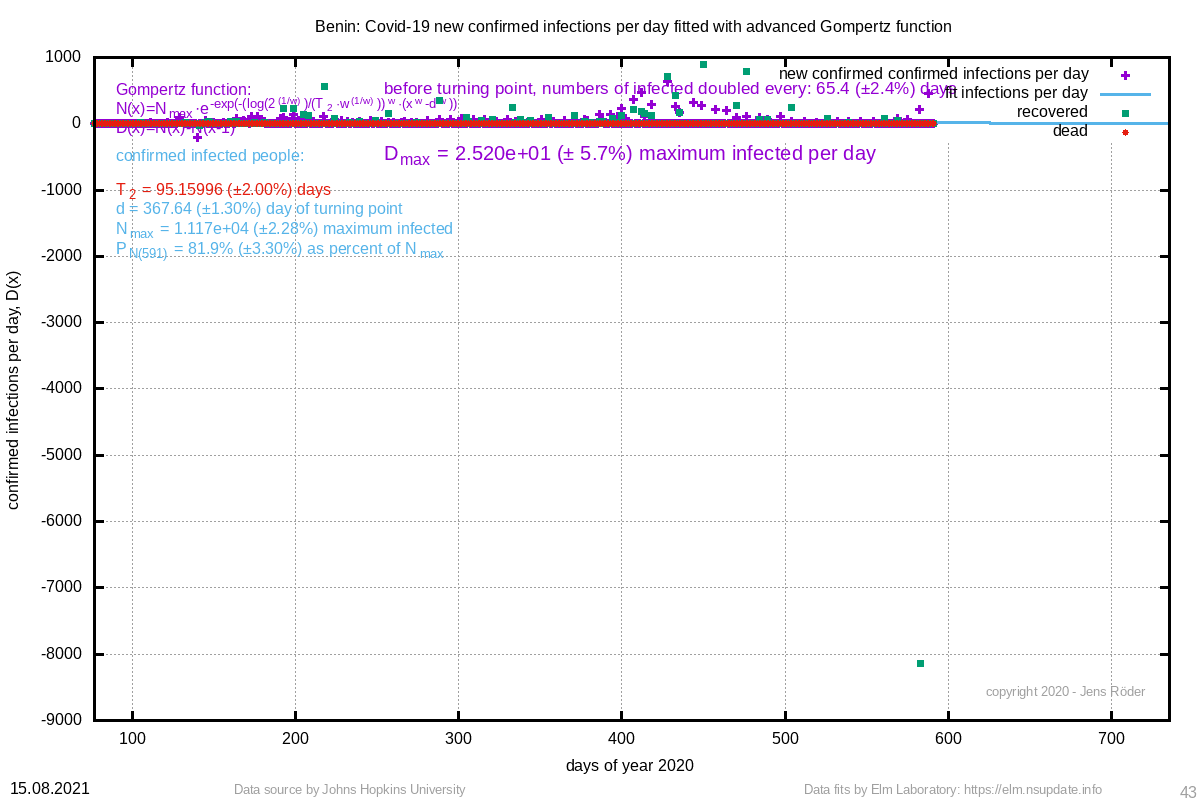 | 95.160 (±2.0%) | 367.64 (±1.3%) |
| 6600 Eritrea | 12493 (±4.2%) | 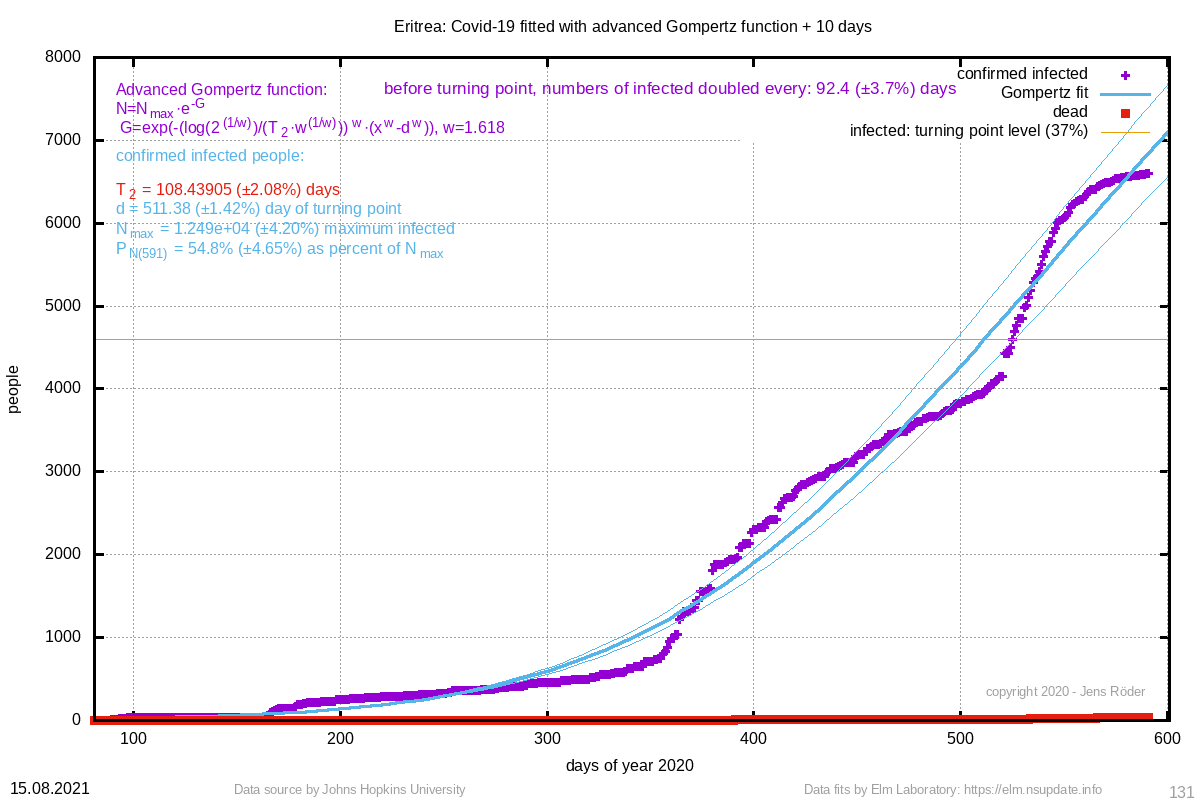 | 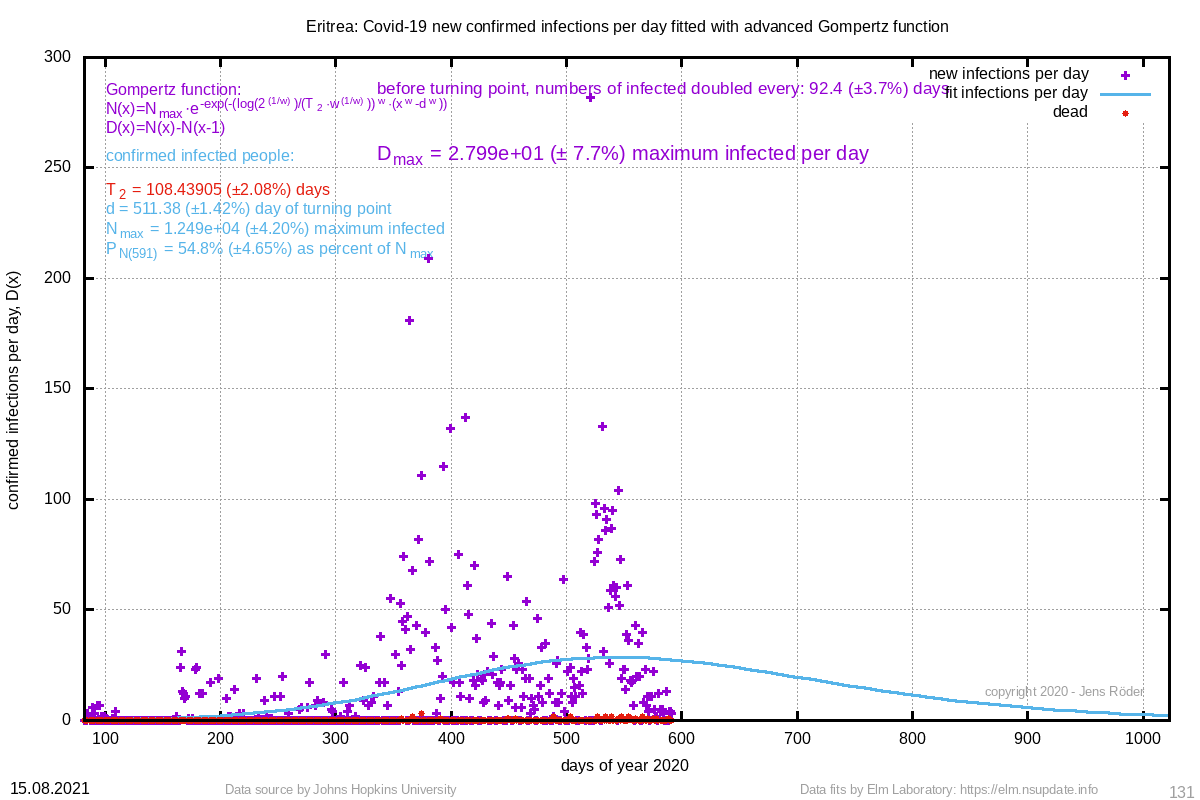 | 108.439 (±2.1%) | 511.38 (±1.4%) |
| 5920 Nova Scotia, Canada | 2886187893 (±782.0%) | 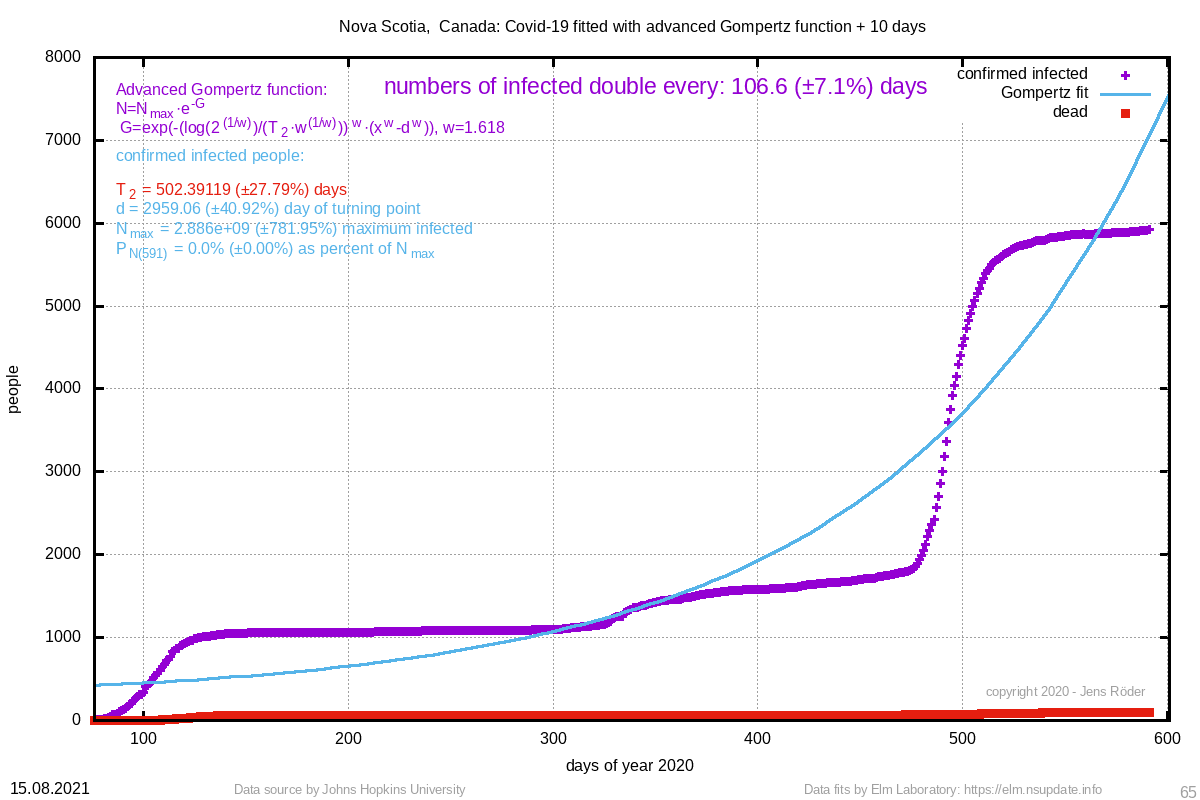 | 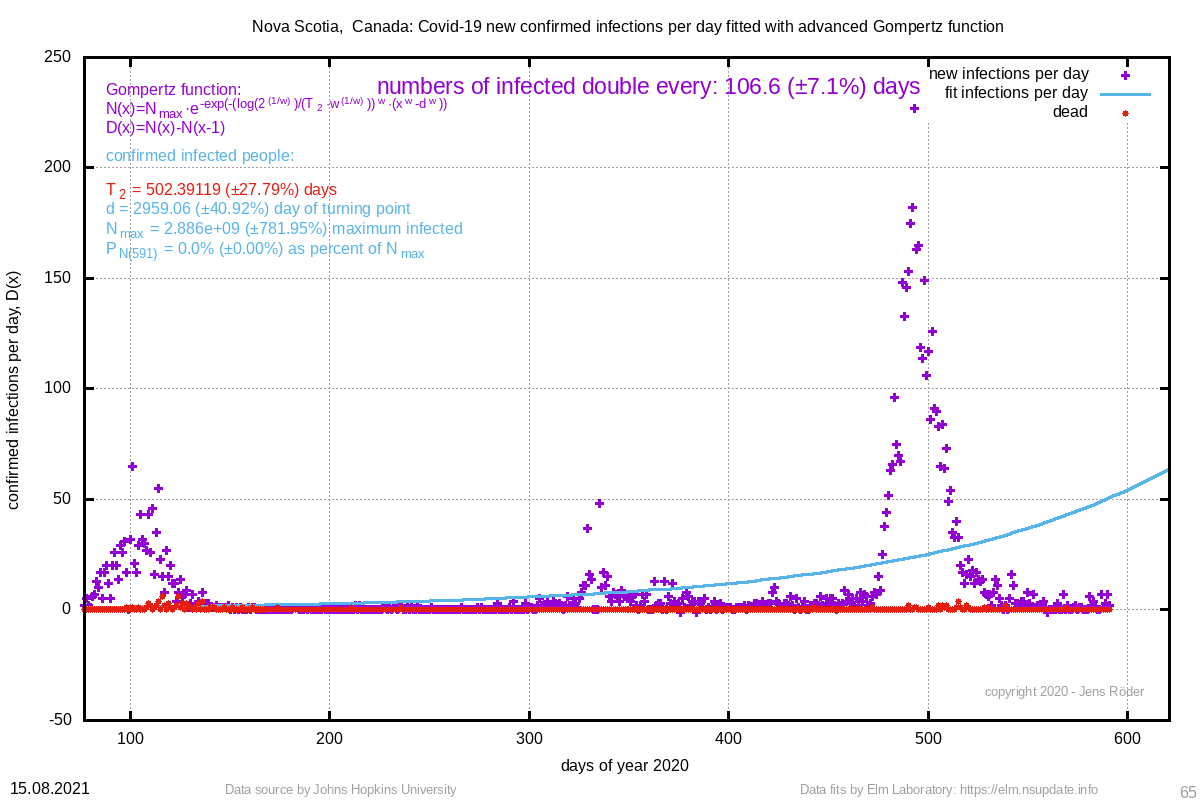 | 502.391 (±27.8%) | 2959.06 (±40.9%) |
| 5052 Guinea-Bissau | 4454 (±2.1%) | 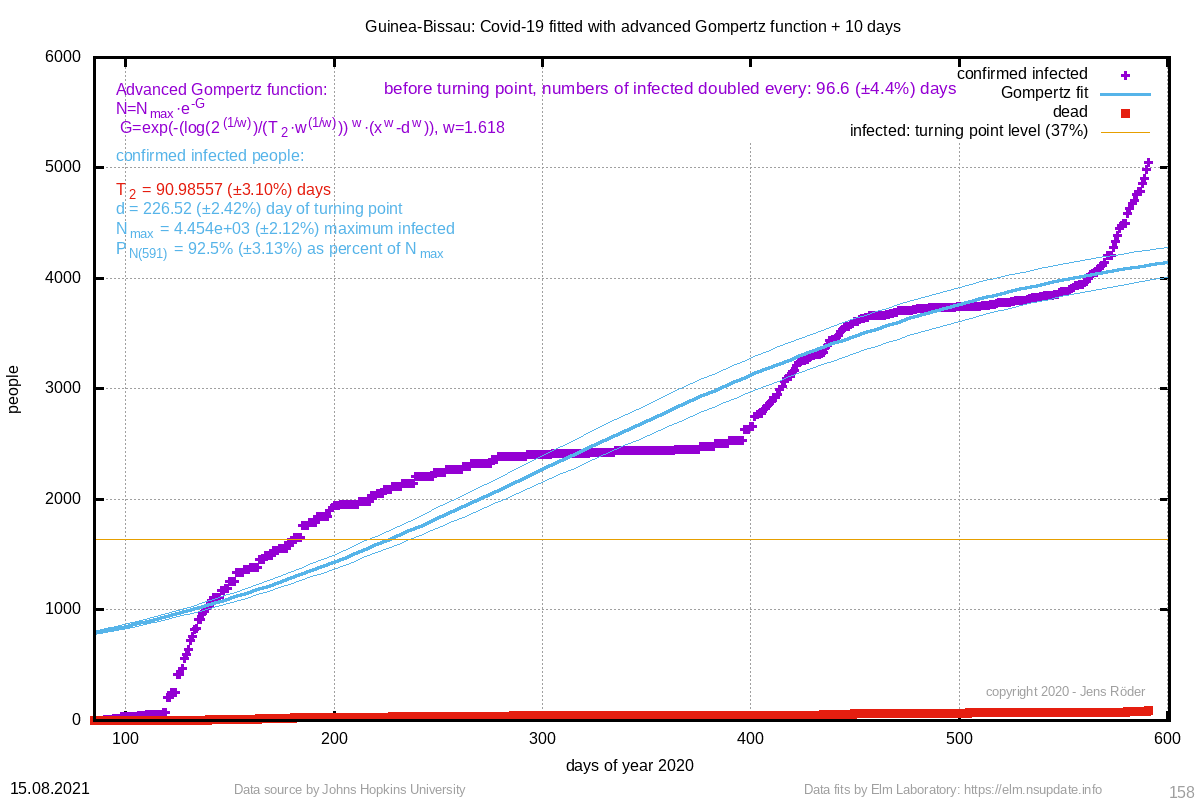 |  | 90.986 (±3.1%) | 226.52 (±2.4%) |
| 2566 Bhutan | 63035 (±35.3%) | 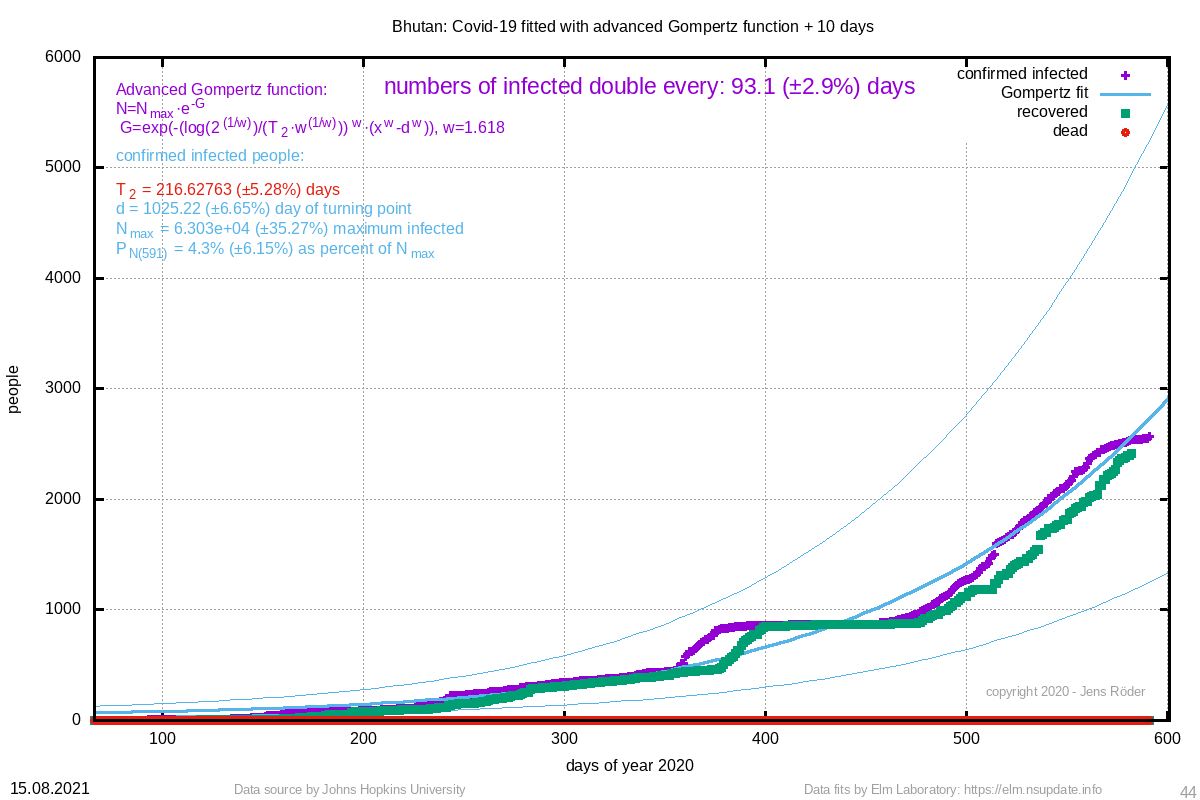 |  | 216.628 (±5.3%) | 1025.22 (±6.7%) |
| 1447 Newfoundland and Labrador, Canada | 325100179 (±686.4%) | 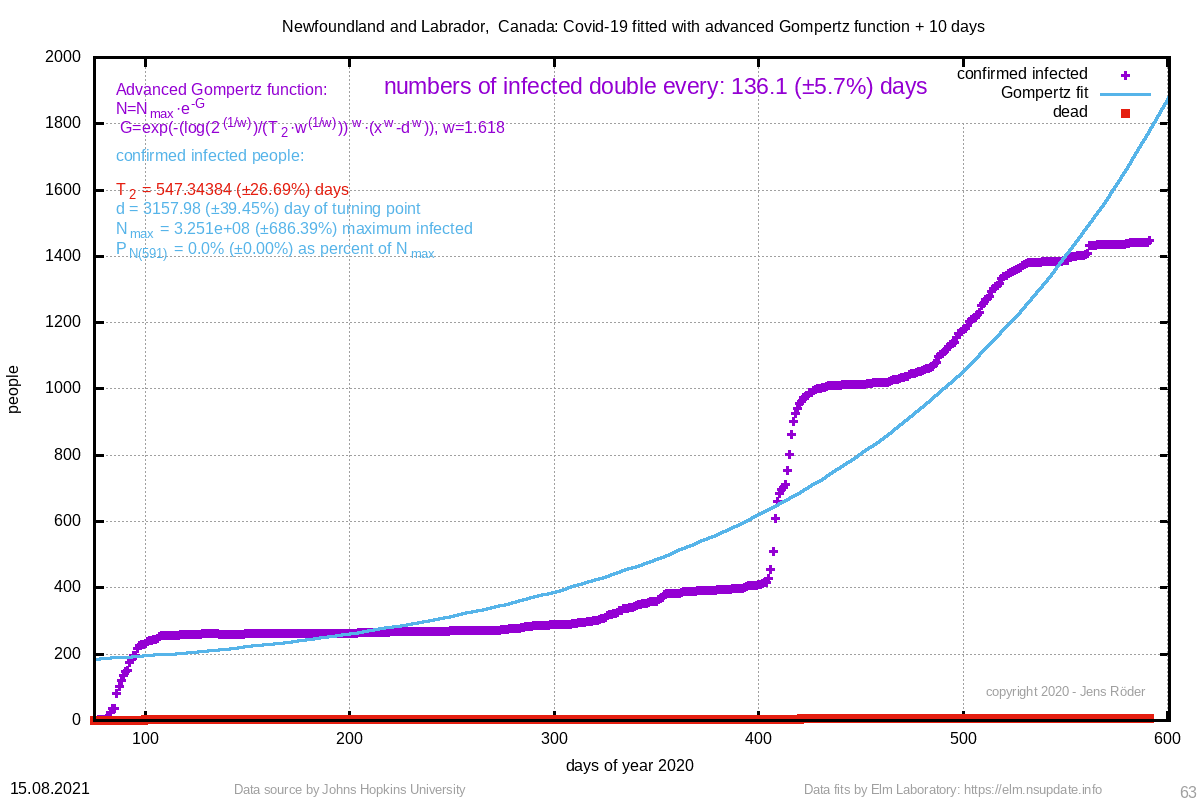 | 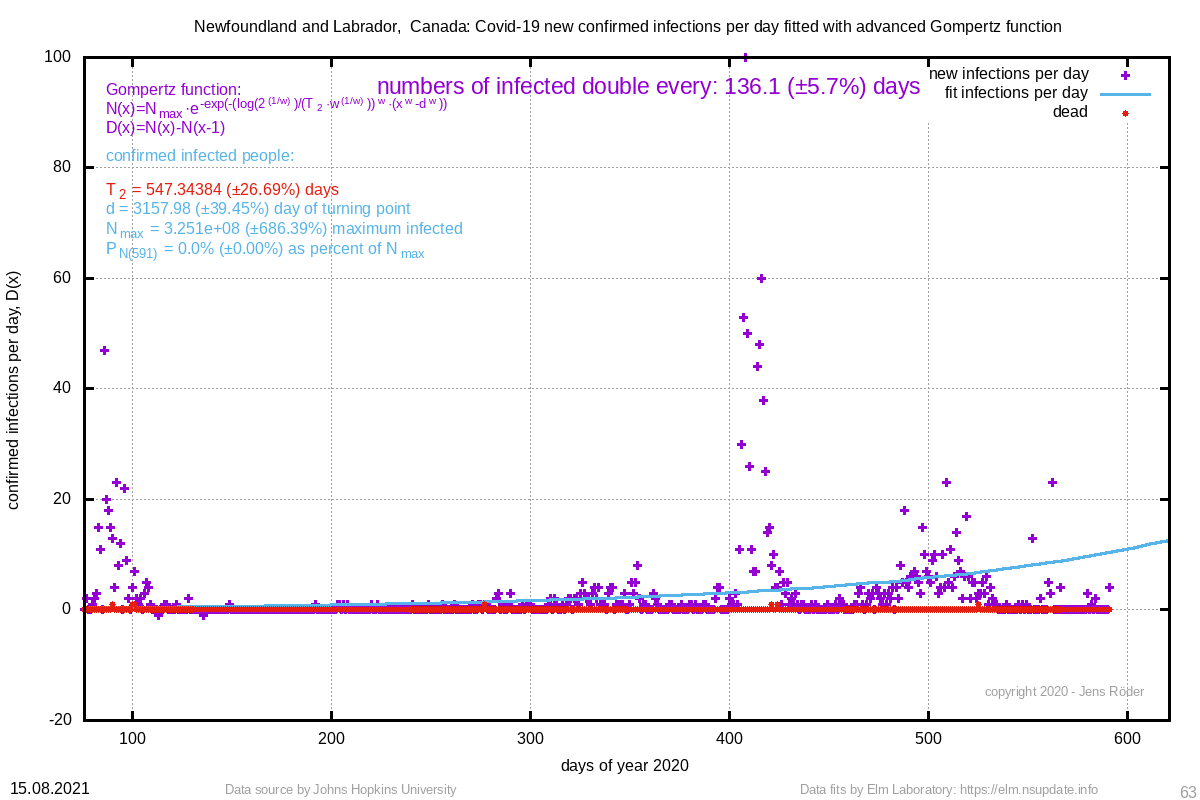 | 547.344 (±26.7%) | 3157.98 (±39.4%) |
| 1336 Saint Barthelemy, France | 6 (±1.4%) | 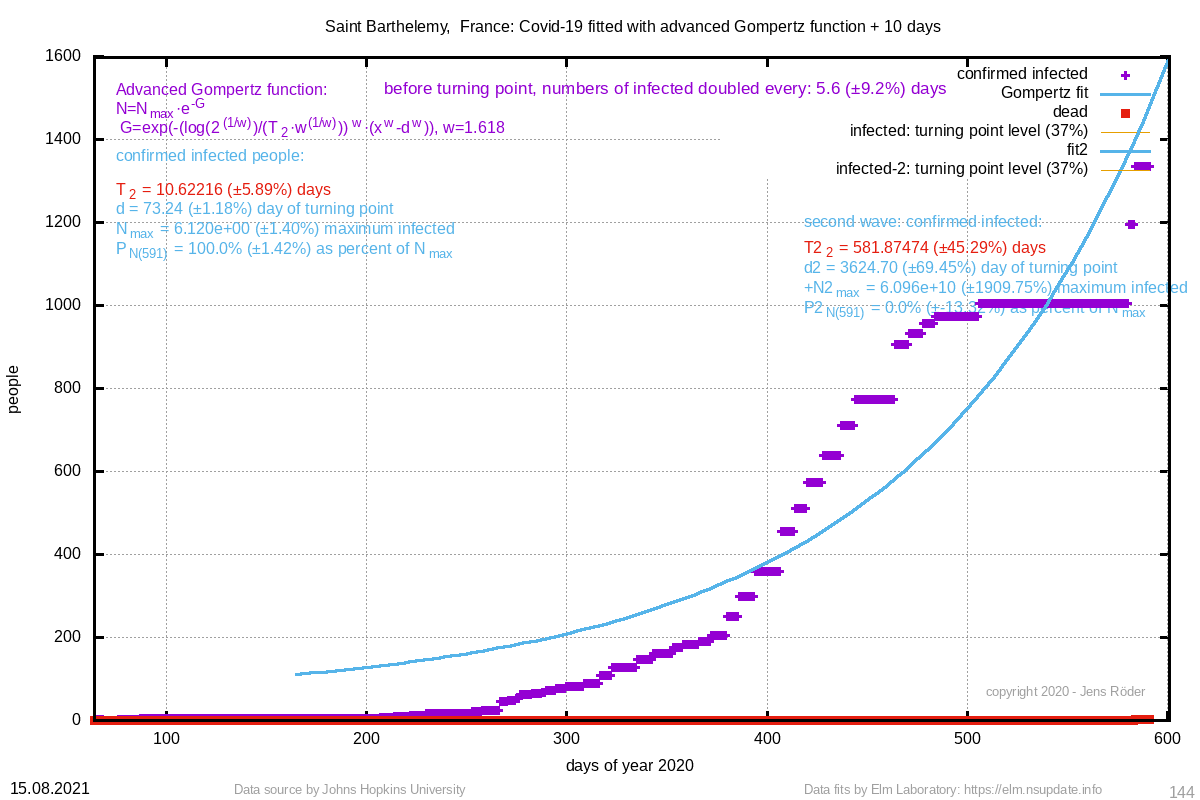 | 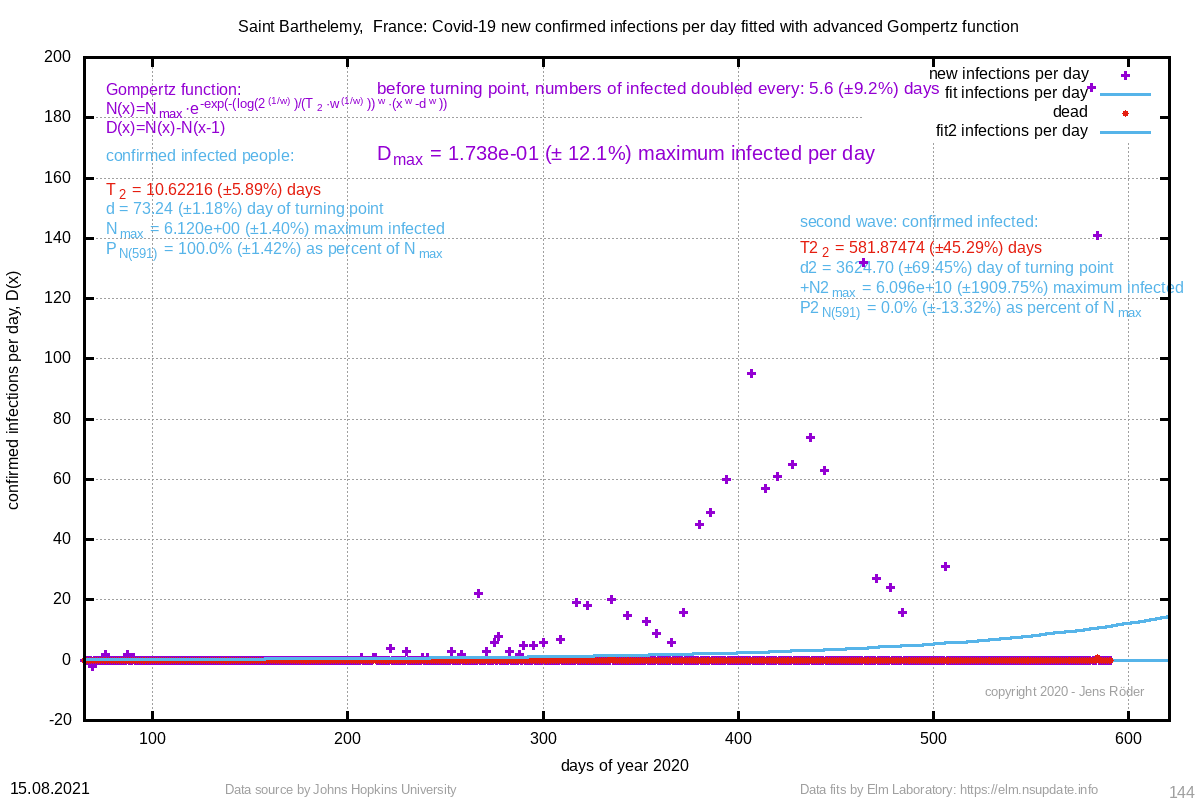 | 10.622 (±5.9%) | 73.24 (±1.2%) |
| 1178 Sichuan, China | 6670815194 (±2570.1%) |  | 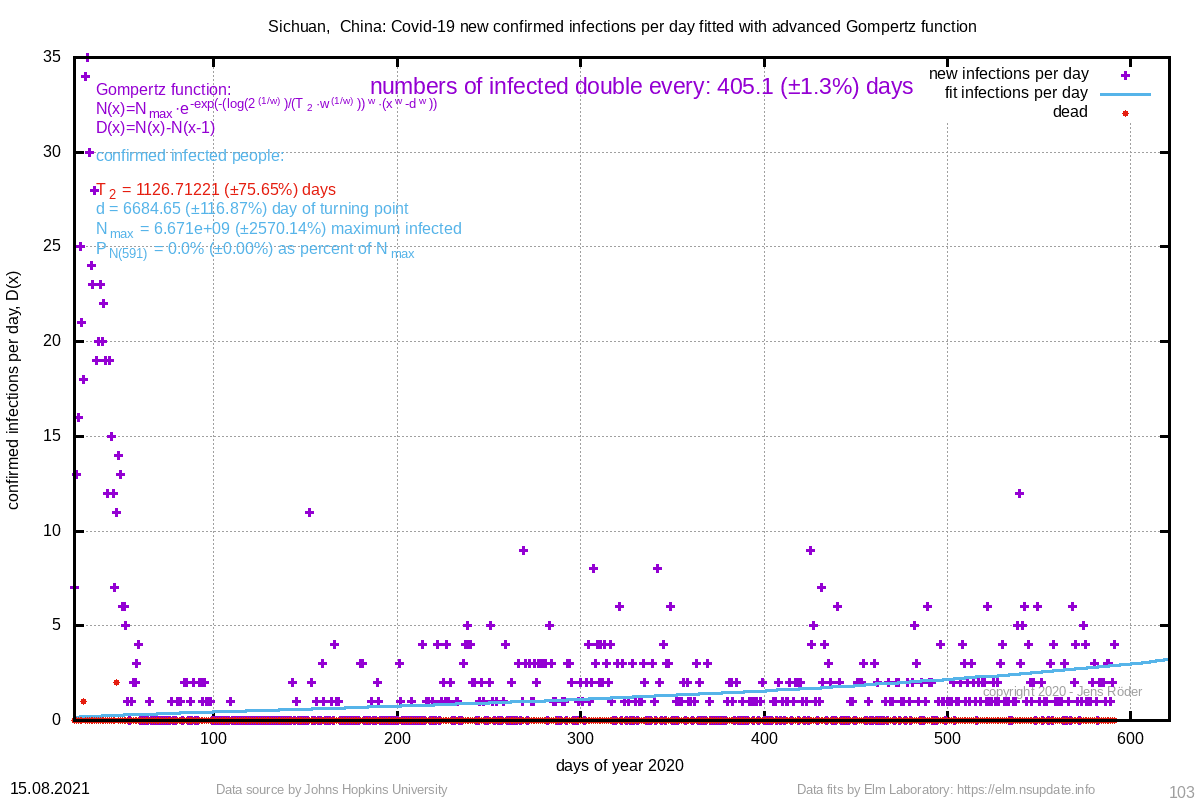 | 1126.712 (±75.7%) | 6684.65 (±116.9%) |
| 1059 Western Australia, Australia | 1026 (±1.0%) | 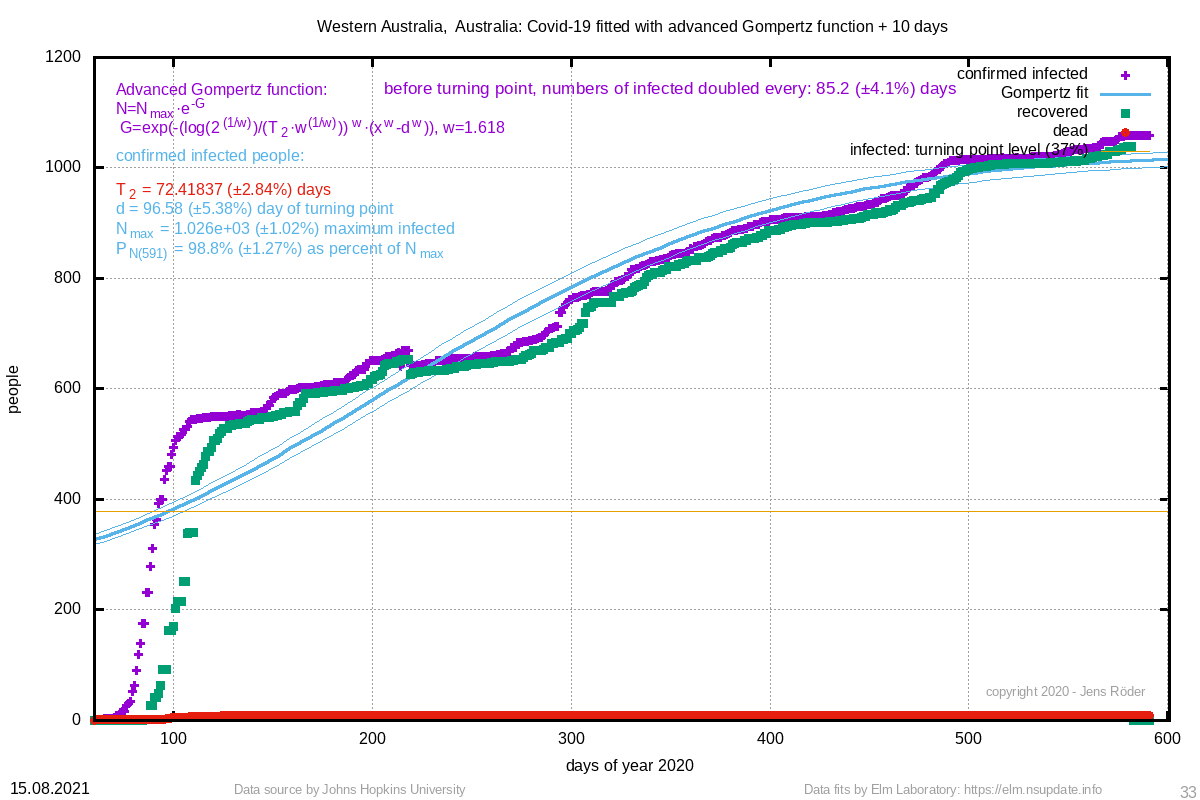 | 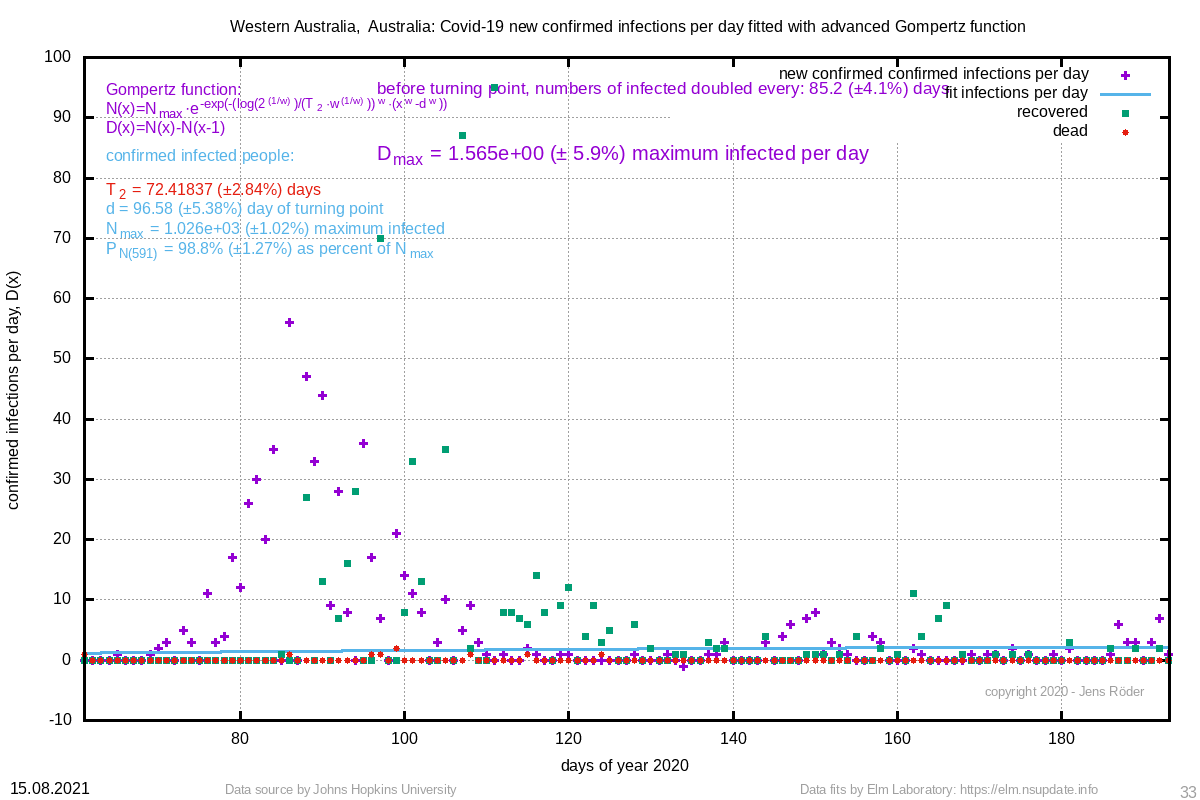 | 72.418 (±2.8%) | 96.58 (±5.4%) |
| 1008 Anhui, China | 995 (±0.0%) | 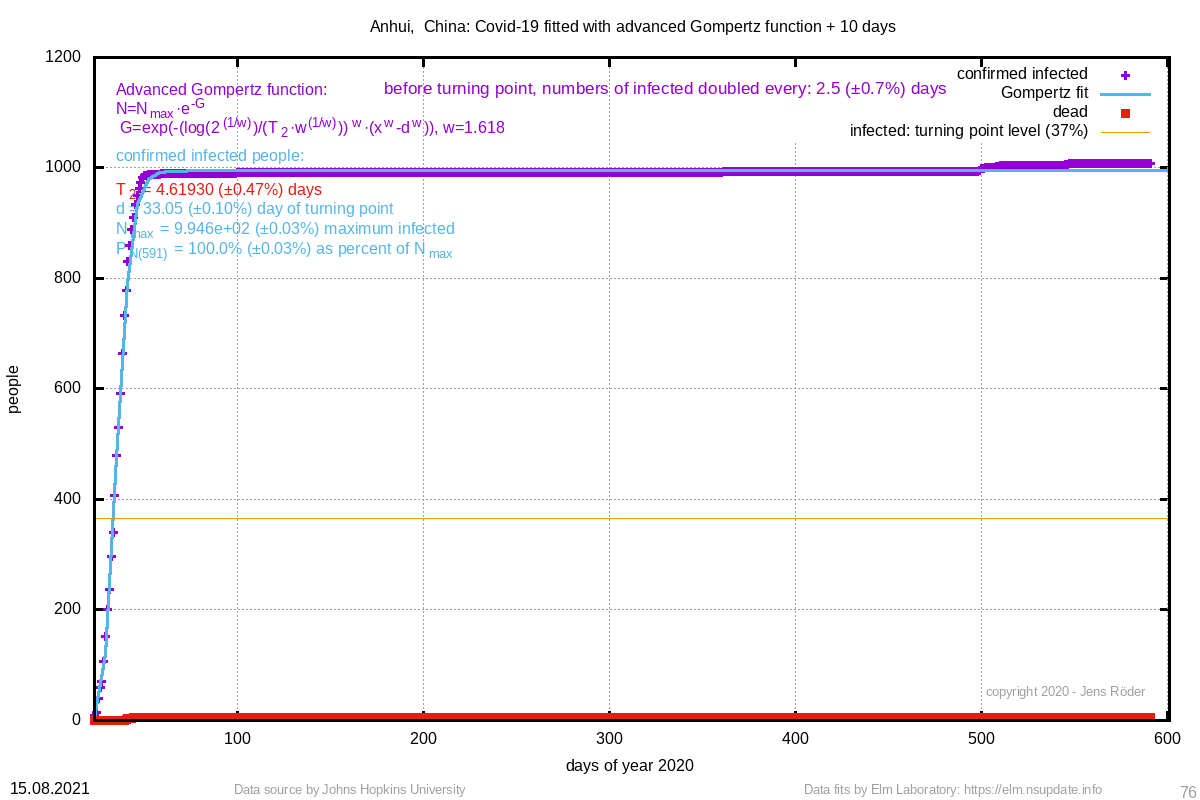 | 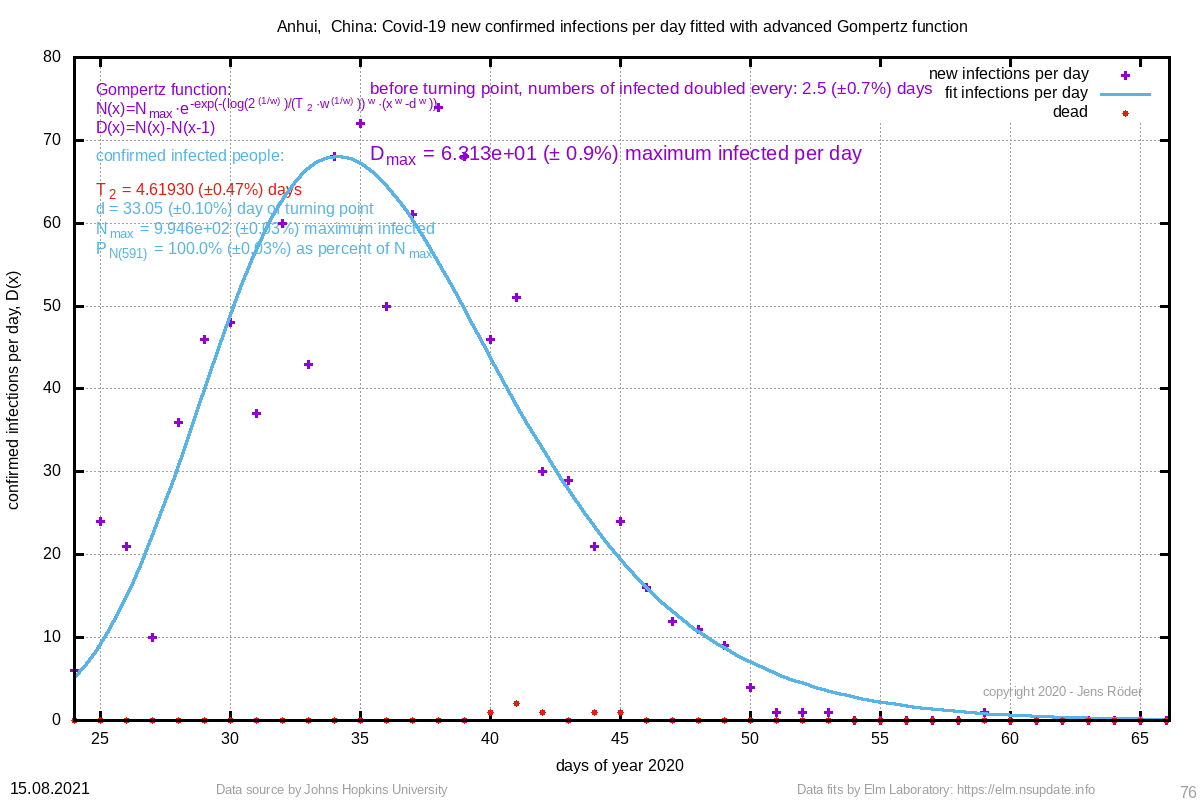 | 4.619 (±0.5%) | 33.05 (±0.1%) |
| 991 Faroe Islands, Denmark | 4095308995 (±1993.6%) | 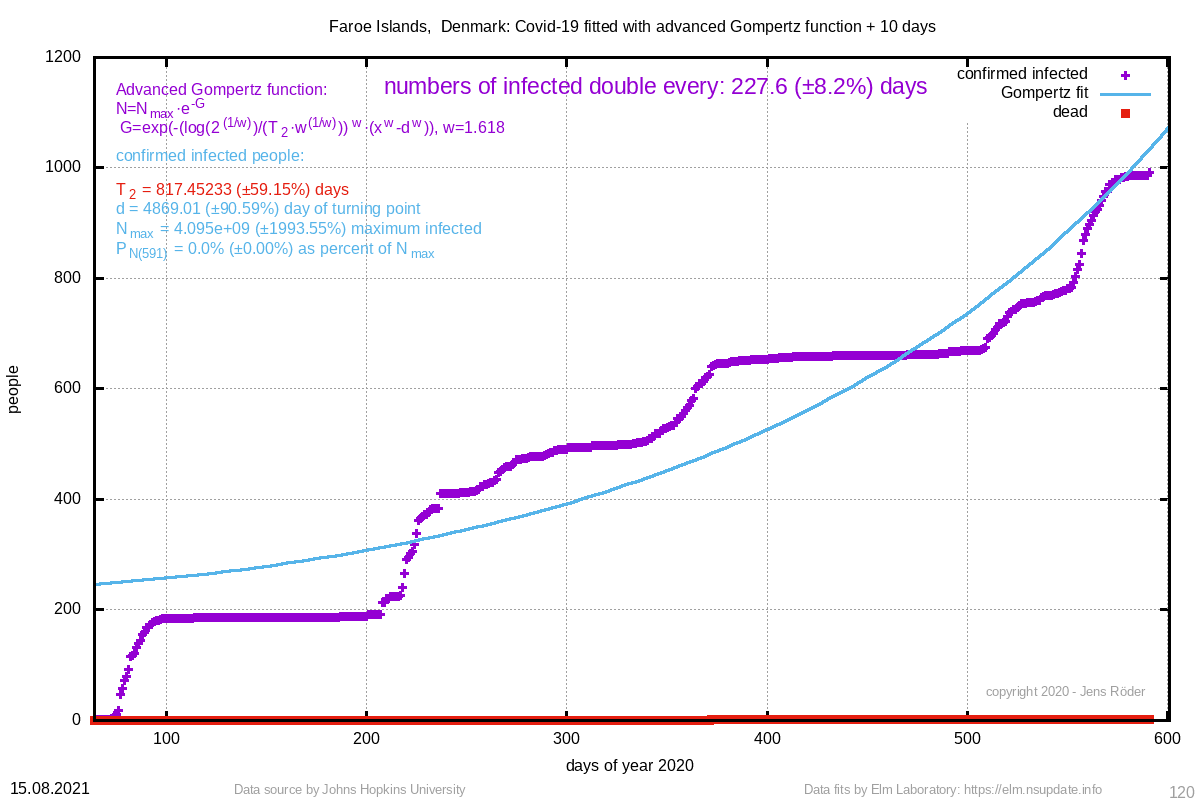 | 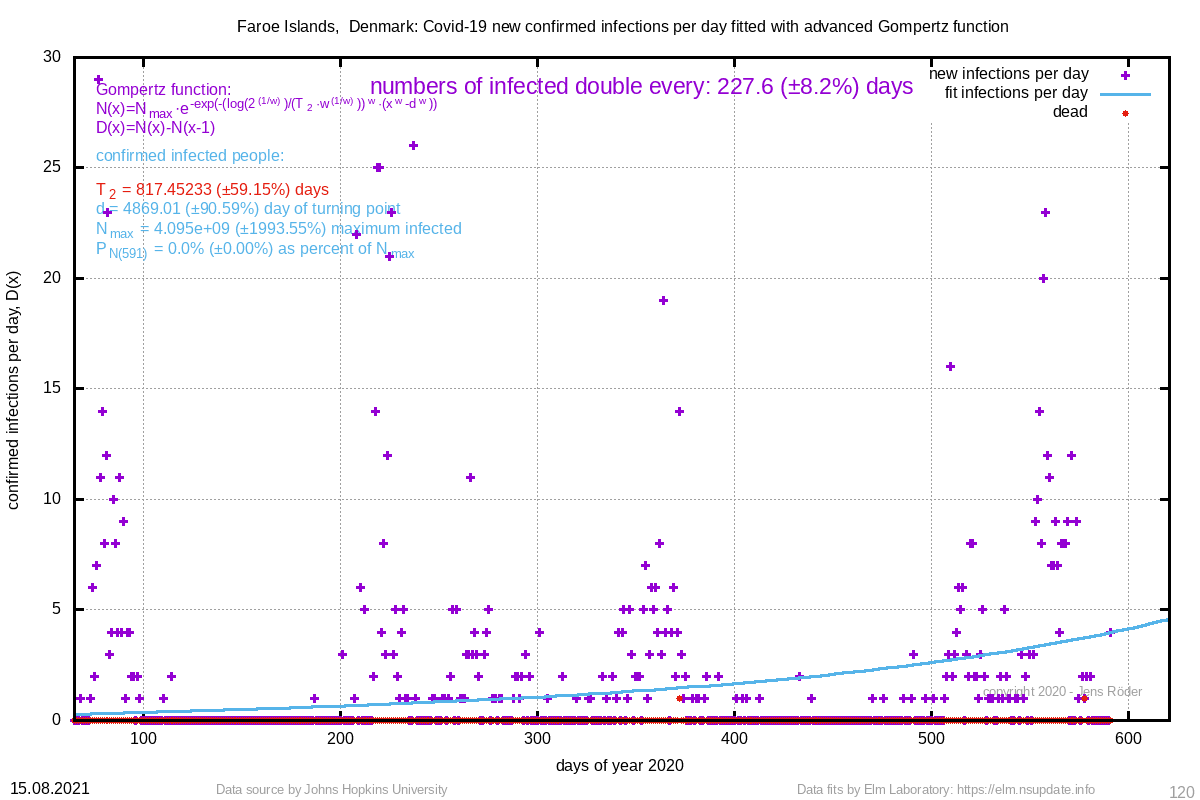 | 817.452 (±59.2%) | 4869.01 (±90.6%) |
| 657 Nunavut, Canada | 831 (±3.2%) | 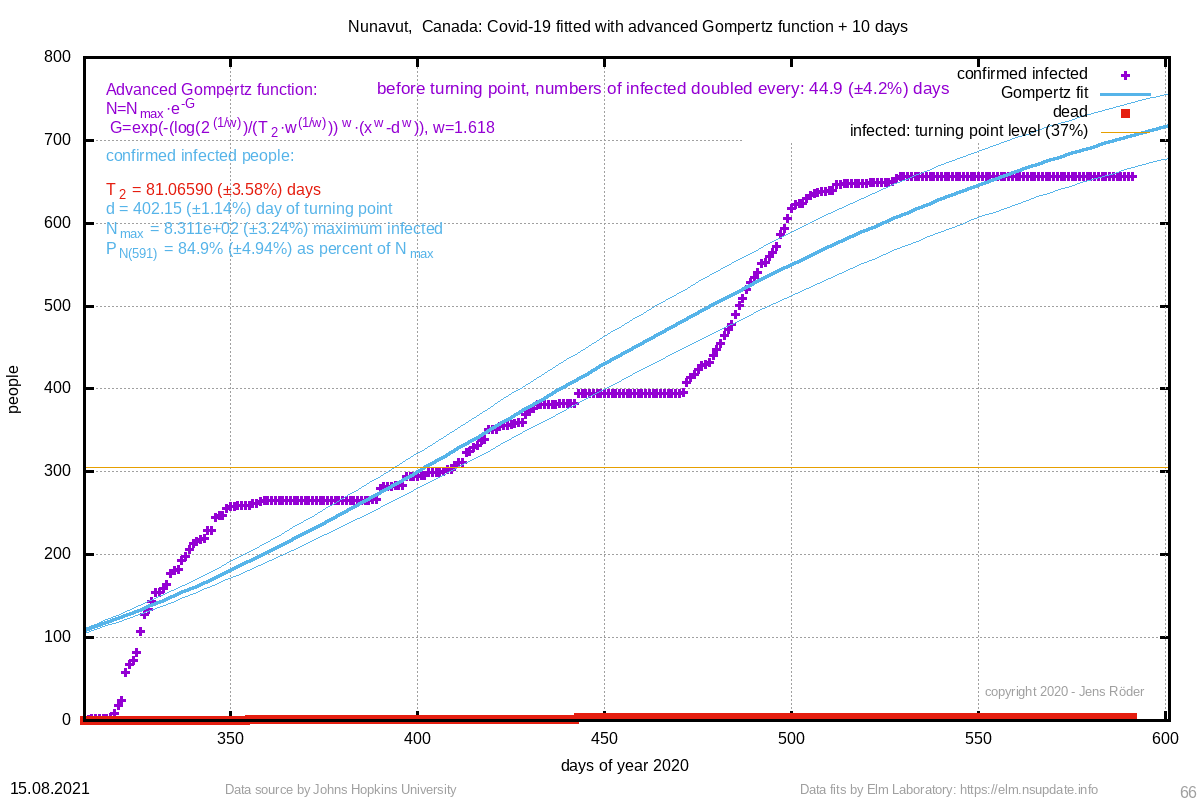 | 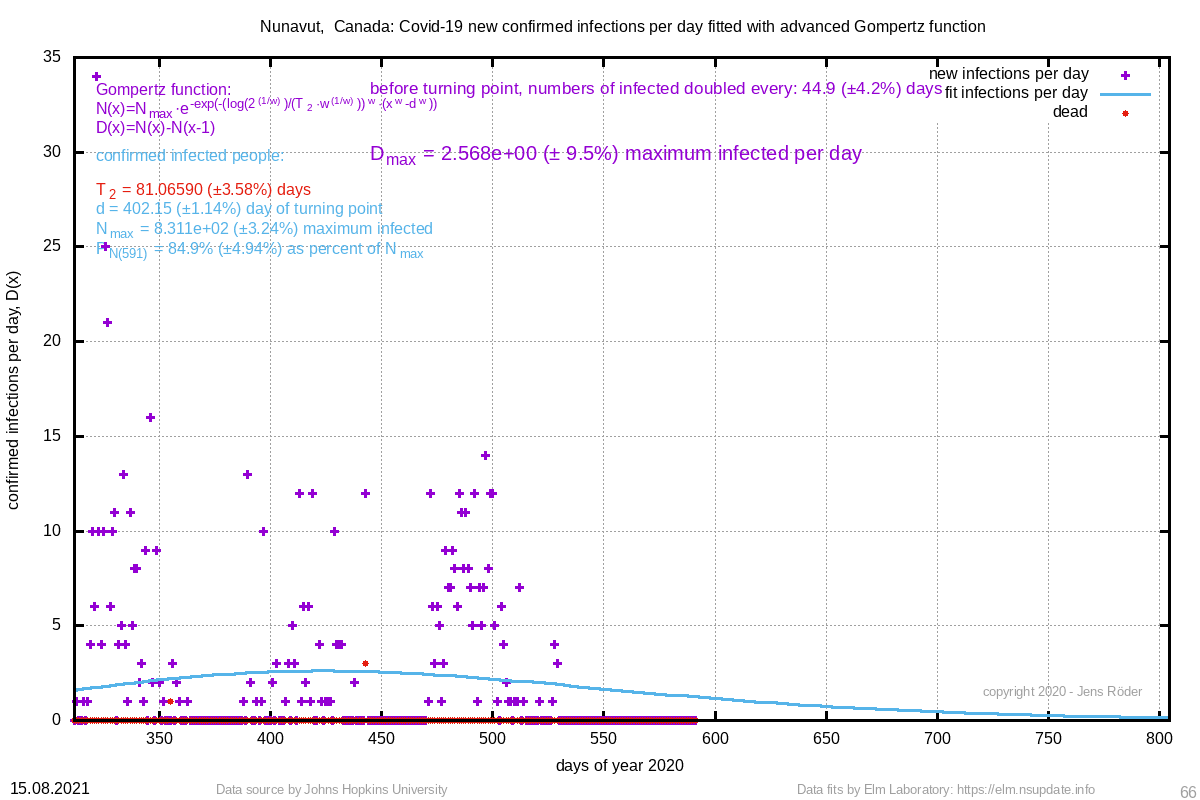 | 81.066 (±3.6%) | 402.15 (±1.1%) |
| 647 Yukon, Canada | 11 (±0.5%) |  | 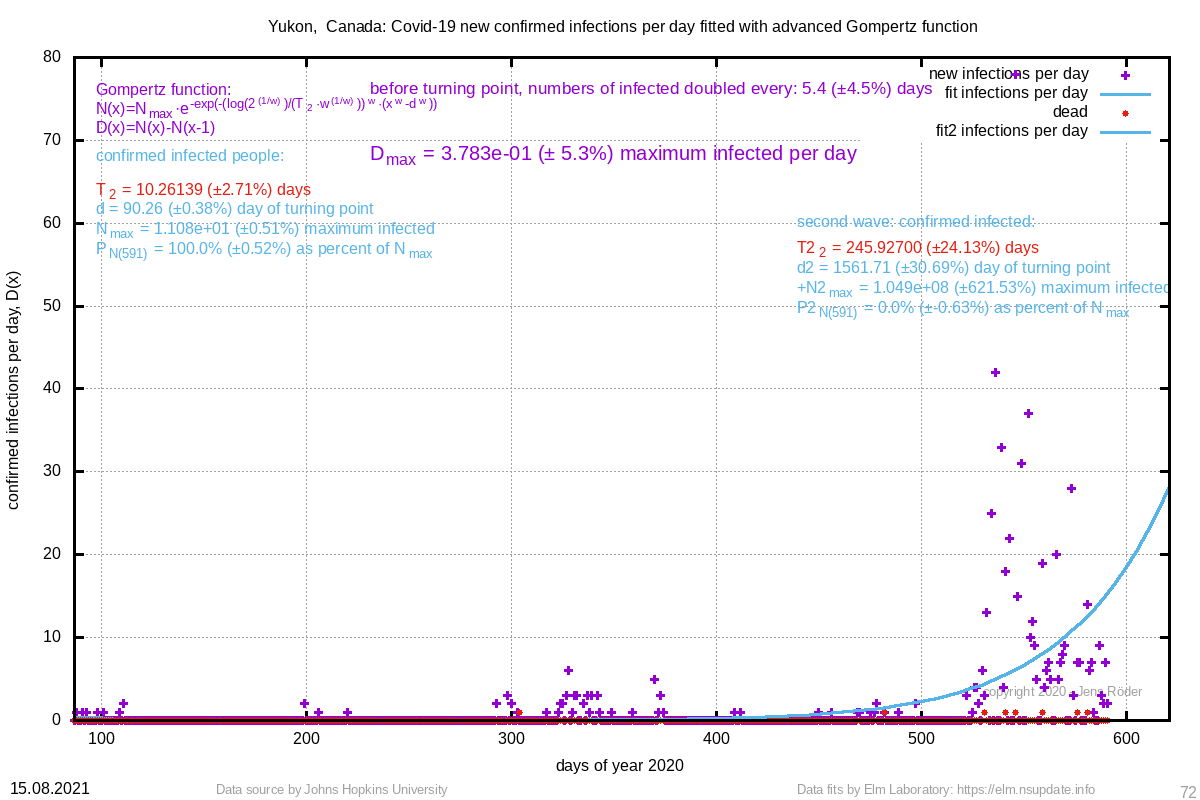 | 10.261 (±2.7%) | 90.26 (±0.4%) |
| 598 Brunei | 795029 (±895.1%) |  | 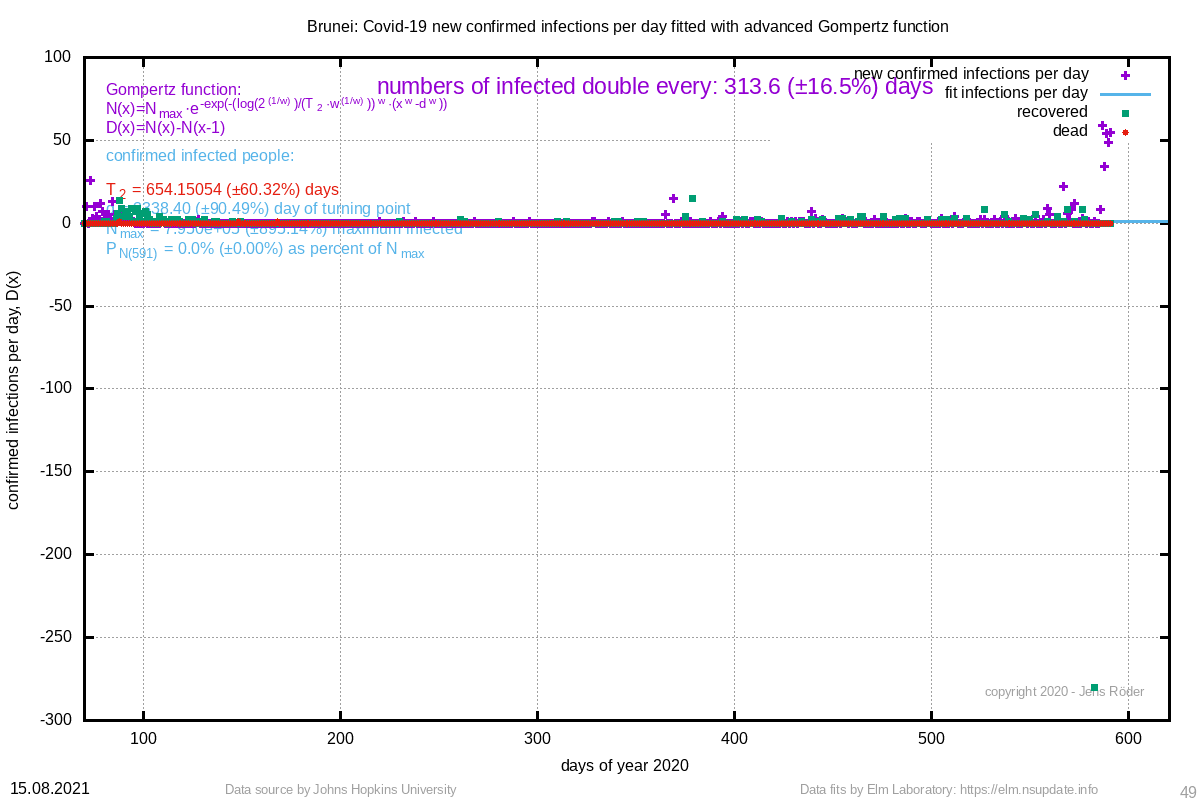 | 654.151 (±60.3%) | 3338.40 (±90.5%) |
| 440 Liaoning, China | 457 (±0.8%) |  | 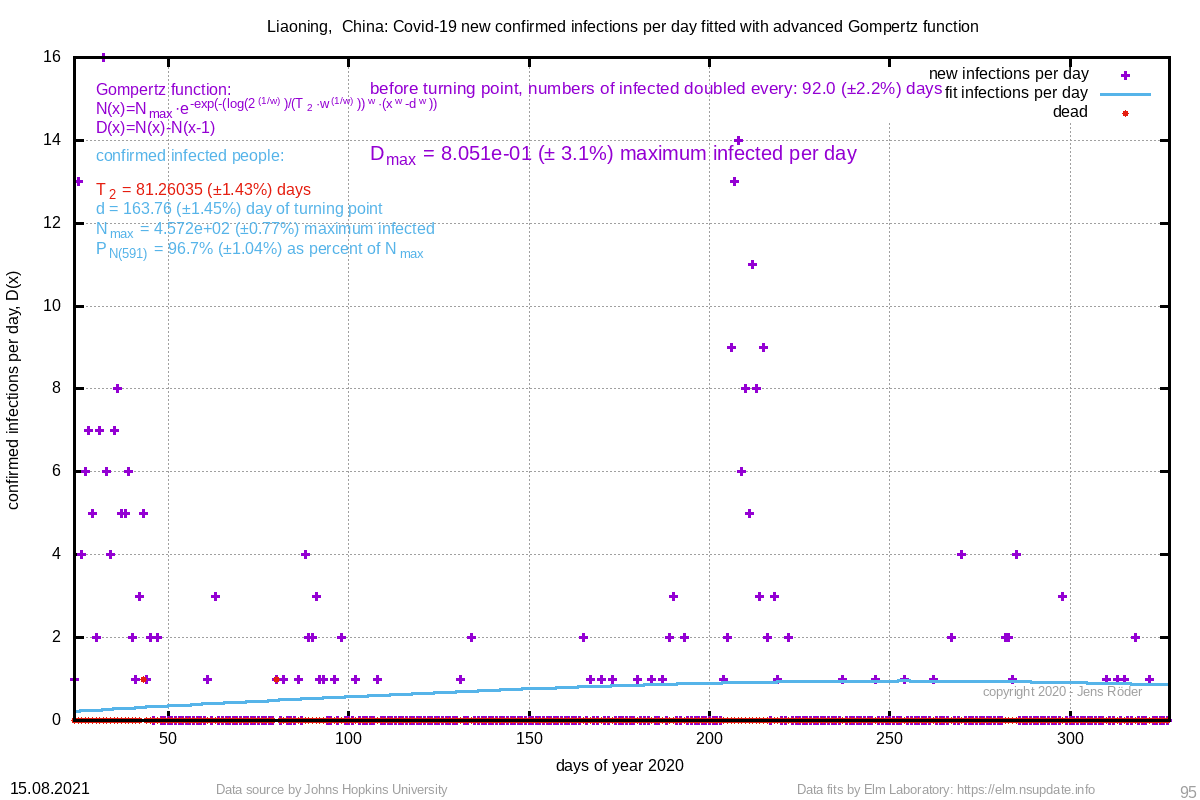 | 81.260 (±1.4%) | 163.76 (±1.4%) |
| 410 Inner Mongolia, China | 387 (±0.6%) | 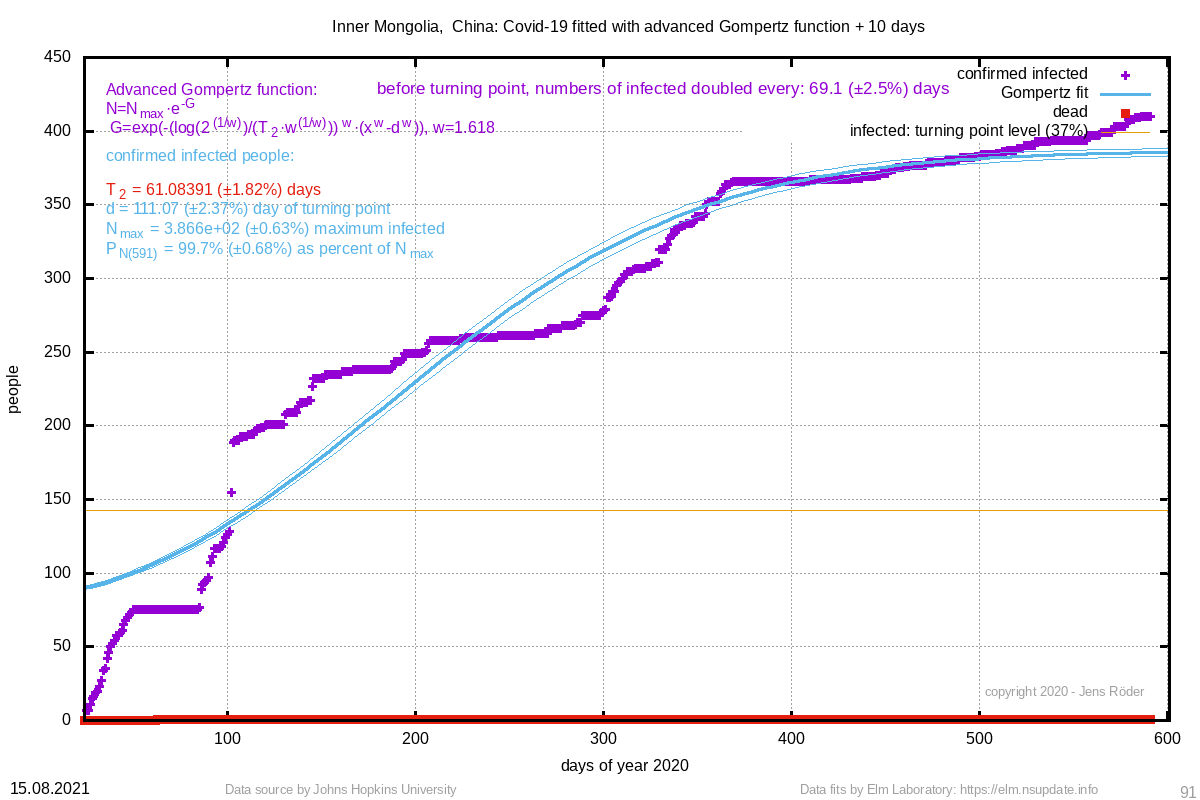 | 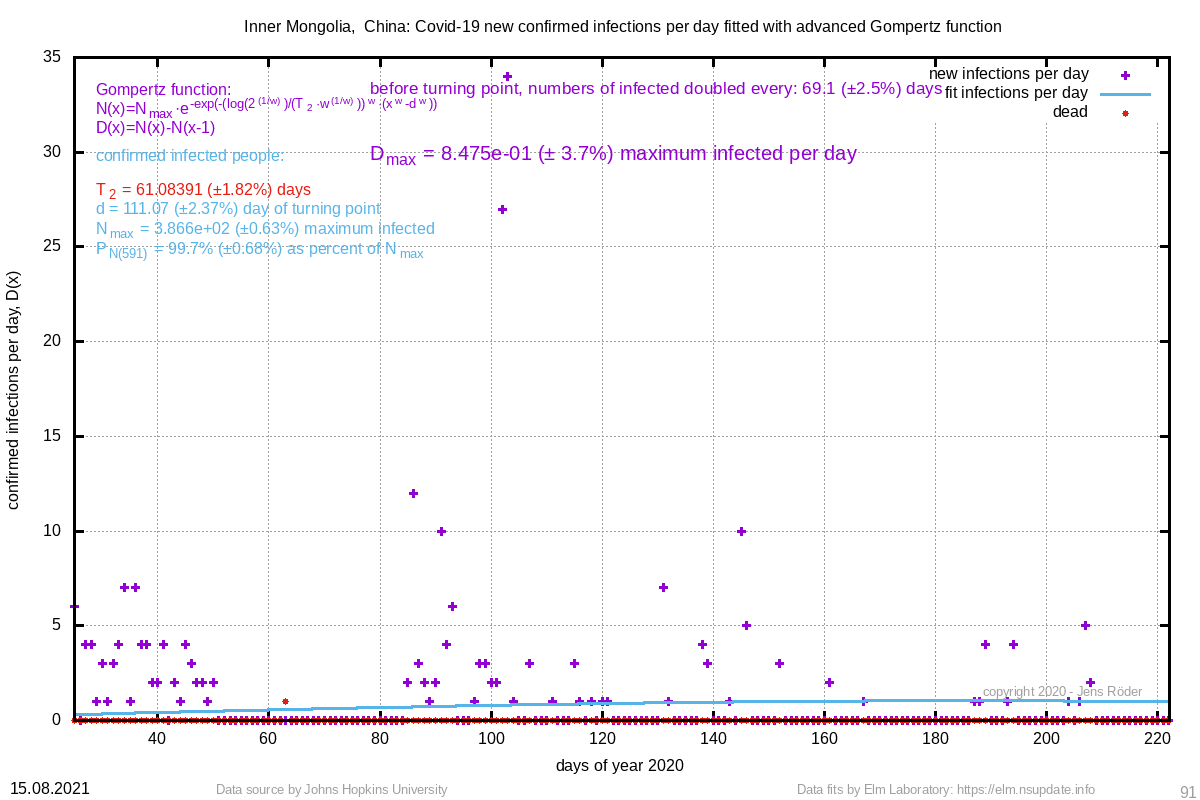 | 61.084 (±1.8%) | 111.07 (±2.4%) |
| 287 Guangxi, China | 263 (±0.1%) | 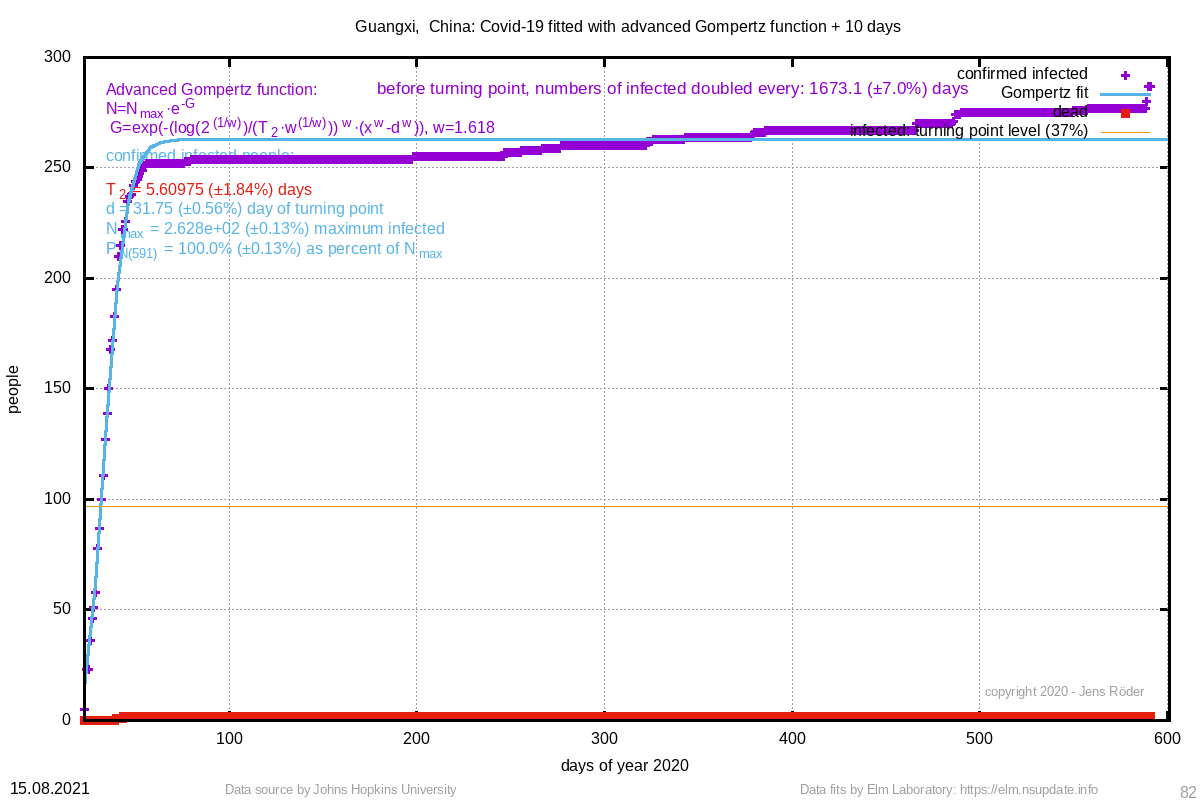 | 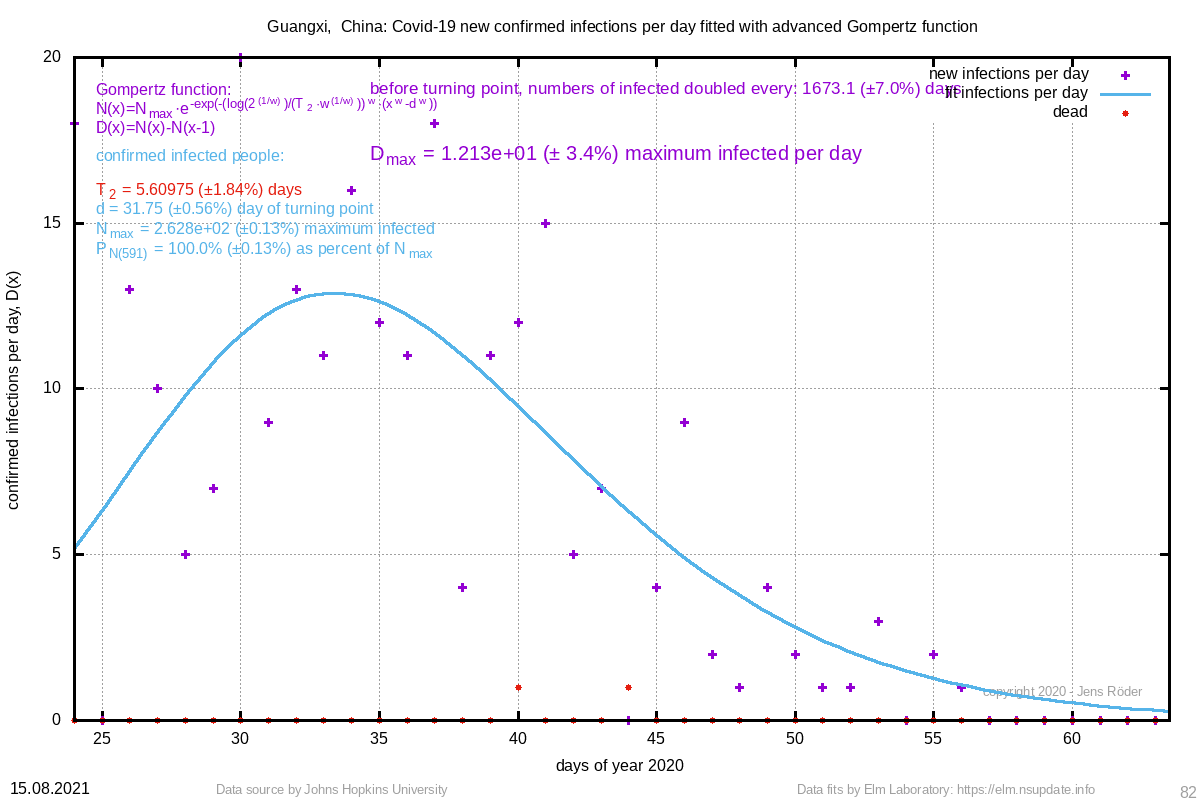 | 5.610 (±1.8%) | 31.75 (±0.6%) |
| 235 Tasmania, Australia | 232 (±0.1%) | 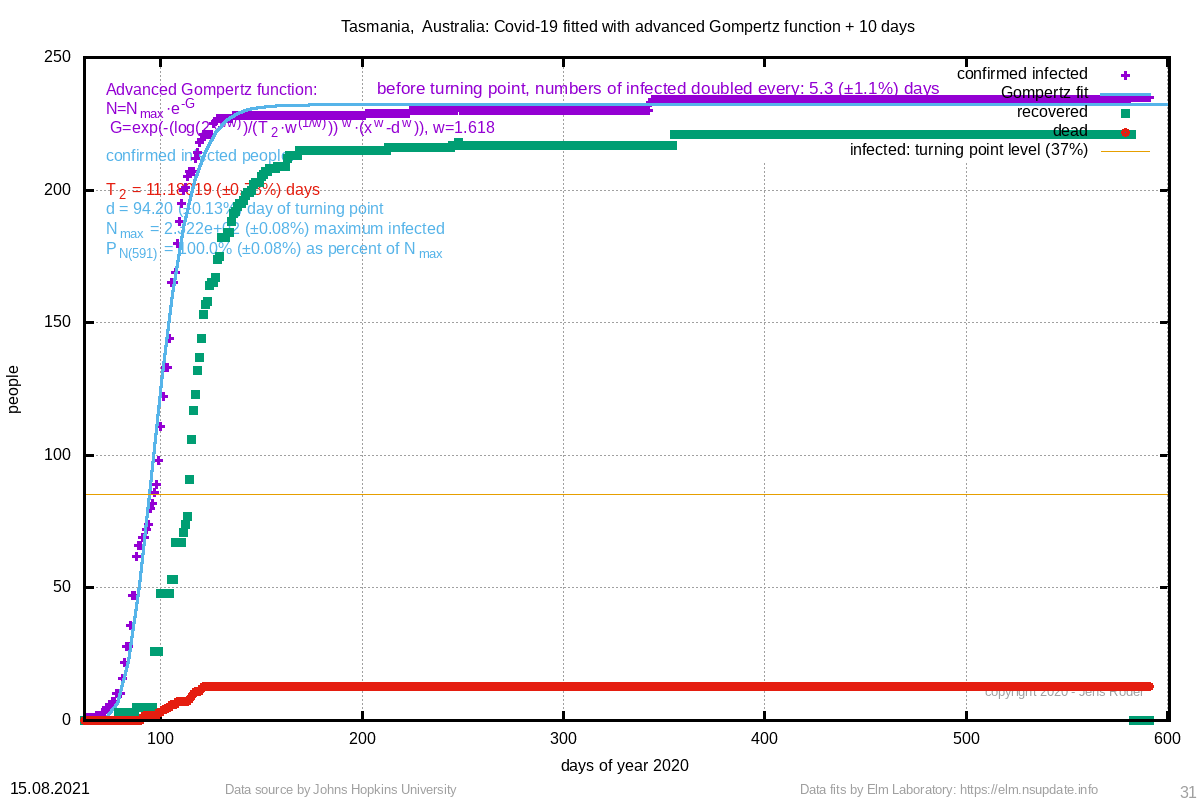 |  | 11.180 (±0.8%) | 94.20 (±0.1%) |
| 200 Northern Territory, Australia | 448 (±6.4%) | 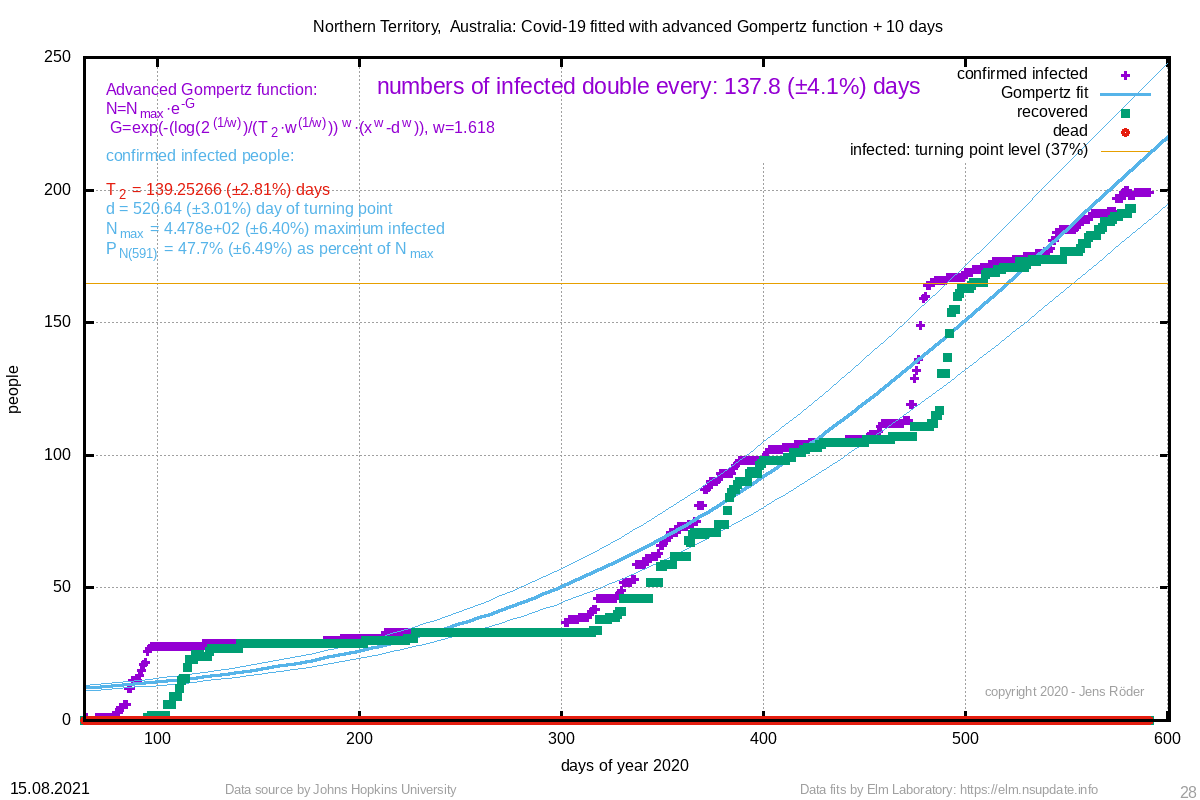 | 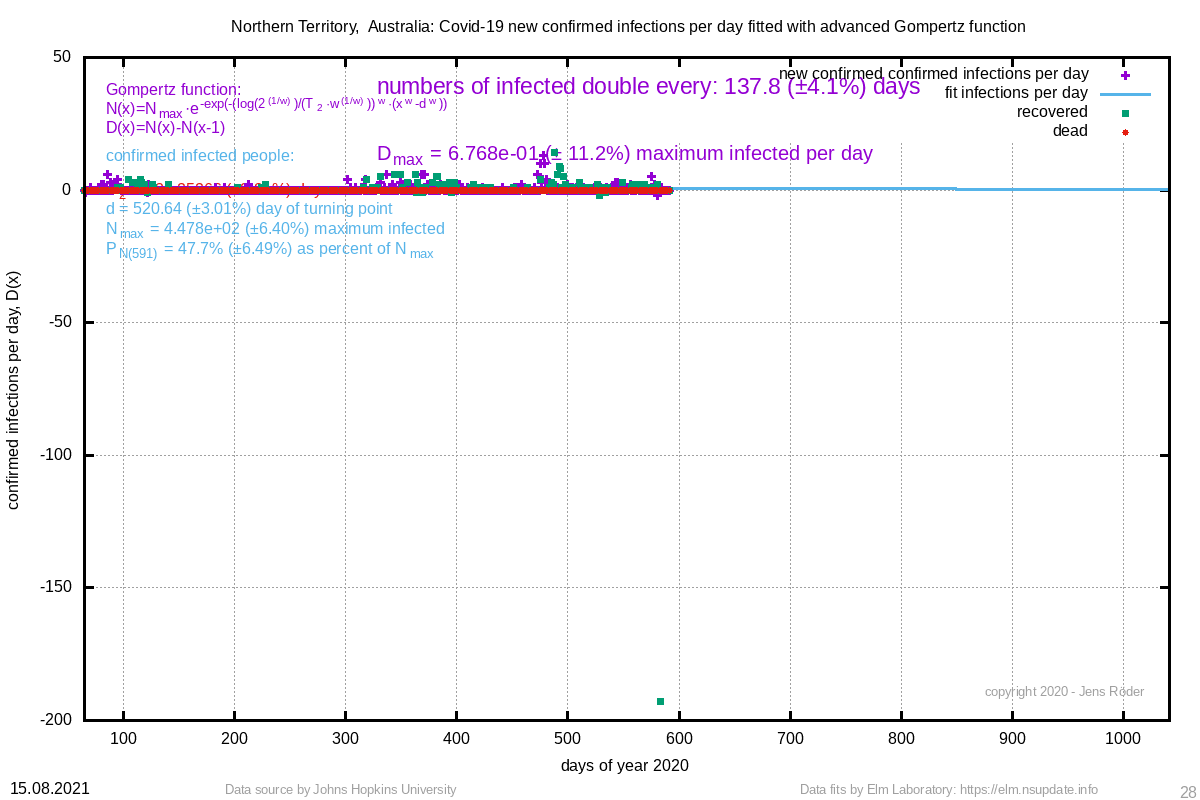 | 139.253 (±2.8%) | 520.64 (±3.0%) |
| 147 Guizhou, China | 147 (±0.0%) | 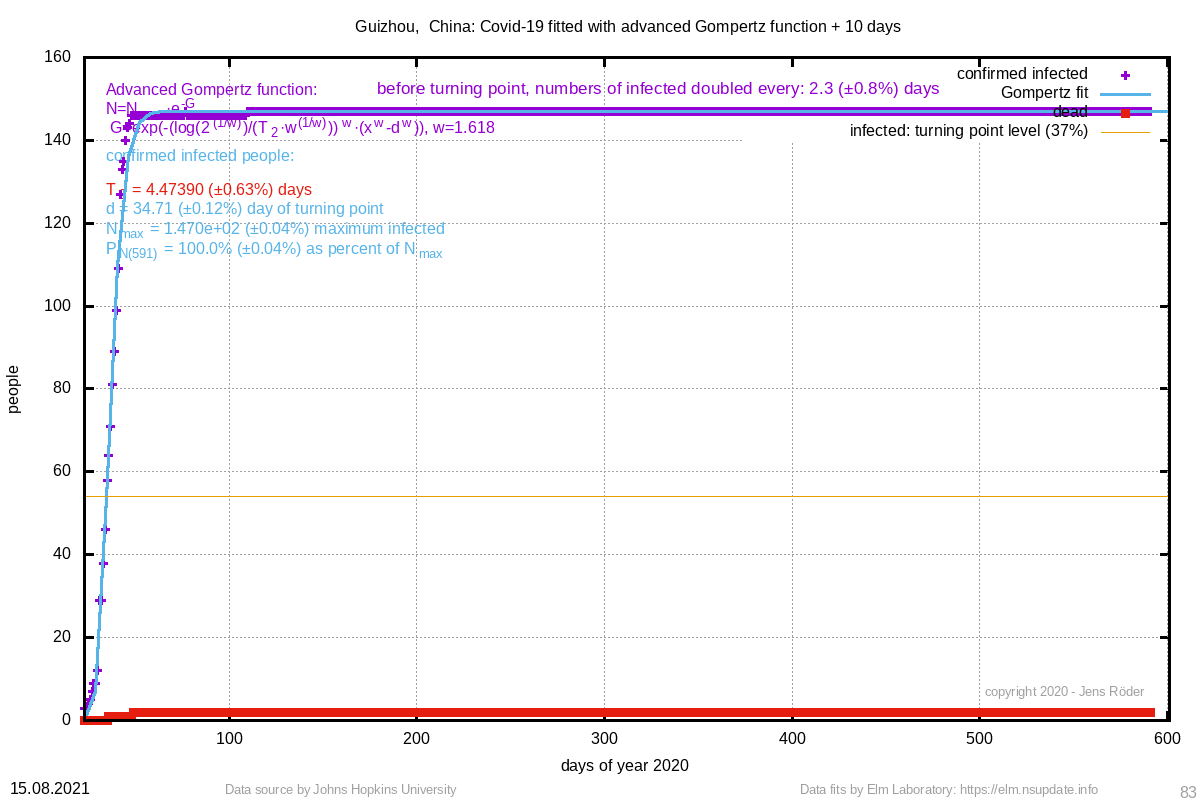 | 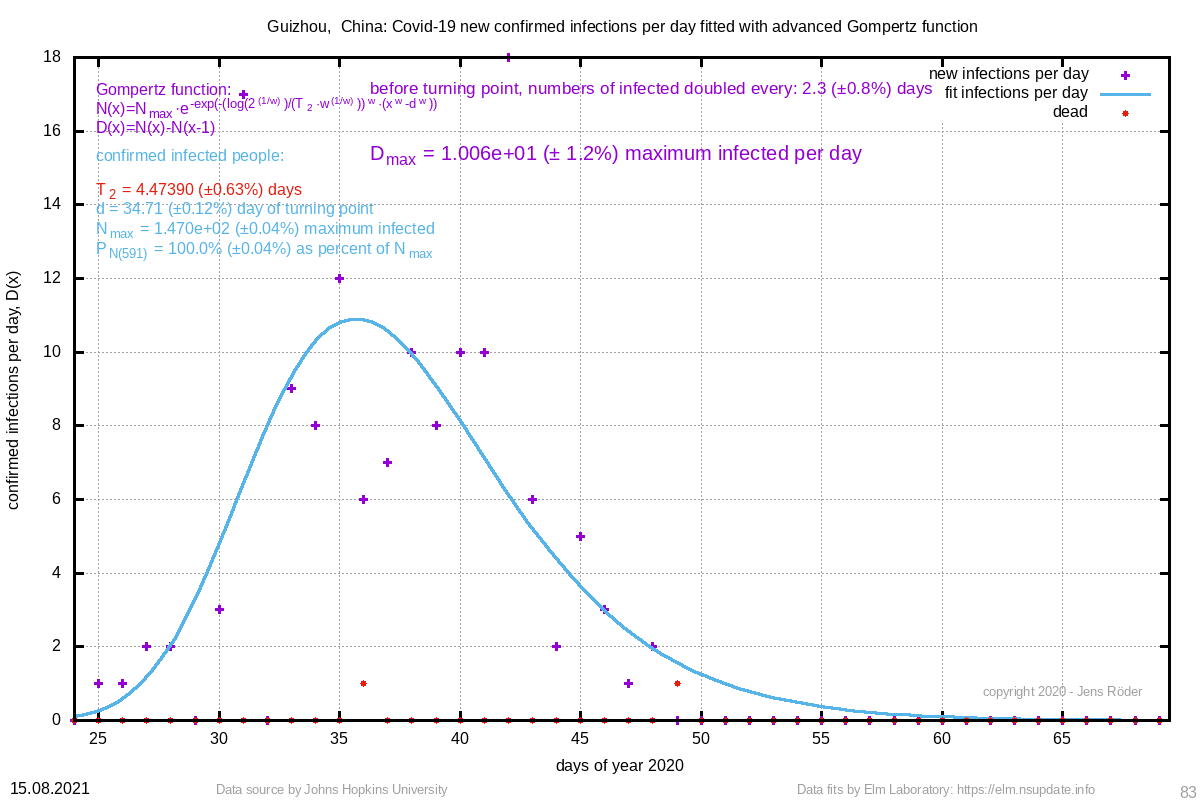 | 4.474 (±0.6%) | 34.71 (±0.1%) |
| 131 Australian Capital Territory, Australia | 117 (±0.2%) |  |  | 7.992 (±3.0%) | 85.08 (±0.3%) |
| 63 Macau, China | 48 (±0.4%) | 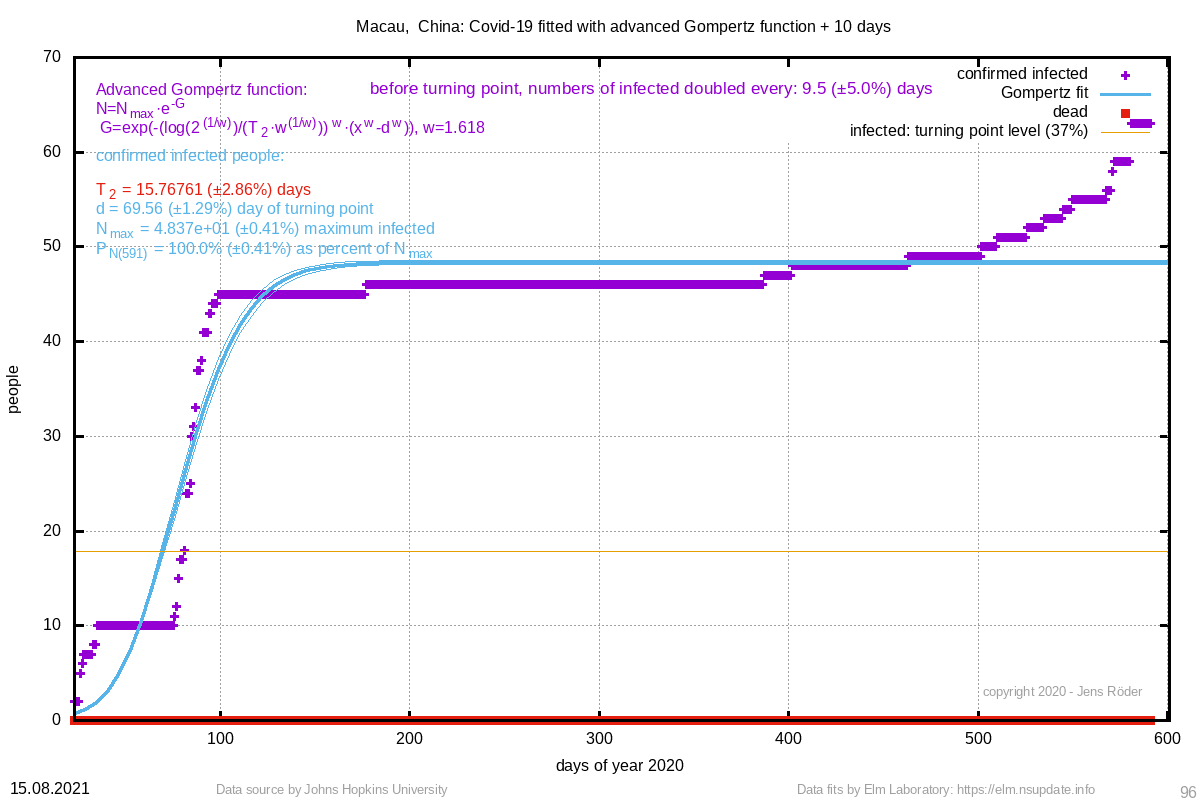 | 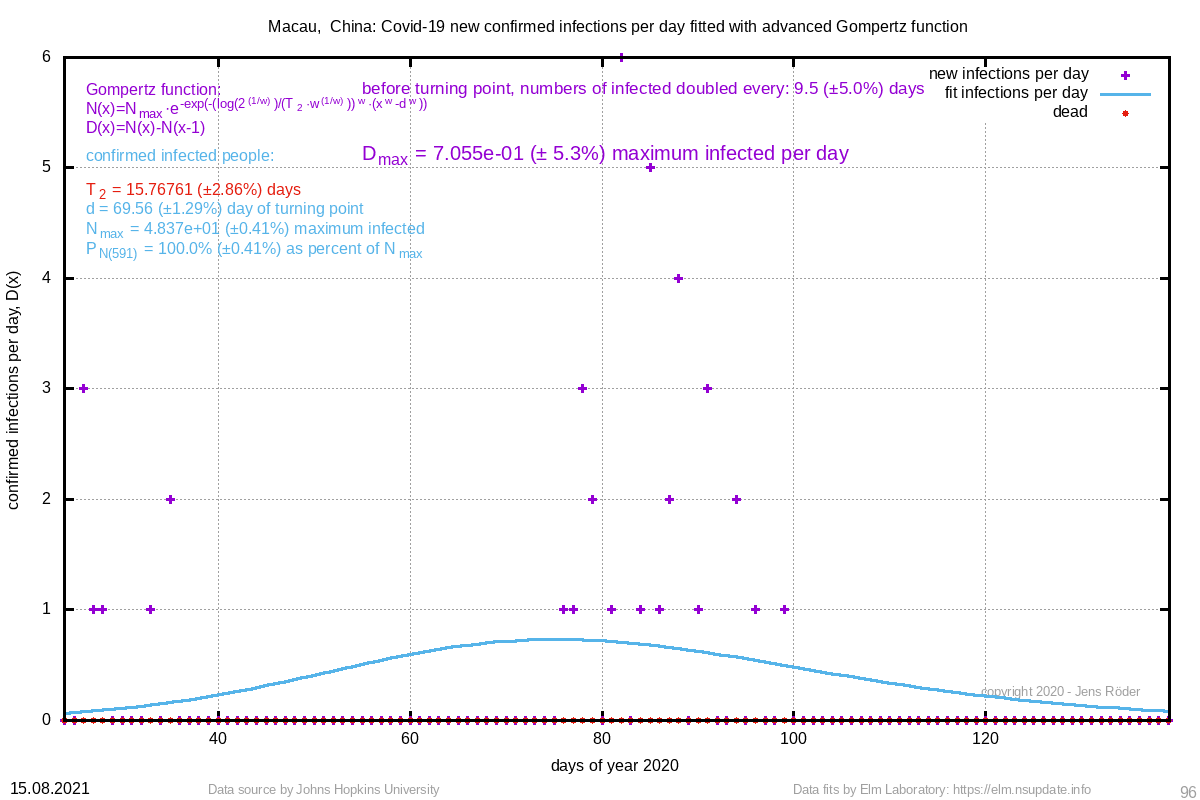 | 15.768 (±2.9%) | 69.56 (±1.3%) |
For countries in this list, the number of infected people must be at minimum 13 people. In the list of numbers of a country, there must be at least 7 different numbers. The turning point is guessed by using half the maximum number and then looks for the first value above that value. If the turning point is at the last value, the fit is omitted.
Locations or countries with not enough data points or other reasons are skipped and can be found in this list.