
Covid-19 death rate
death rate, mortality rate, and case fatality rate

Covid-19 and death rates
In the media there are many discussion about the danger of SARS-CoV-2 causing the Covid-19 or corona virus disease 2019. There is an on-going discussion of the death rate. Some people claim that there were more deaths in a year by influenza than by SARS-CoV-2. Other say that virus has the potential to overrun out hospital system with patients. Who is right?
Clearing the names
Mortality rate (M) is calculated by the number of deaths in the total population for a given time interval:
Case fatality rate (F) is calculated the same way, just looks at the numbers per infected people.
The death rate is sometimes used for either or the other term and is not that specific. And here we have the reason for the confusion, when we compare apples with pears. But just before that we need know another term morbidity, which is the number of infected per population at a given time interval.
The time intervals can be omitted, when we have a non reoccurring epidemic, of which we observe after the complete end.
Please be aware, that by this method, correct numbers can only be obtained at the end of the epidemic!
Resolving the riddle
It is true, the mortality rate of SARS-Co-2 is at this moment (April 1st 2020) statistically neglectable small compared to the estimates we have from ordinary influenza. Most of the influenza data are just statistically calculated with high numbers rather than actually measured.
However, the case fatality rate of SARS-Co-2, what we have from the data right now, is significant higher than of influenza. We can use the case fatality rate to estimate, how high the mortality rate might be, when a majority gets infected. Therefore, there is a concern that when large numbers of people get infected, the number of deaths will exceed those of influenza.
Especially, as the time interval, when the total number of infected people doubles, (doubling time) is rather small, there is a concern that hospital capacities will be overrun and we might not be able to properly help people.
Your support will help us working on new data analyis on Covid-19 for you:

(by click on image you accept third party cookies, required by paypal.)
The call for an ISO-Standard for epidemiological data
There are several reasons, why we have problems, calculating a proper case fatality rate. The most astonishing point in our modern digital world is, we have no uniformly collected data. Everyone is starting to count data in different categories. This differs from country to country and from organisation to organisation. Even worse, categories are changing during an epidemic too, even several times. For statistics this means, they become rather worthless and crucial information is just lost. There are even no standardised data formats to exchange the data. It is rather a big mess.
What we need is a simple iso-standard that defines the most important categories and a defined way to count them. Provide centralised data base with an app for doctors to report going through the simple questions in a few seconds. Privacy is important and can only be provided at the beginning. Therefore, doctors only get a registration number for their report they write down in their personal patient documentation. So only doctors get registered and can be contacted, if required, but they provide the privacy filter. So a stolen database will be of no concern.
Statistical limitations we face
The underlying database maintained by Johns Hopkins University lists registered COVID-19 cases identified as such by a so-called PCR test. In countries with limited test capacity the latter may effectively limit the number of “infections per day” declared and thus falsify the input data. Hence a flattening of the rise is not necessarily real but could be an artifact from approaching a limited test capacity.
In all epidemics, we only are able to count by a verified method a fraction of the infected people. Some may even have no symptoms at all and seek for not testing nor help. Data can be twisted by political reasons, human errors or any other motivations. As long as we deal with humans, there will be a human uncertainty factor included.
Only, when we test all the people at the same time, we can get a more correct number. Nevertheless, the fraction we have counted properly may represent the total sufficiently.
Time correction in the case fatality rate calculation
When case fatality rates are calculated as described above and we used the data of
today, there is an intrinsic error in that method, because in most cases, there is a
time delay between diagnosis and death. We can see this beautifully in the data of
China:
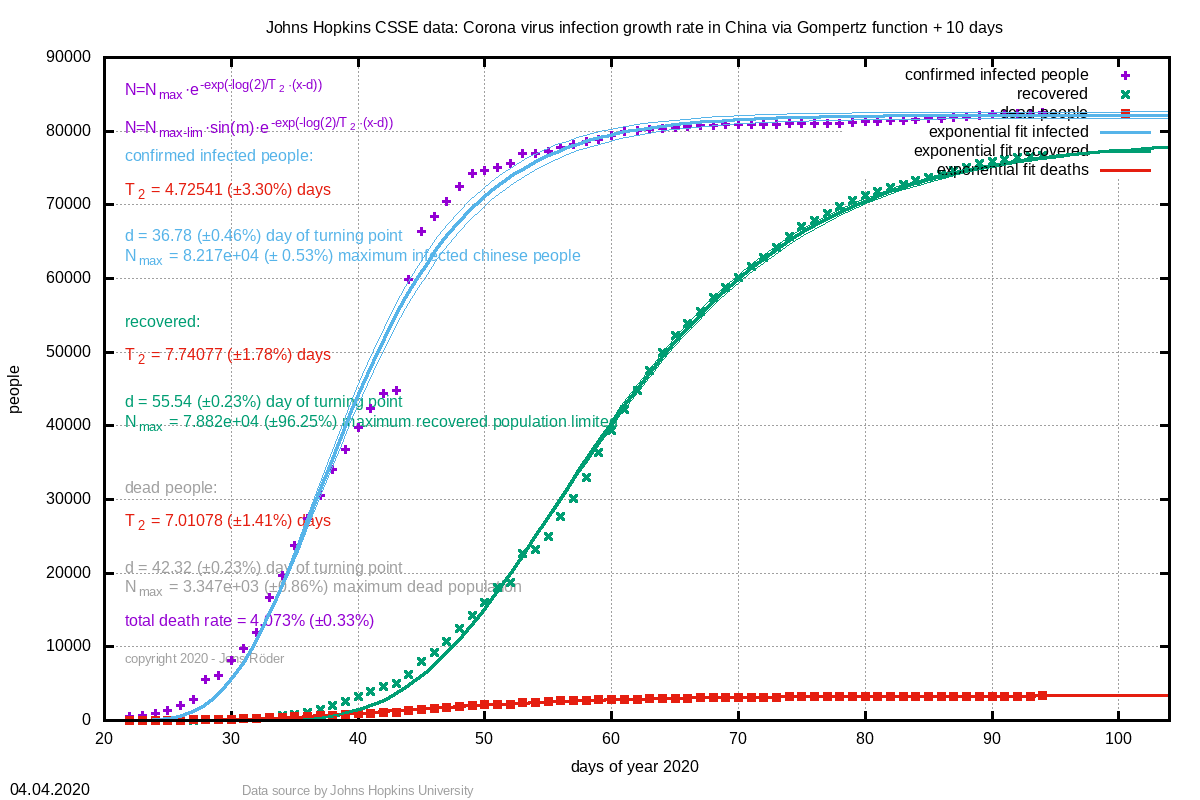
From these data, we can obtain a delay time of 5.54 days (± 0.7%) between diagnosis and death. If we ignore these delay in our calculation, the infection numbers are still exponentially exponentially, diluting our results. Therefore, we plot the case fatality rate with backwards infected numbers:
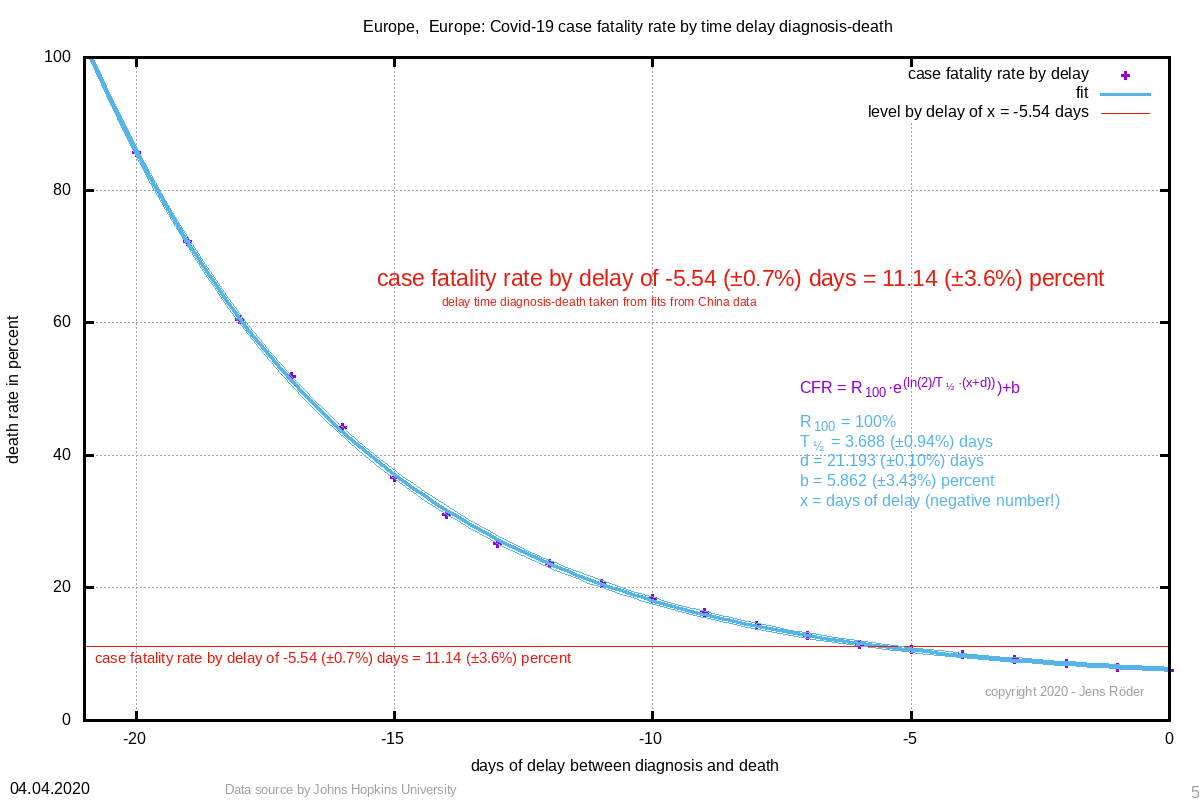
And of course we see again the exponential curve. This method is especially realiable in the beginning of a fast exponential rise. From hospitals we can obtain the delay time earlier than we can fit it from cumulative data as shown above and get a much more realistic estimate of the case fatality rate at an early stage. Simply set in the CFR formula for x the negative number of the delay time and obtain the rate.
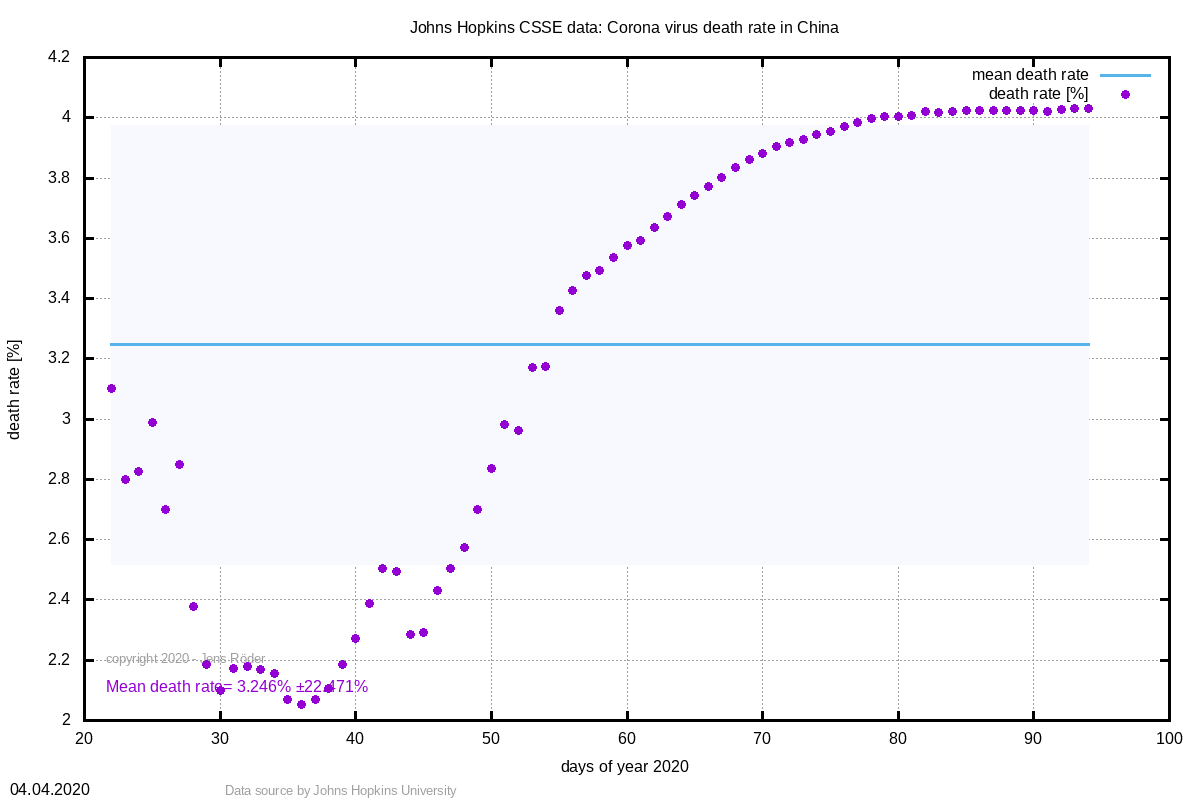
This method compensates the effect seen in this curve:
.·.