COVID-19 in Holt, Nebraska
Covid-19 analyis and forecast.
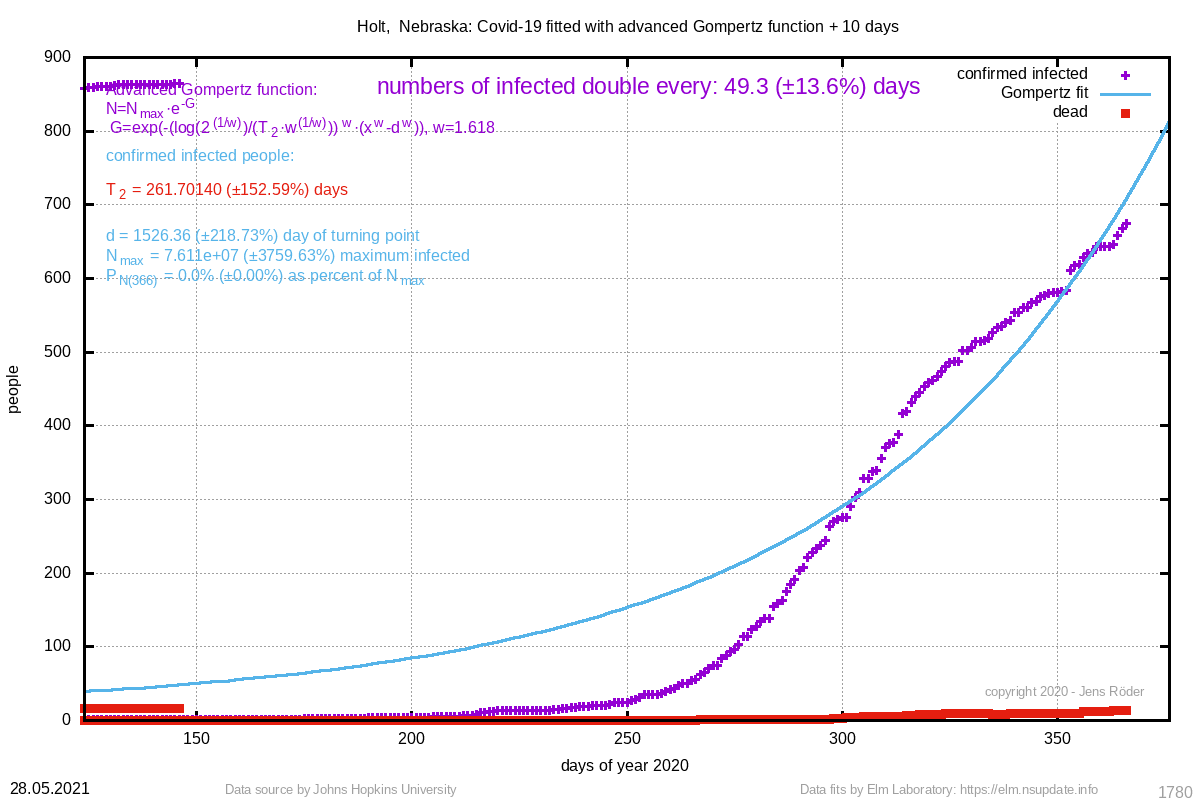
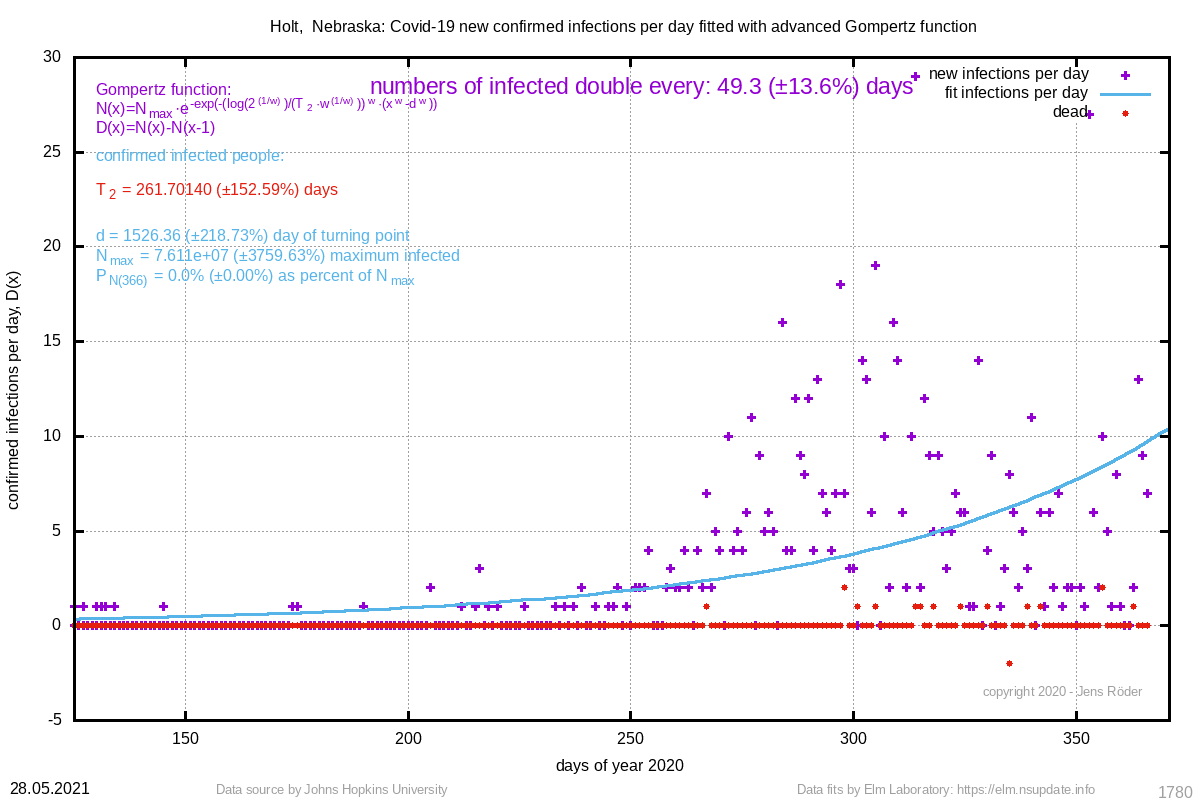
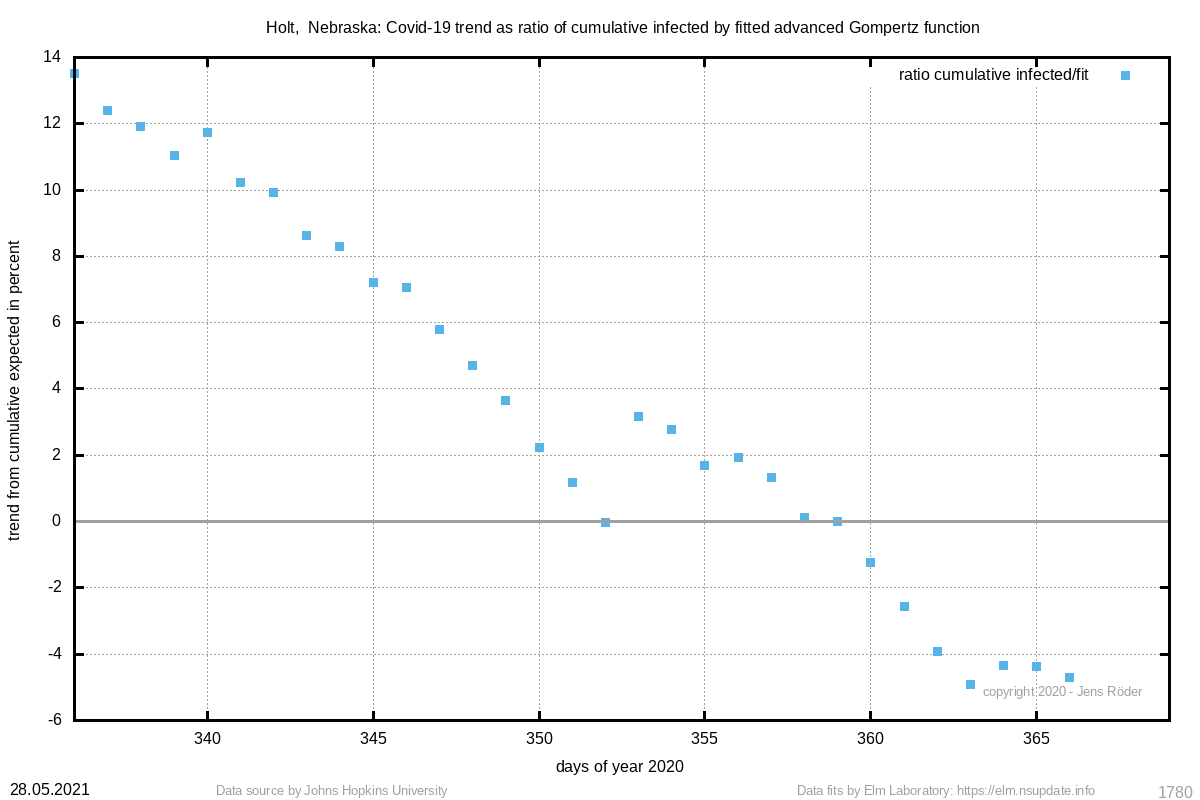
This is an automized summary of the data of Holt, Nebraska. Please use common sense to evaluate the data and check their error values thorougly. Error values above 50% indicate that the value is of little significance. Error values above 100% mean that at current state, there is no prediction information in this value.
Your support will help us working on new data analyis on Covid-19 for you:

(by click on image you accept third party cookies, required by paypal.)


Missing graphs of death fits indicate that data quality is insufficient for a fit.
| day numbers of 2020 | date |
| 80 | 20 March 2020 |
| 90 | 30 March 2020 |
| 100 | 9 April 2020 |
| 110 | 19 April 2020 |
| 120 | 29 April 2020 |
| 130 | 9 May 2020 |
| 140 | 19 May 2020 |
| 150 | 29 May 2020 |
| 160 | 8 June 2020 |
| 170 | 18 June 2020 |
| 180 | 28 June 2020 |
