
You may want to switch here to the new website-design of this table.
All the fits of the data of individual areas are created fully automatically. You may check on the graph (click on the image) if the fit has a sufficient quality, matching the data points as best as possible. There may be some cases, where by too unexpected real data, the fit is not giving a good forecast. So please use common sense to evaluate the data.
Locations or countries with not enough data points or other reasons are skipped and can be found in this list.
The table shows from the left: The maximum last cumulative number, the expected maximum number by fit, graph and location, the T2 also known as doubling time of the exponential growth, the day of turning point of the function.
The turning point is important, showing the turn from purely exponential growth to the process of fading out by limited number of victims.
Color code on numbers of infected people: Below 30 , between 30 and 99, between 100 and 499, between 500 and 999, between 1000 and 4999, above 5000.
Color code on locations describe percentages of last number and expected Nmax: Above 95%, between 90% and 95%, between 80% and 89%, between 70% and 79%, between 60% and 69%, when number of cases is above 50 and Nmax is below 50% or the doubling time is below 3.5 days! Above 130%, a reoccurrence of an outbreak is indicated.
The location color code tells you, how well the Covid-19 outbreak has faded out and is under control (greenish). In red and magenta the areas are on fast rise in numbers. The color code in numbers tells you how severe the outbreak was in that region.
Applied maths is explained here.
 (by click on image you accept third party cookies, required by paypal)
Actualisation date: Sun Aug 15 04:17:53 UTC 2021
| Ncurrent | Nmax (fit) | cumulative | location | death rate | death rate | cases daily | t2 (fit) | dturning point (fit) |
| 1062641 | 1805616 (±3.4%) | 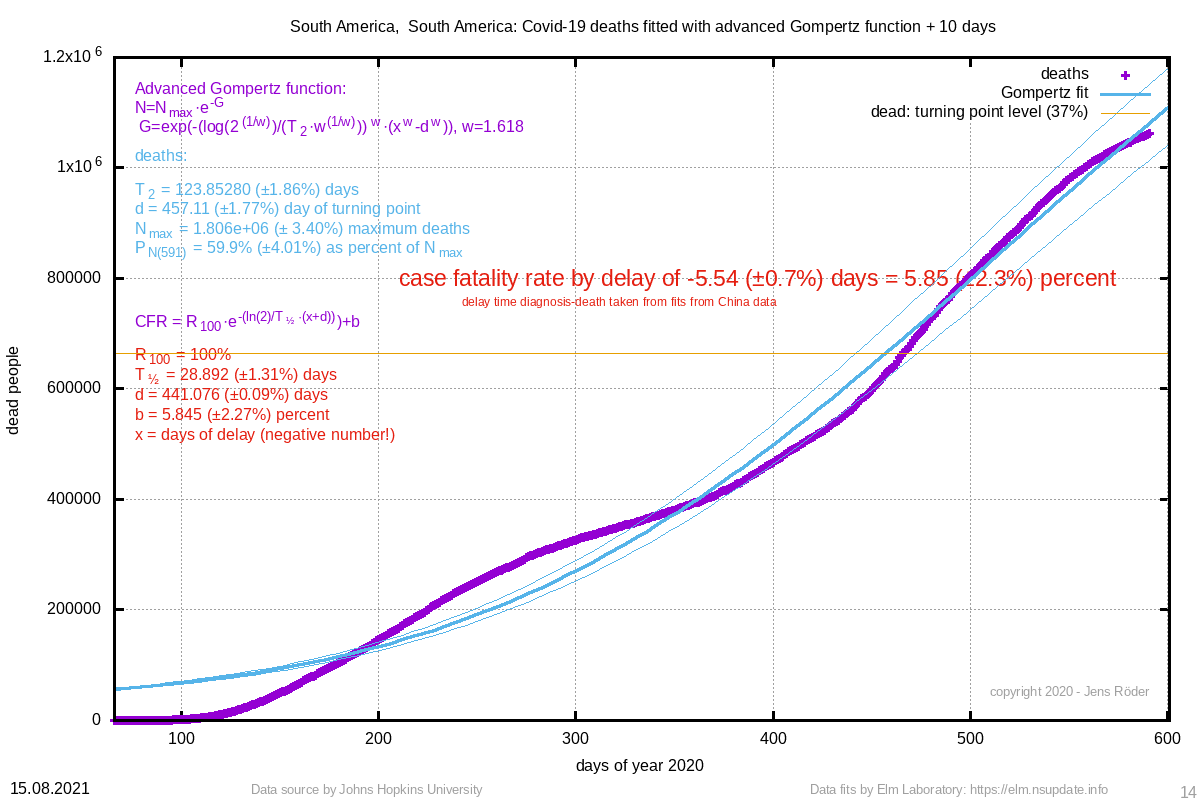 | South America, South America | 5.85 (±2.3%) | 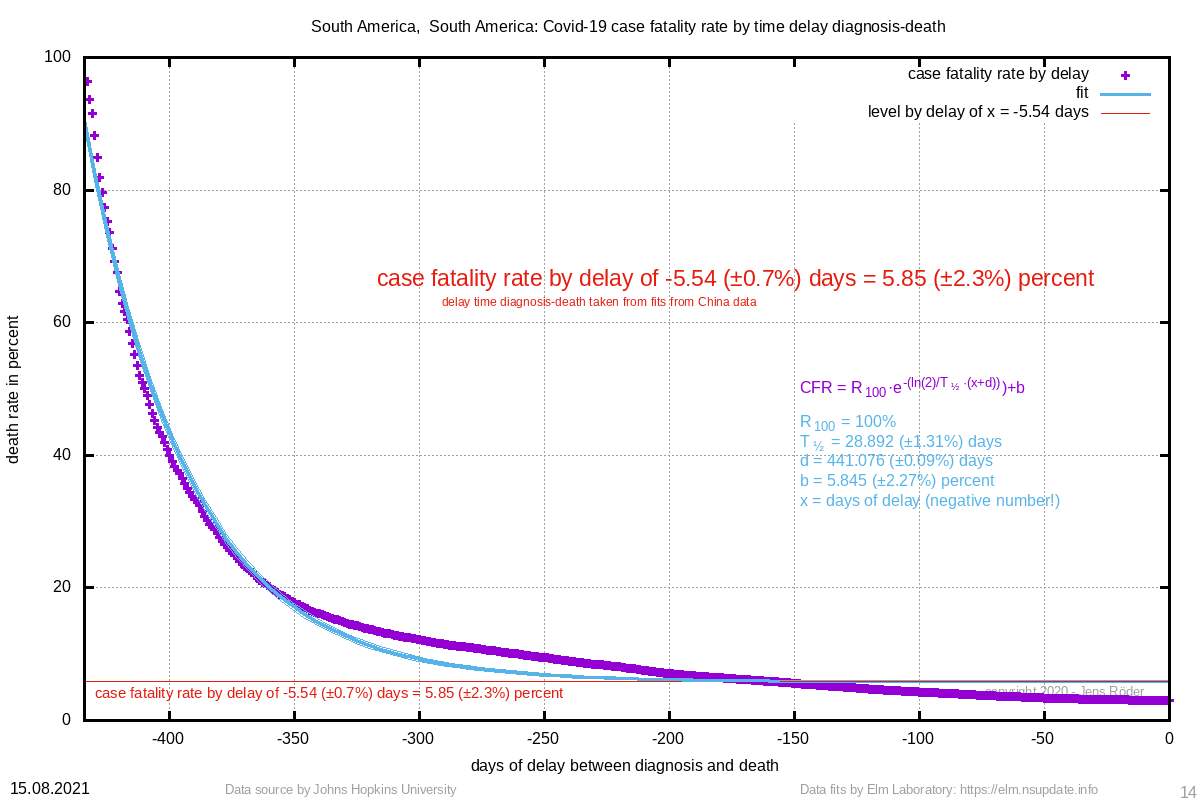 | 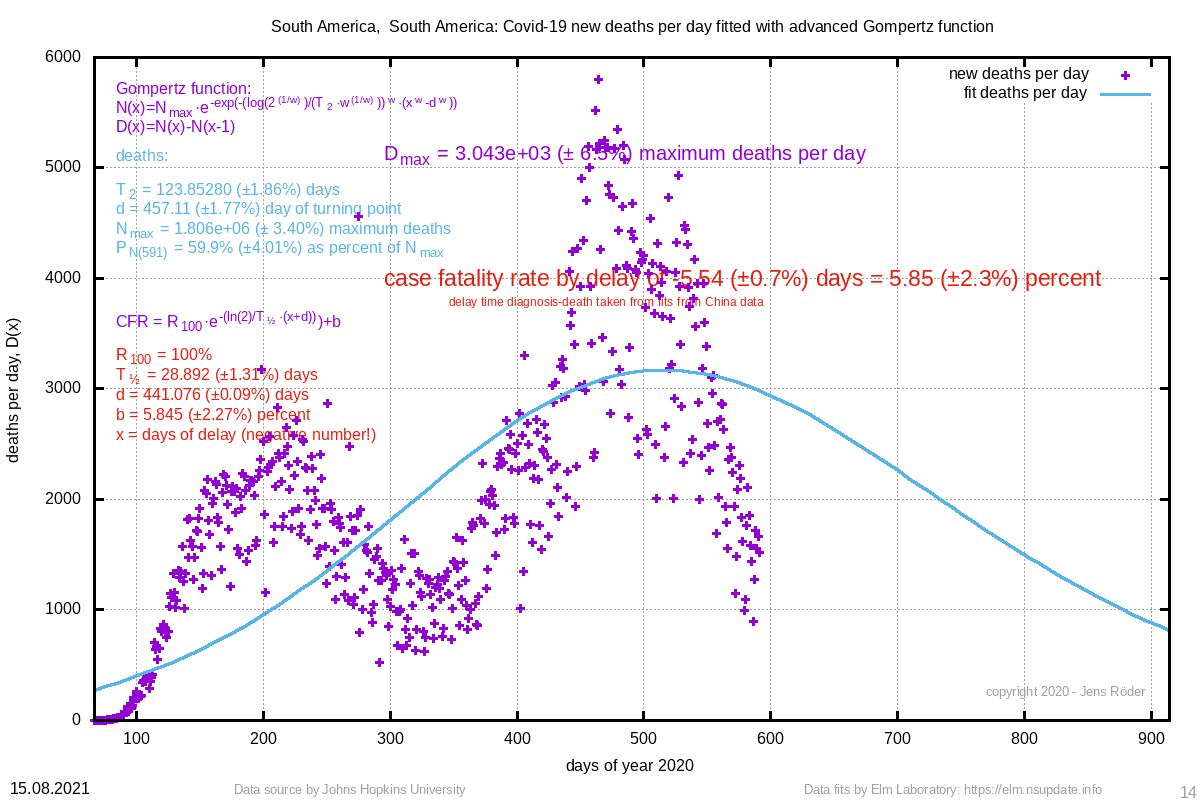 | 123.853 (±1.9%) | 457.11 (±1.8%) |
| 940090 | 1047422 (±0.8%) | 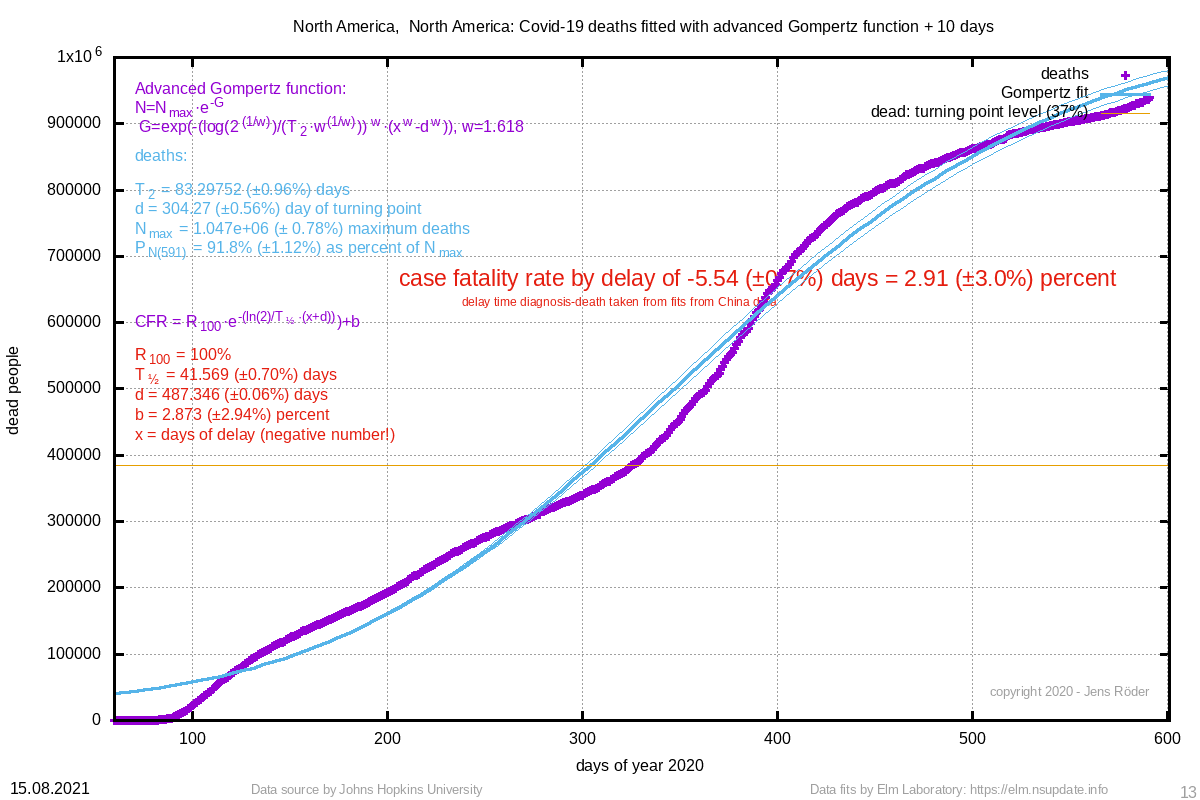 | North America, North America | 2.91 (±3.0%) | 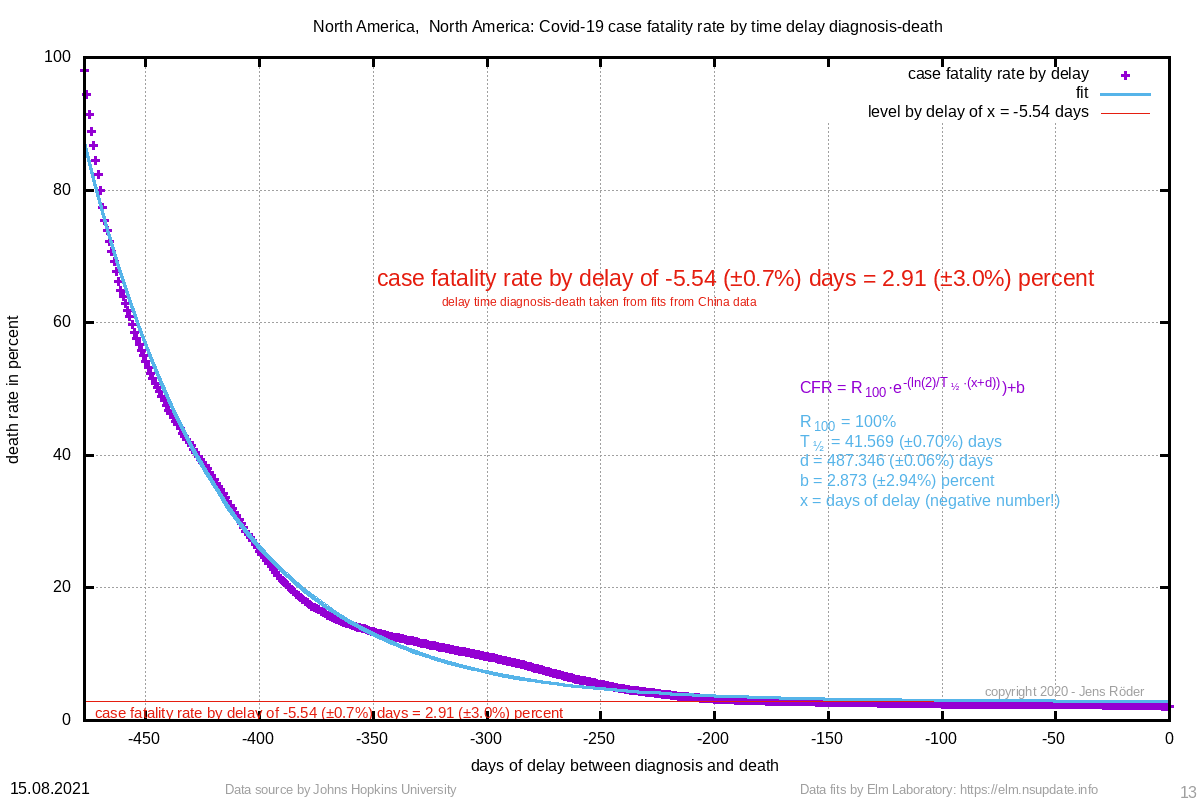 | 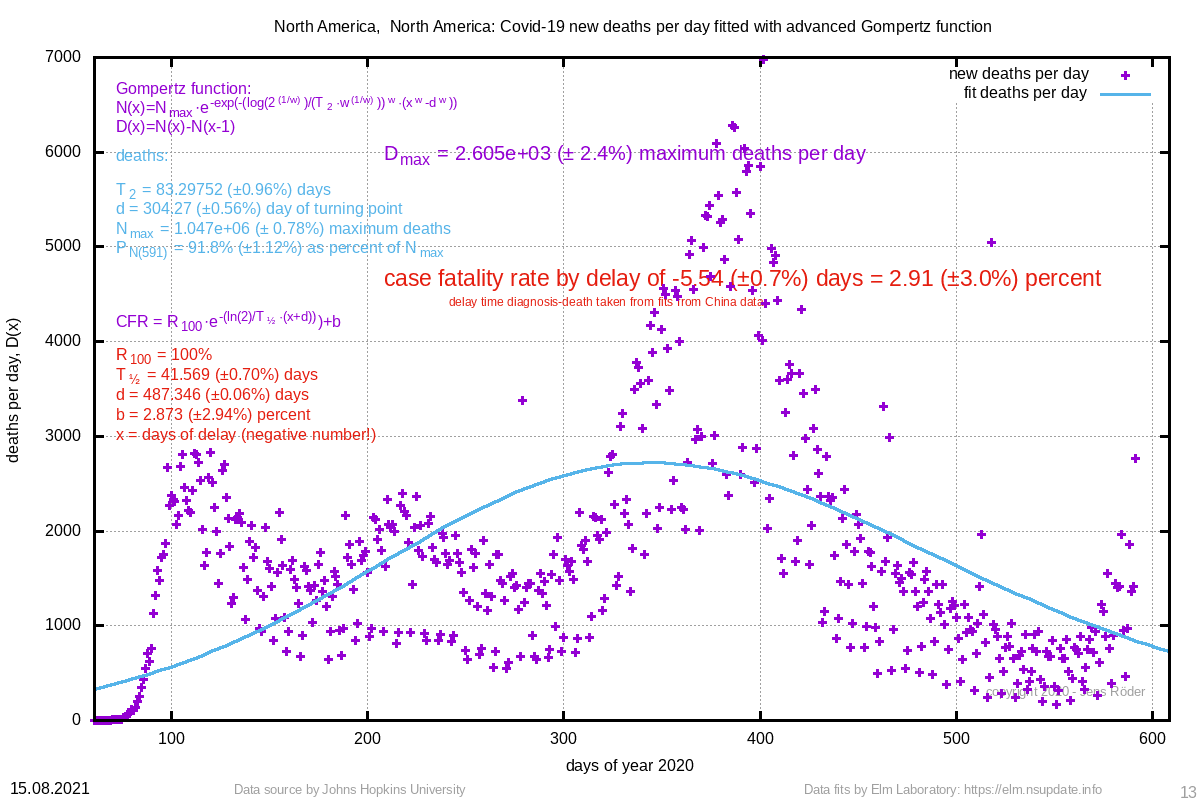 | 83.298 (±1.0%) | 304.27 (±0.6%) |
| 567862 | 1230322 (±4.9%) | 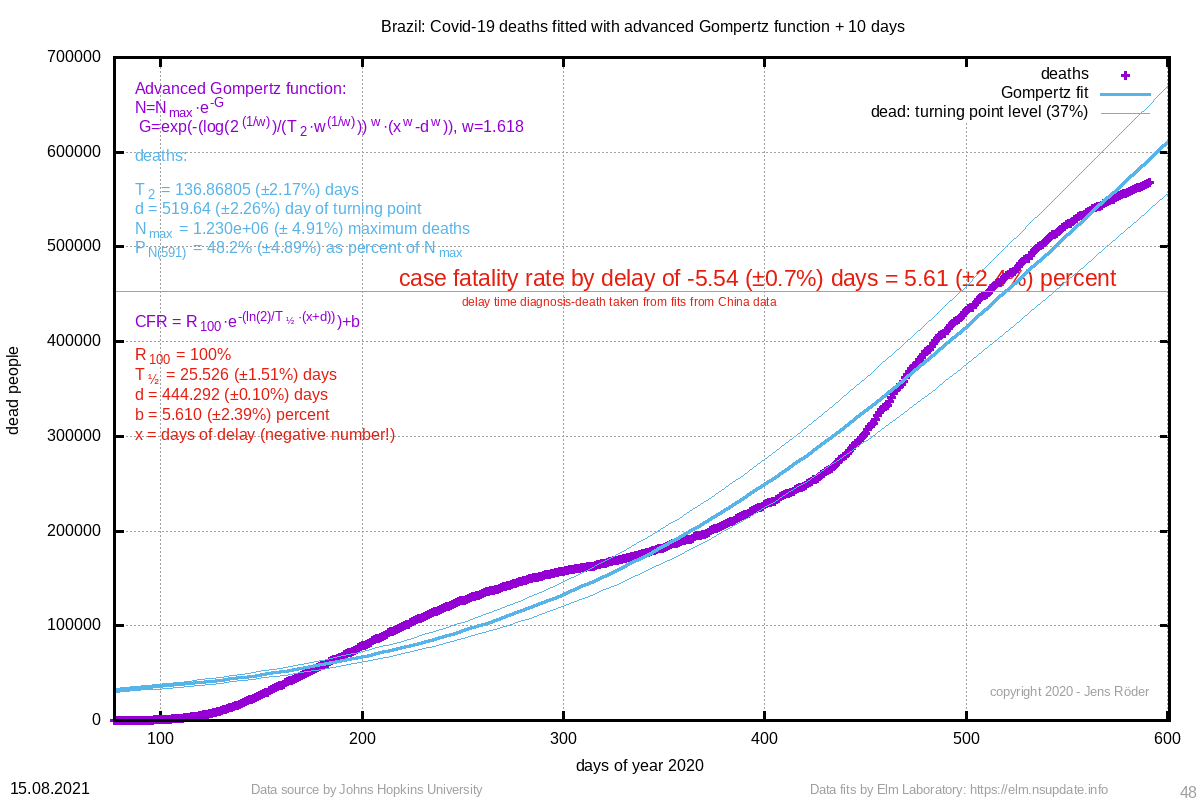 | Brazil | 5.61 (±2.4%) | 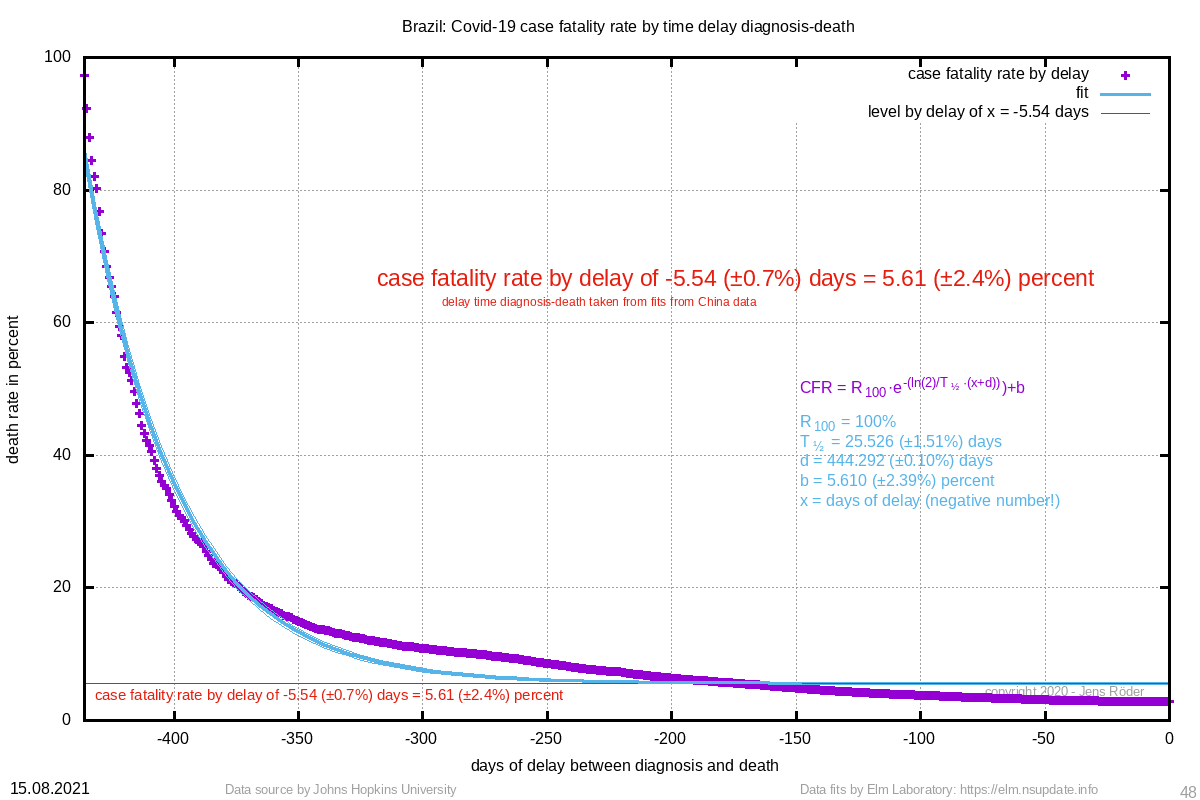 |  | 136.868 (±2.2%) | 519.64 (±2.3%) |
| 502121 | 4400004 (±30.5%) | 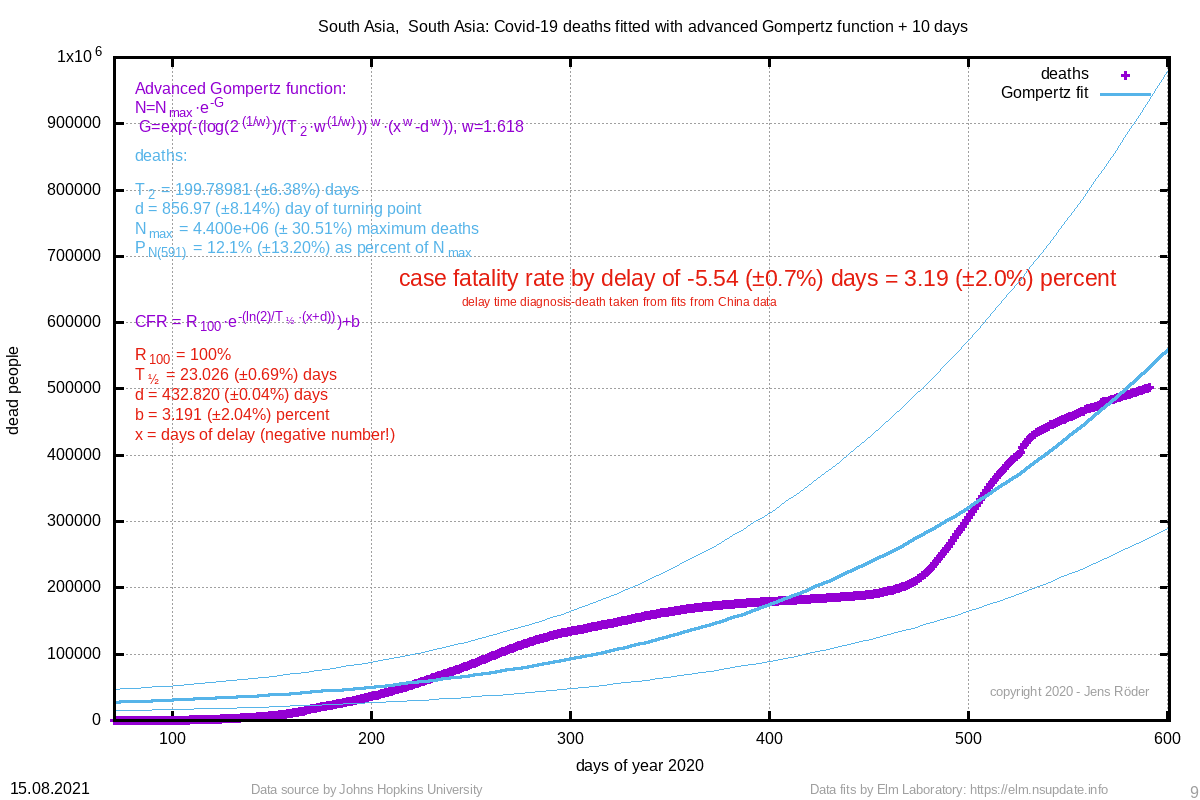 | South Asia, South Asia | 3.19 (±2.0%) | 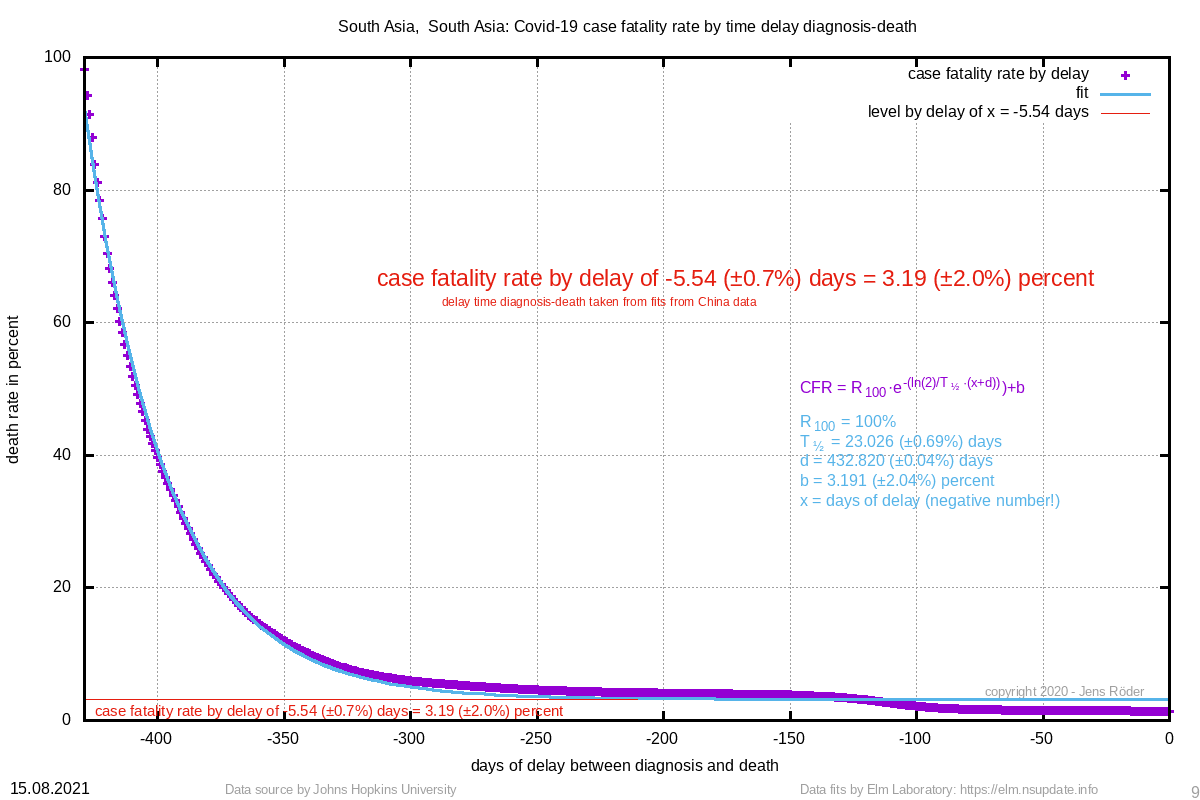 | 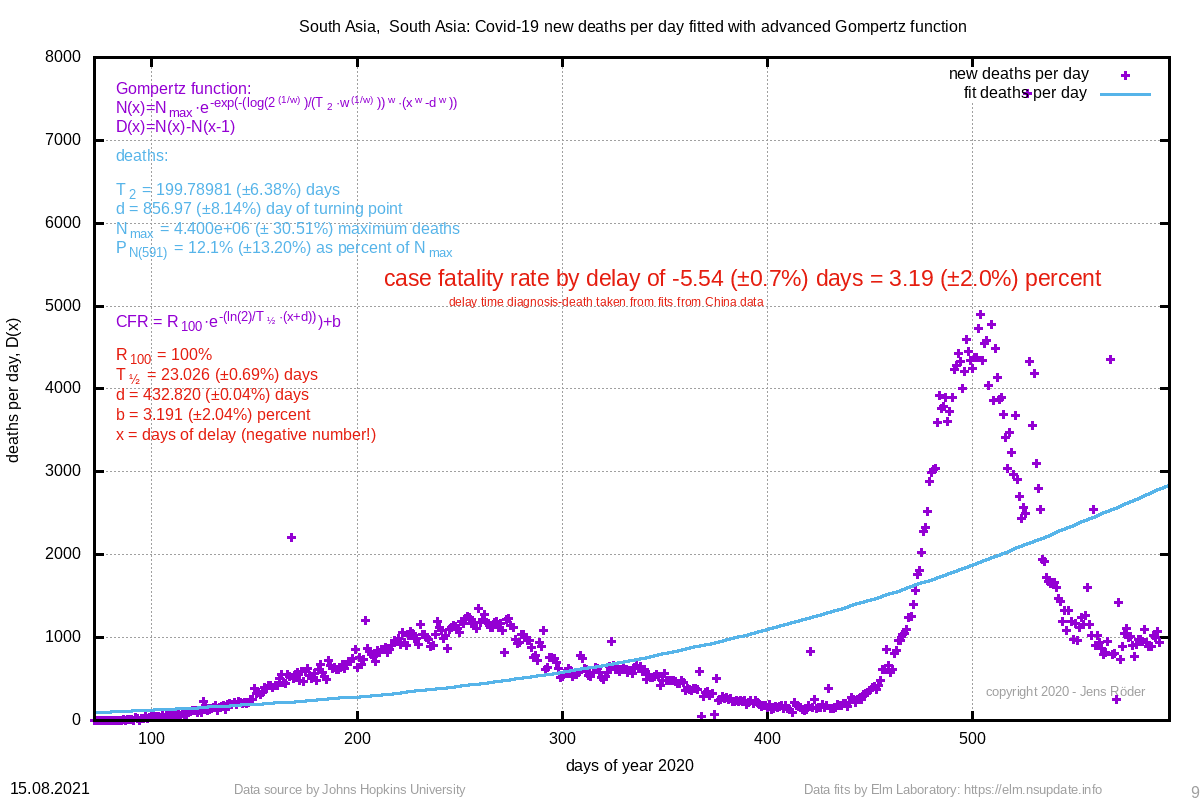 | 199.790 (±6.4%) | 856.97 (±8.1%) |
| 225663 | 278892 (±0.6%) | 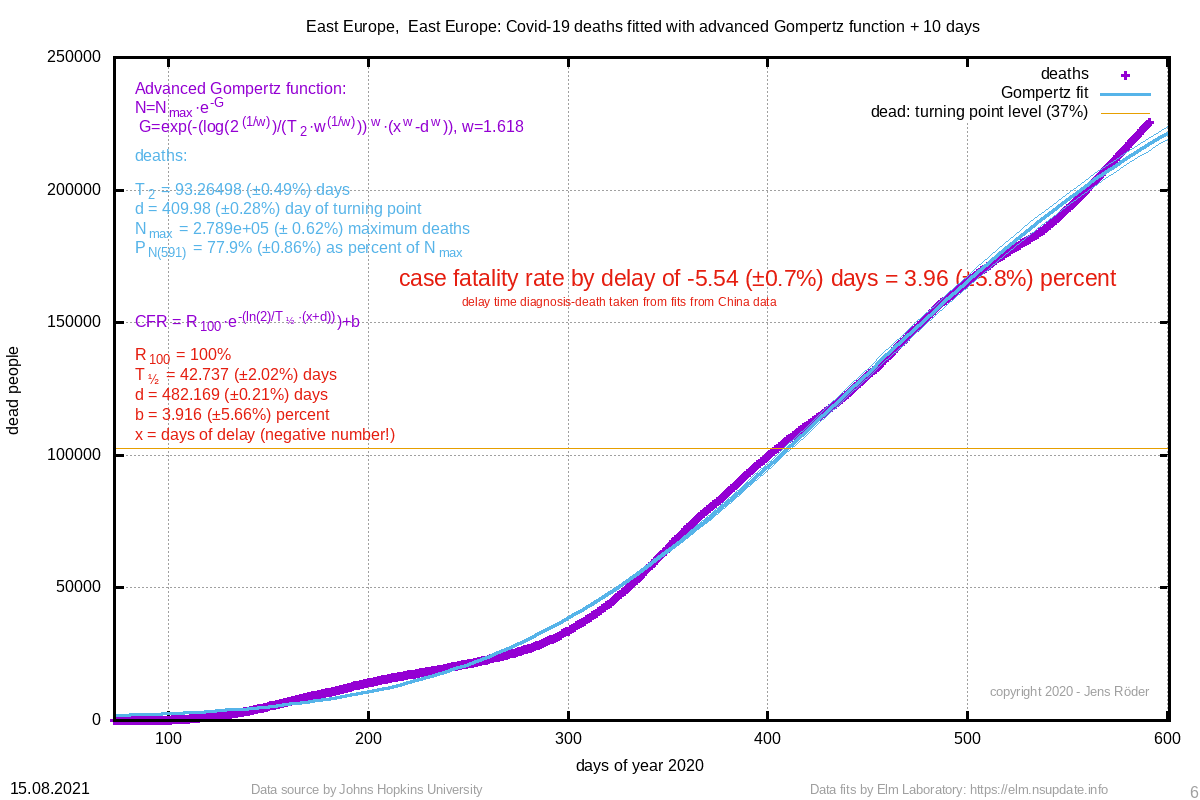 | East Europe, East Europe | 3.96 (±5.8%) |  | 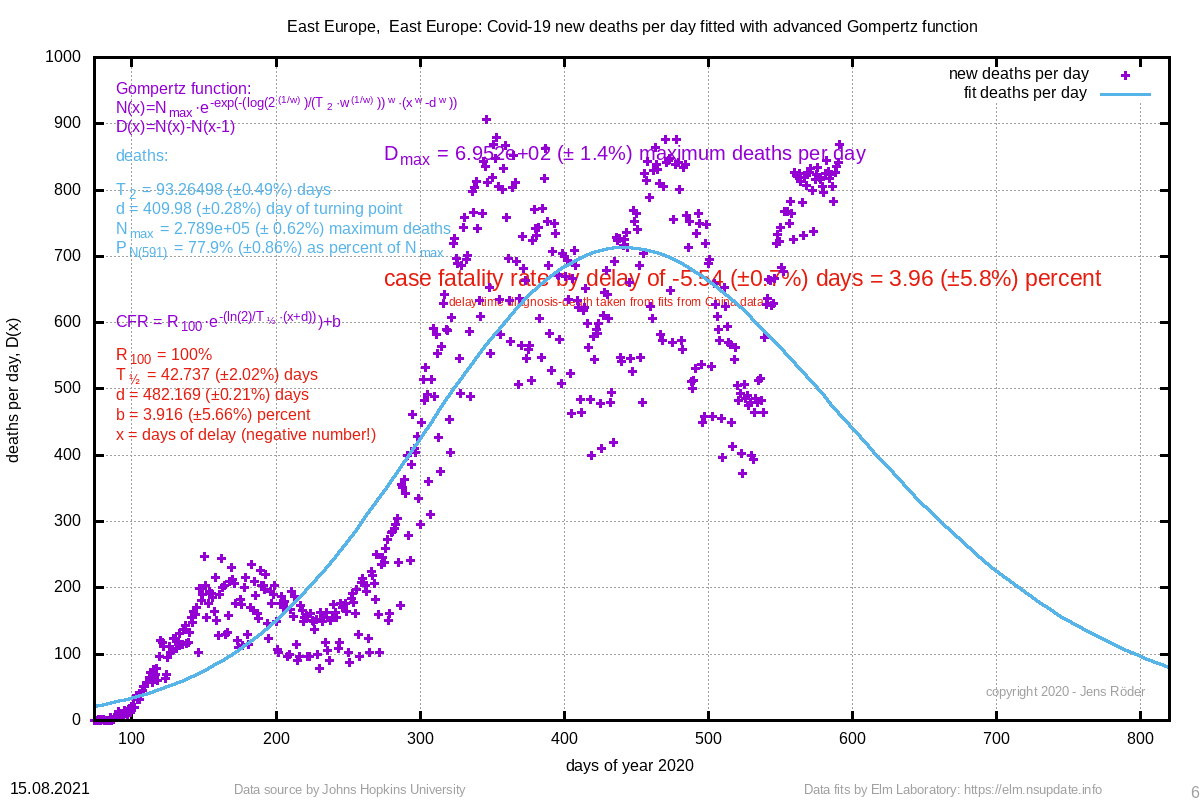 | 93.265 (±0.5%) | 409.98 (±0.3%) |
| 215962 | 240270 (±0.7%) | 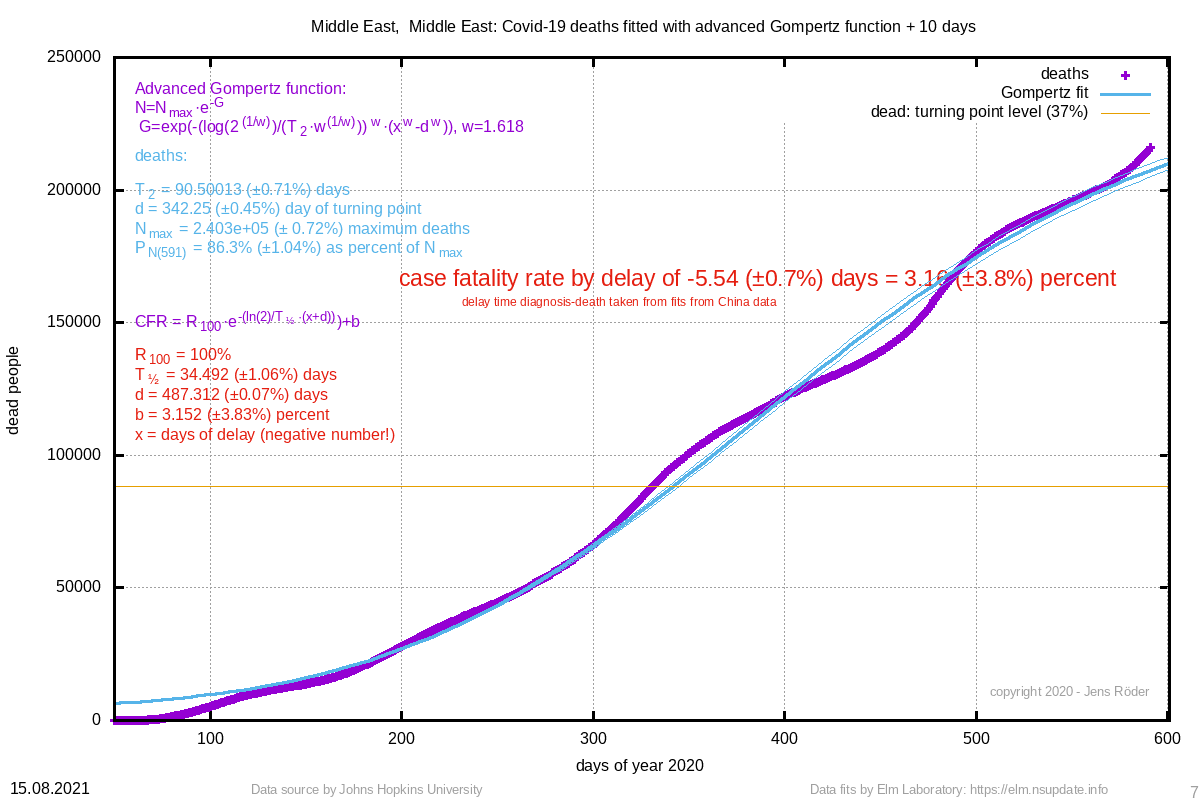 | Middle East, Middle East | 3.16 (±3.8%) | 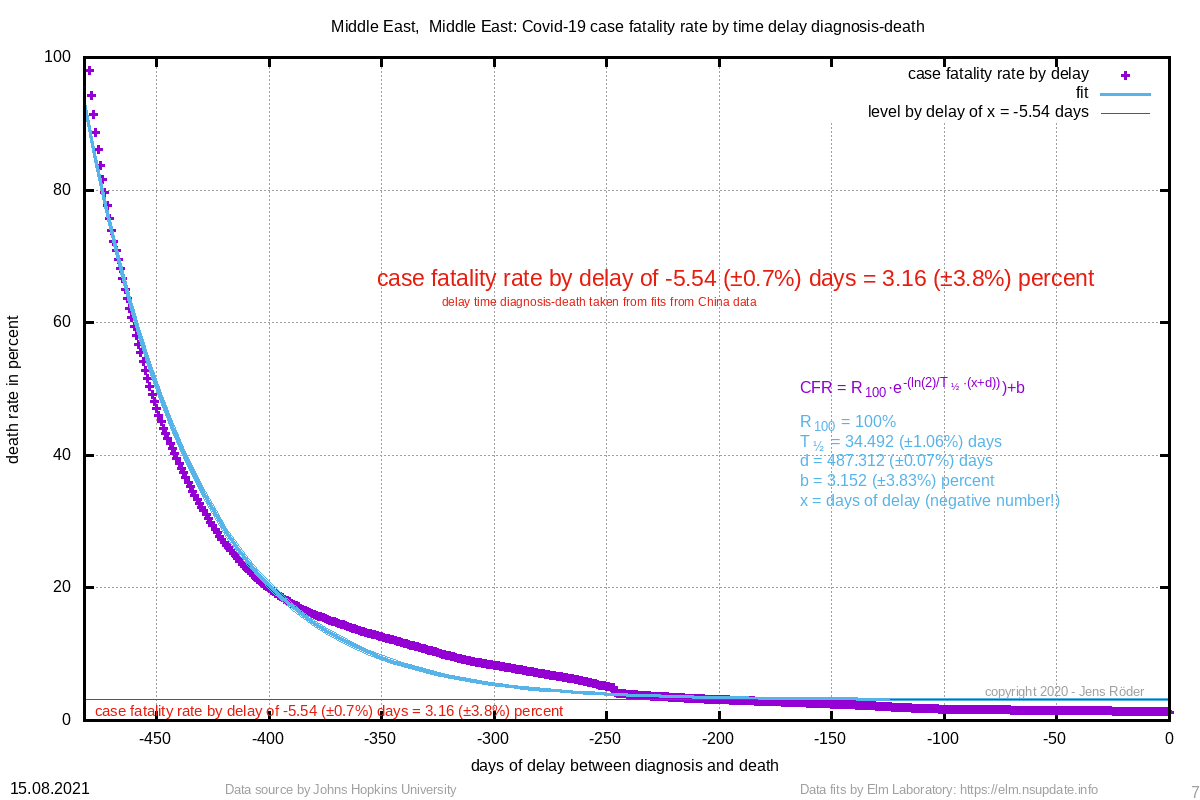 |  | 90.500 (±0.7%) | 342.25 (±0.4%) |
| 181879 | 197583 (±1.3%) | 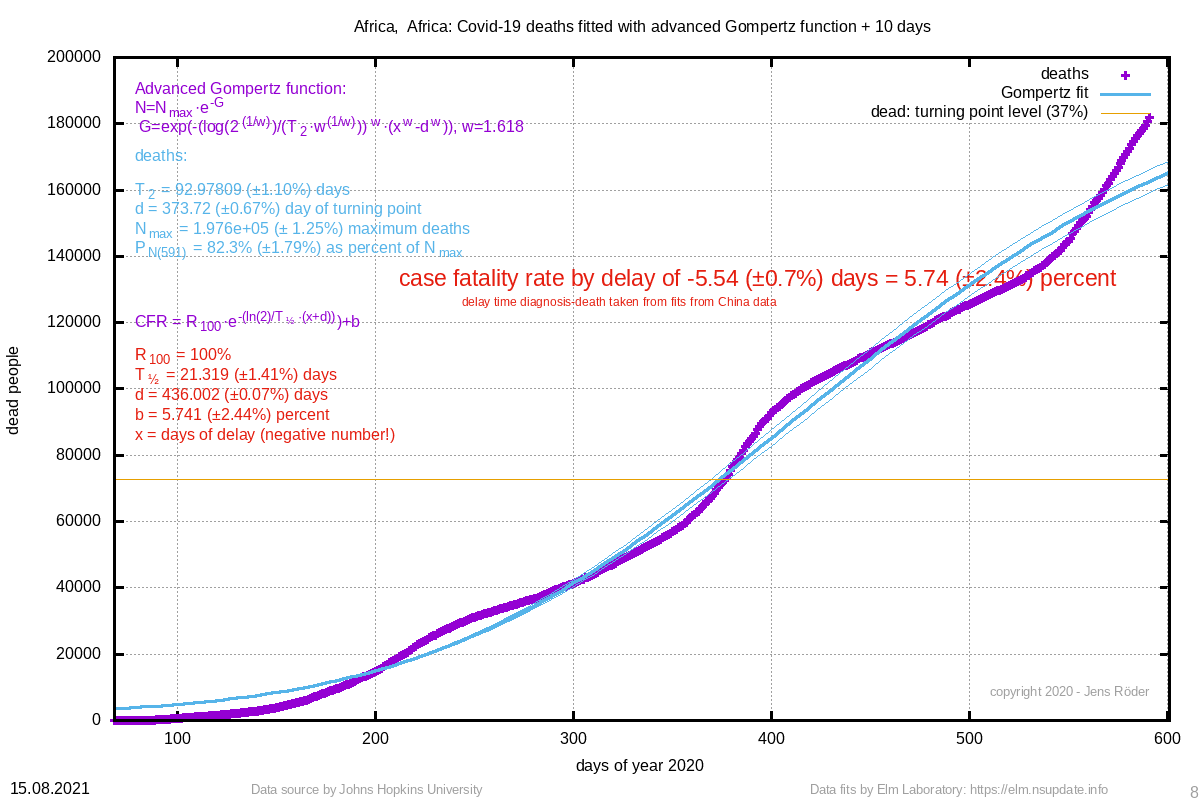 | Africa, Africa | 5.74 (±2.4%) |  | 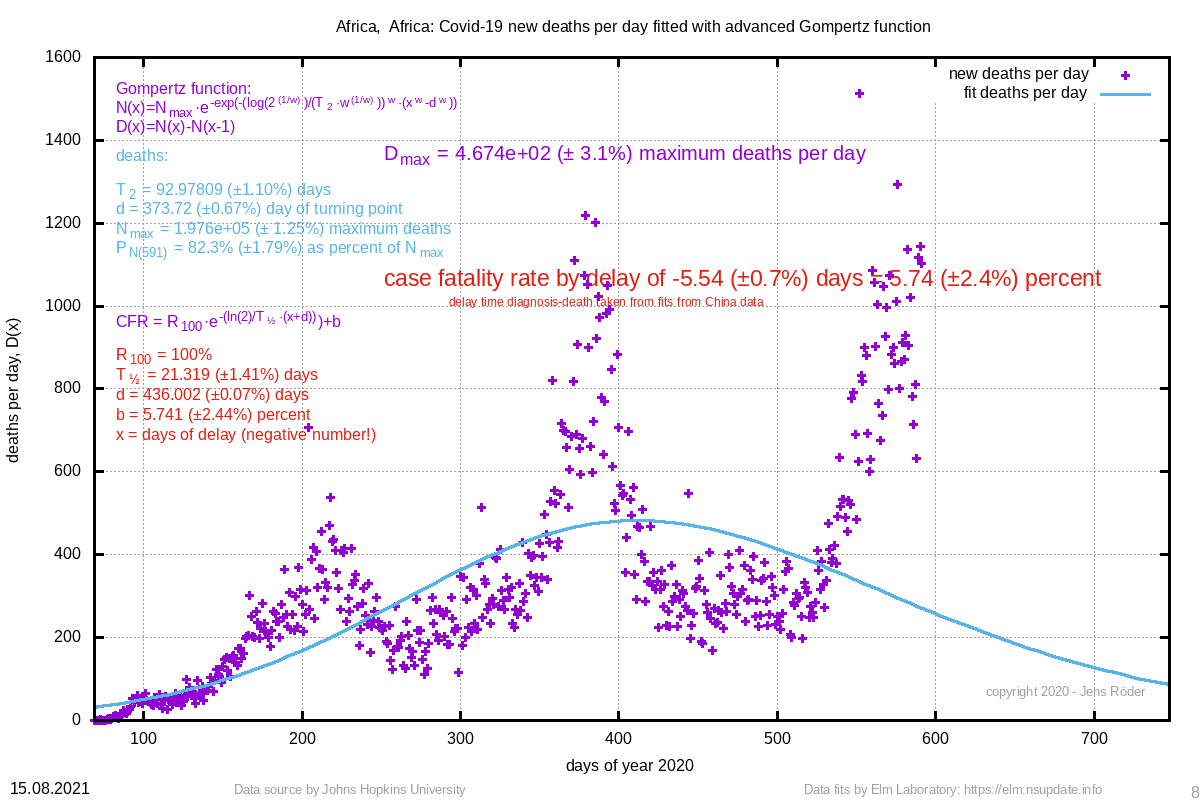 | 92.978 (±1.1%) | 373.72 (±0.7%) |
| 128379 | 171979 (±2.4%) | 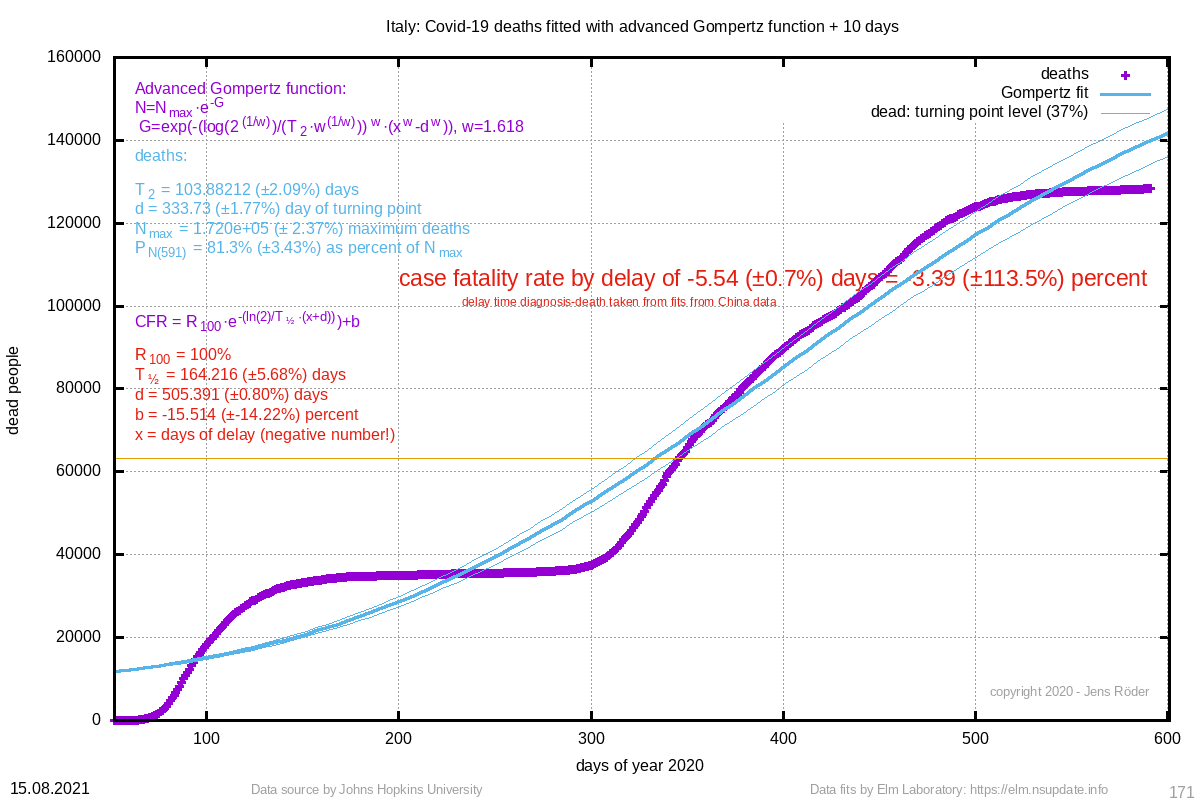 | Italy | -3.39 (±113.5%) | 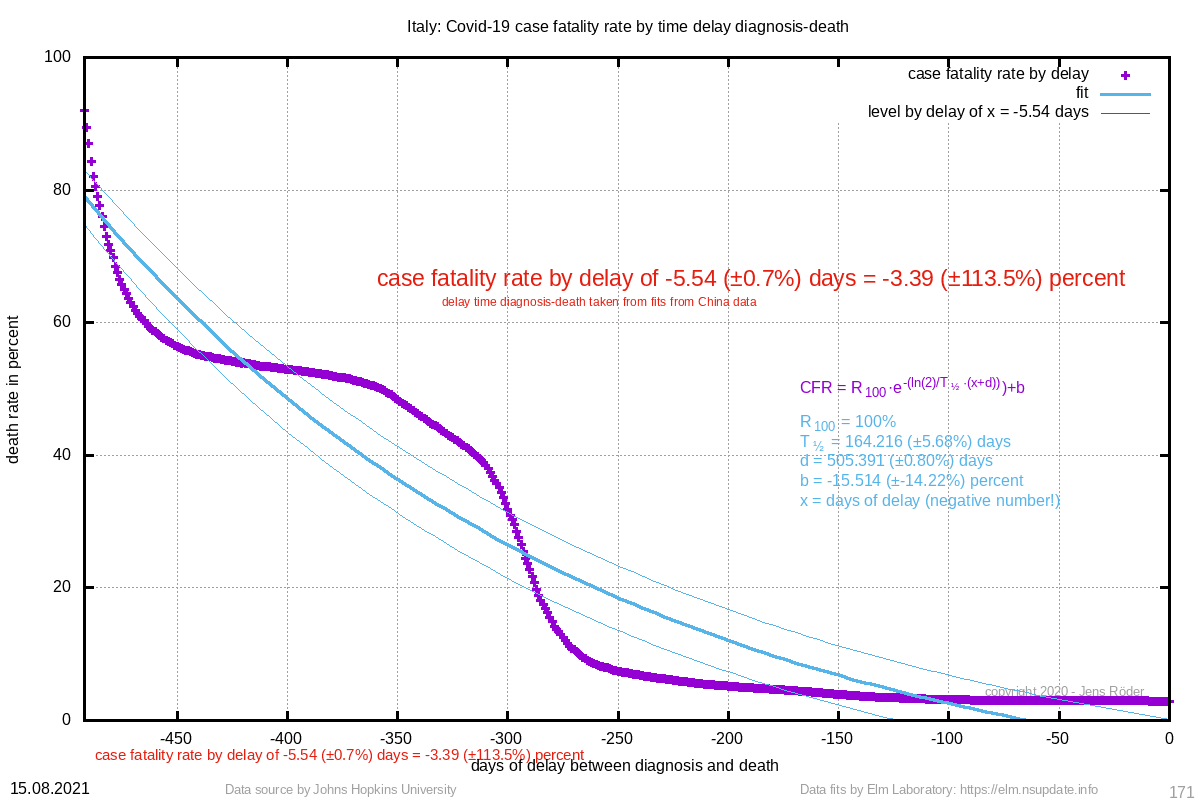 |  | 103.882 (±2.1%) | 333.73 (±1.8%) |
| 108815 | 146695 (±3.5%) | 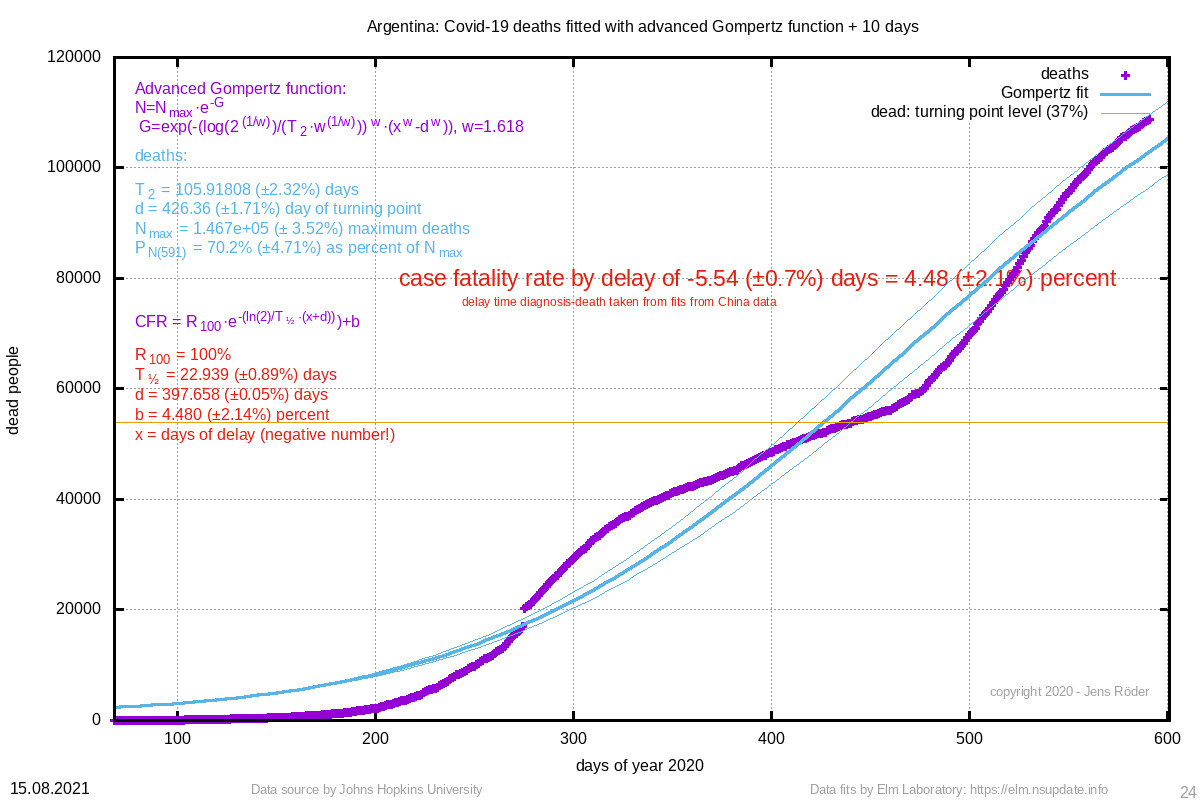 | Argentina | 4.48 (±2.1%) | 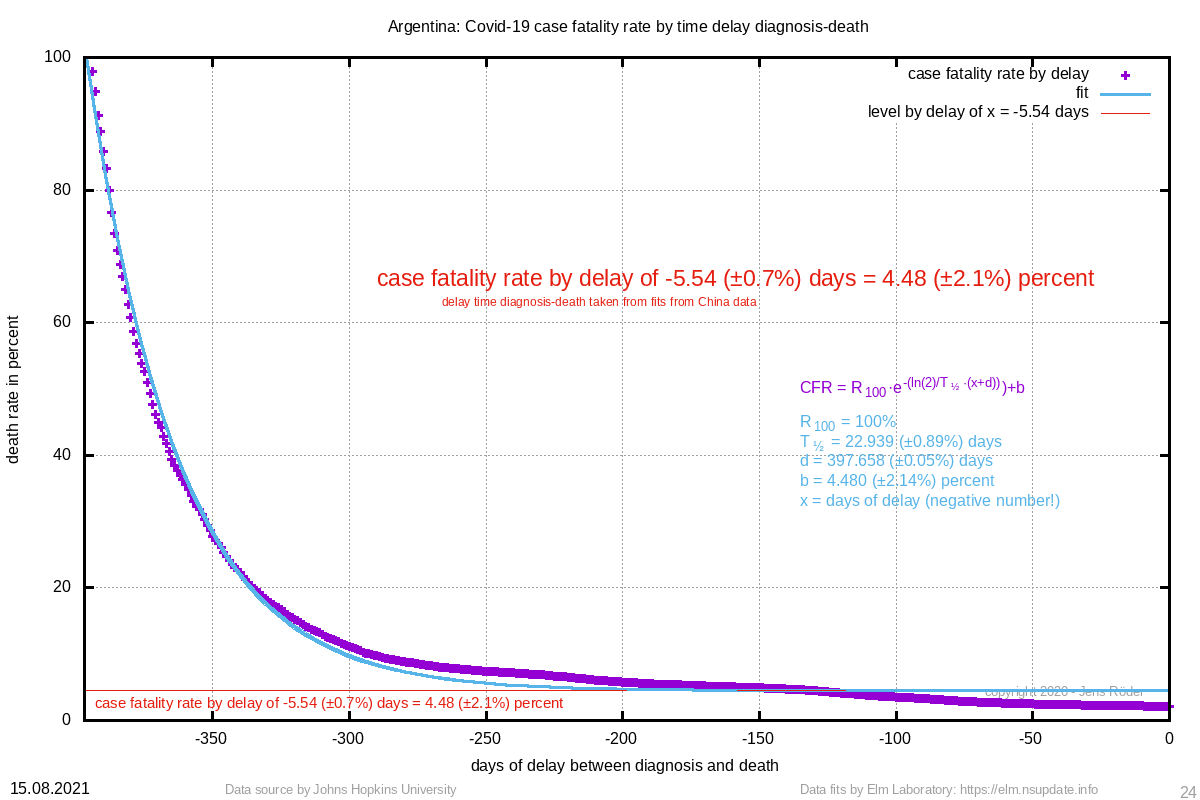 | 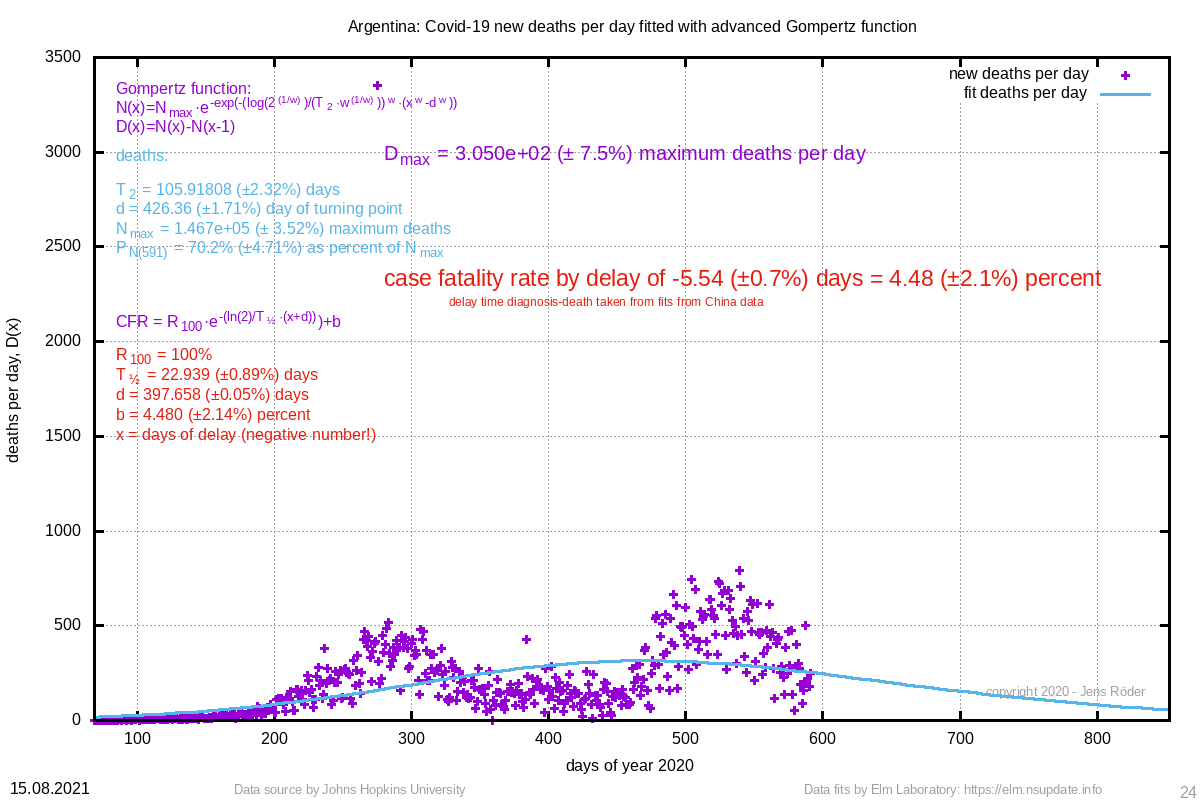 | 105.918 (±2.3%) | 426.36 (±1.7%) |
| 31870 | 31820 (±4.0%) | 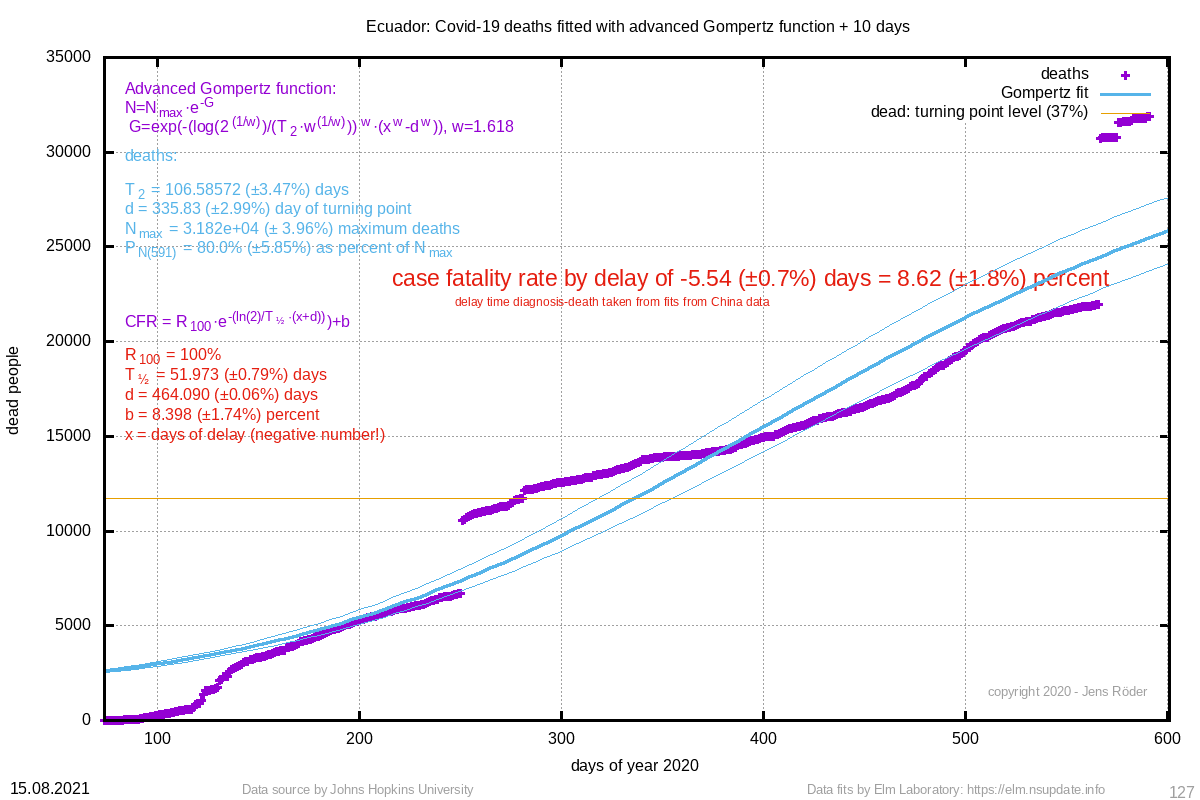 | Ecuador | 8.62 (±1.8%) |  | 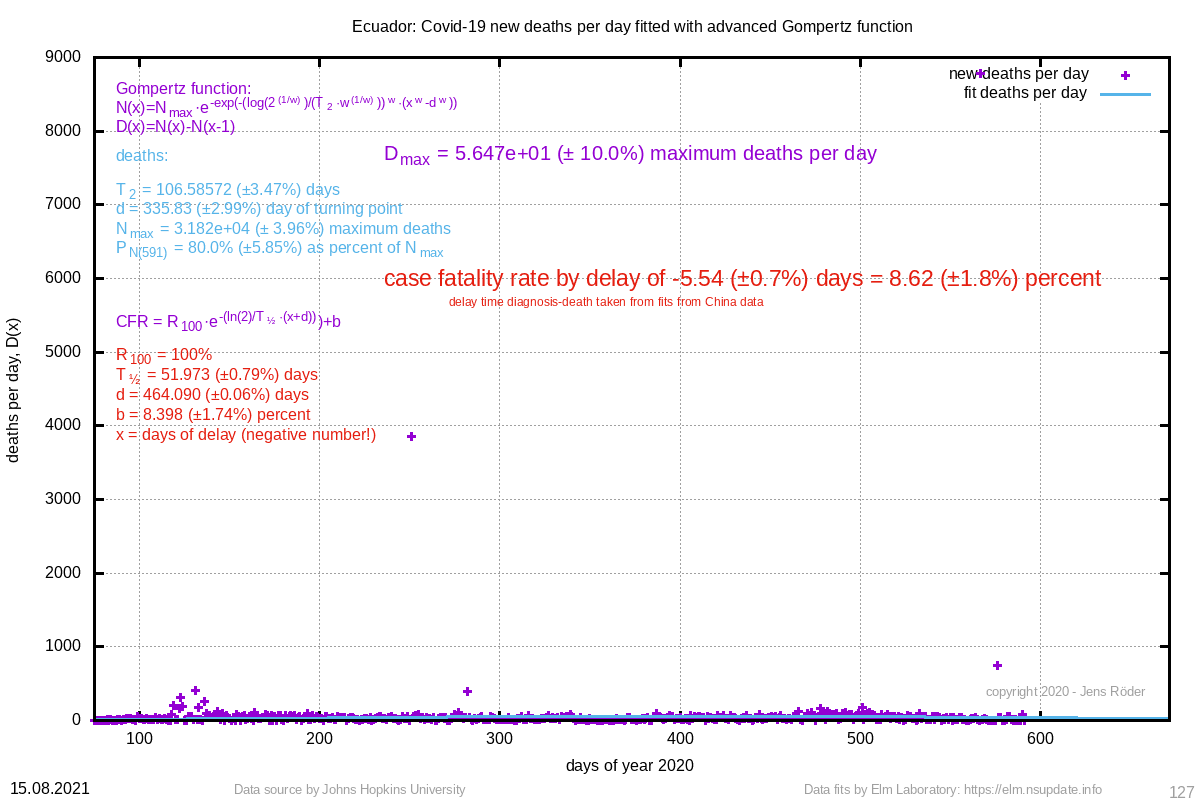 | 106.586 (±3.5%) | 335.83 (±3.0%) |
| 26654 | 32019 (±1.9%) | 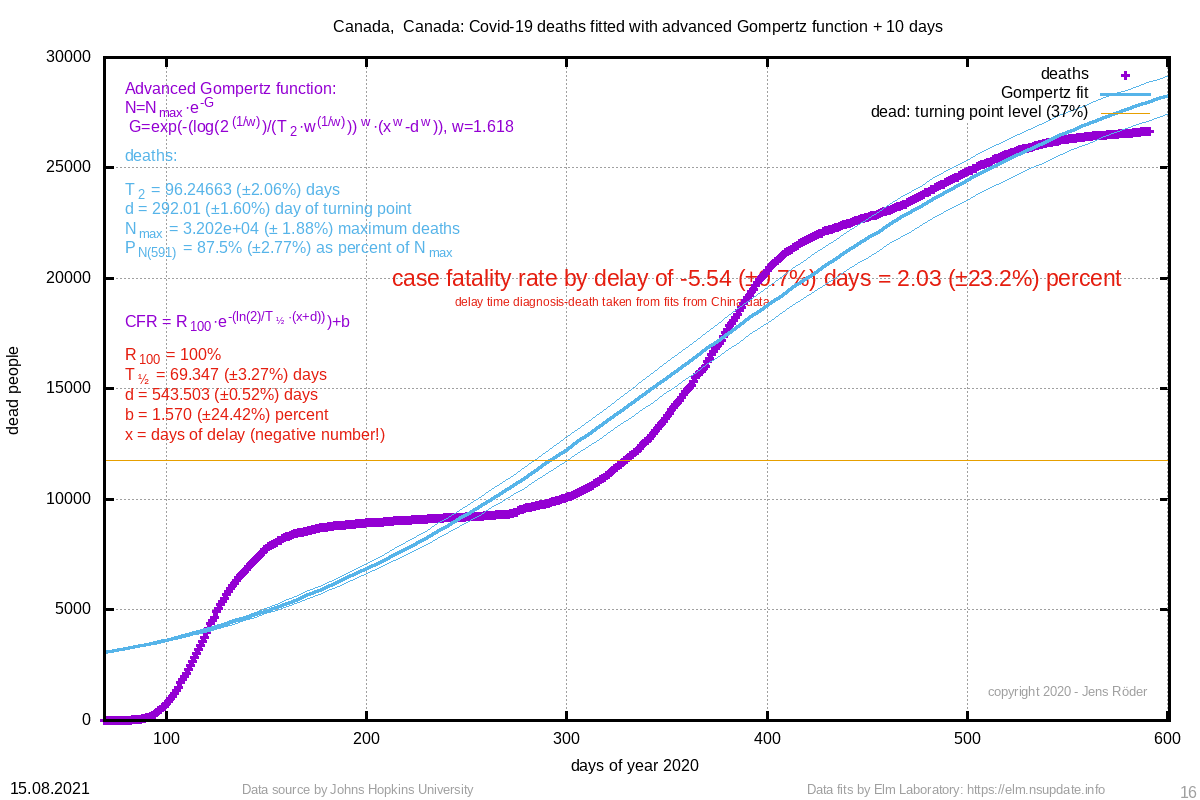 | Canada, Canada | 2.03 (±23.2%) | 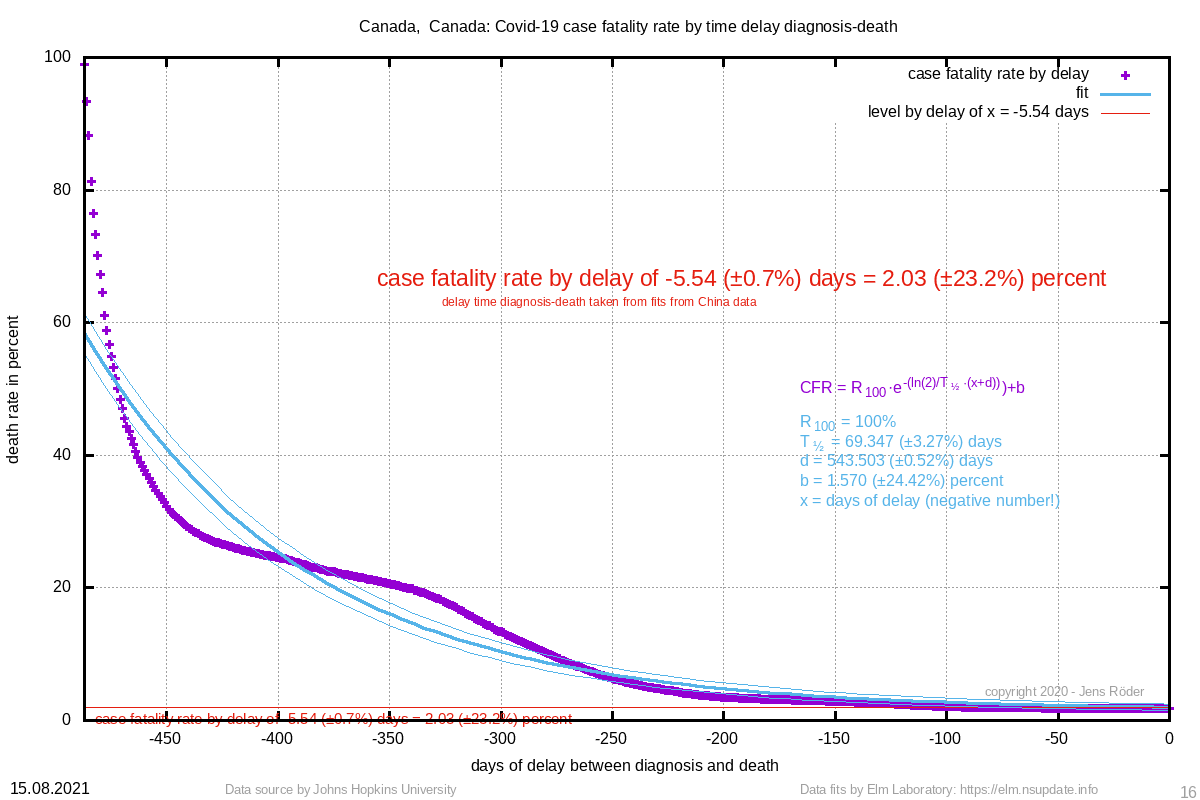 | 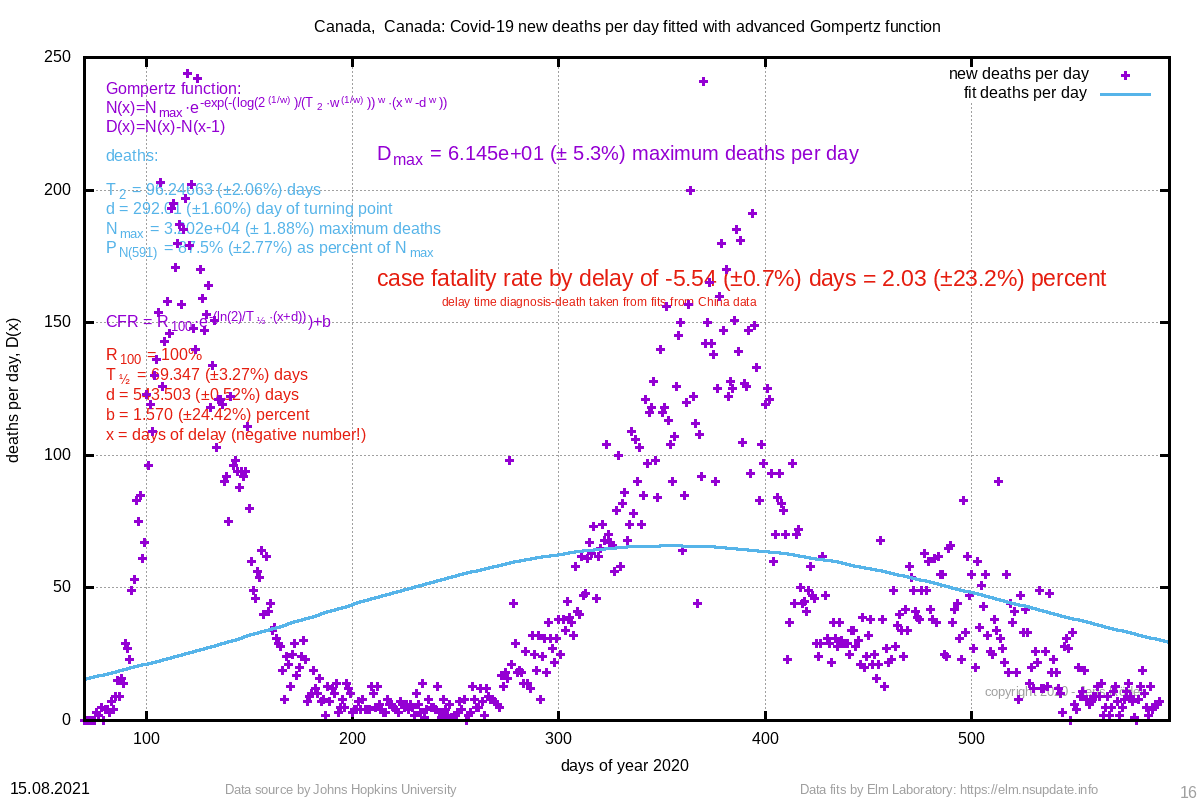 | 96.247 (±2.1%) | 292.01 (±1.6%) |
| 25287 | 28303 (±1.4%) | 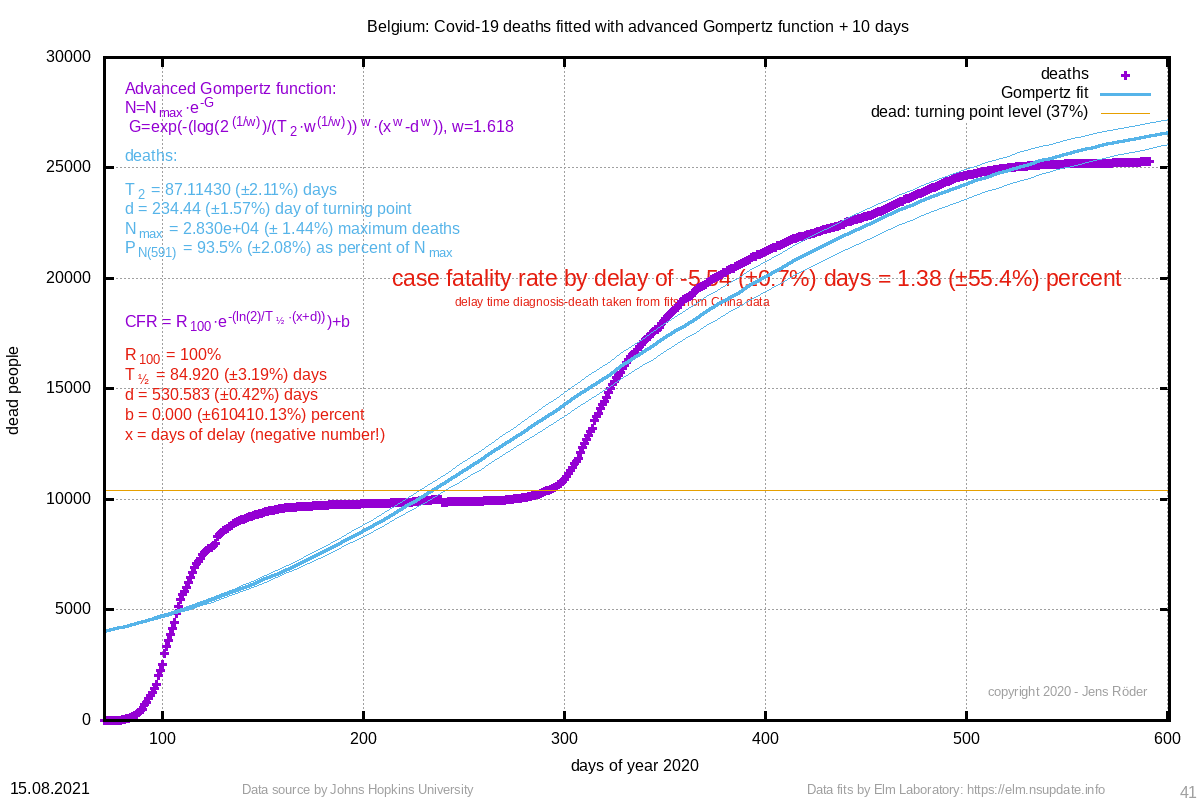 | Belgium | 1.38 (±55.4%) |  | 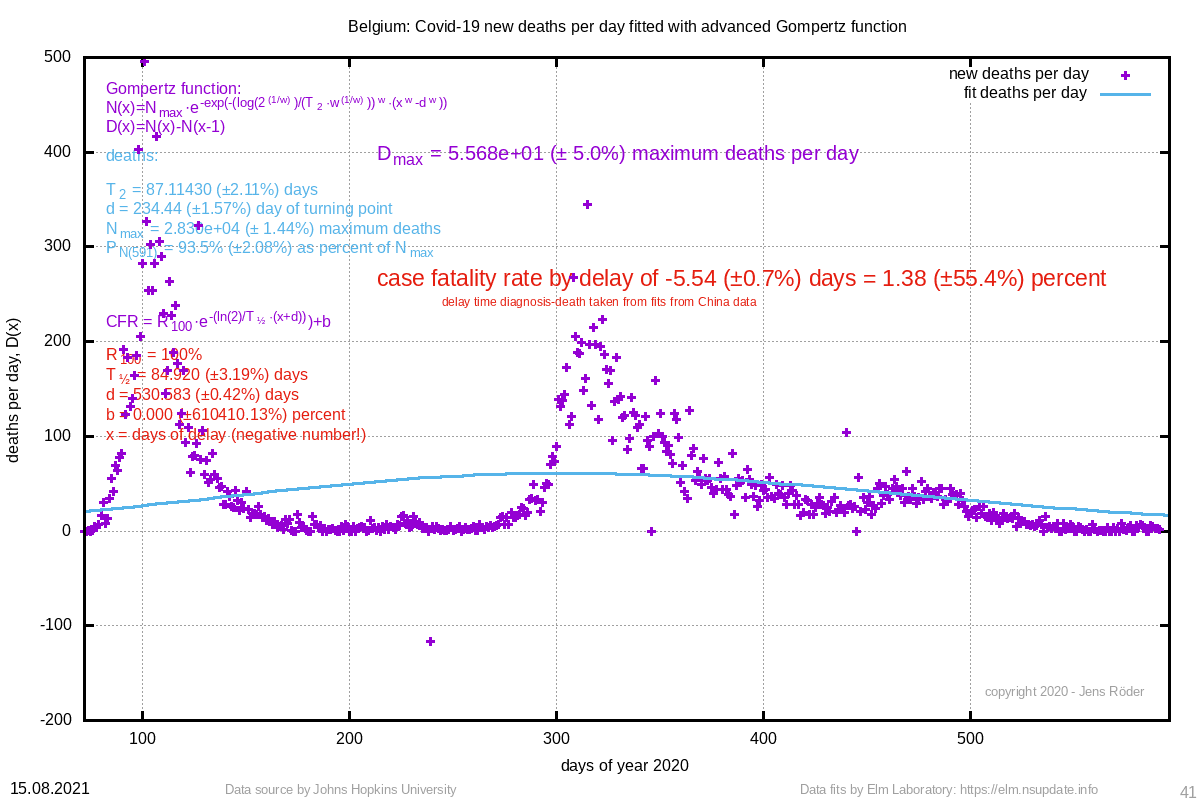 | 87.114 (±2.1%) | 234.44 (±1.6%) |
| 24339 | 40303 (±3.8%) |  | Pakistan | 4.83 (±2.0%) | 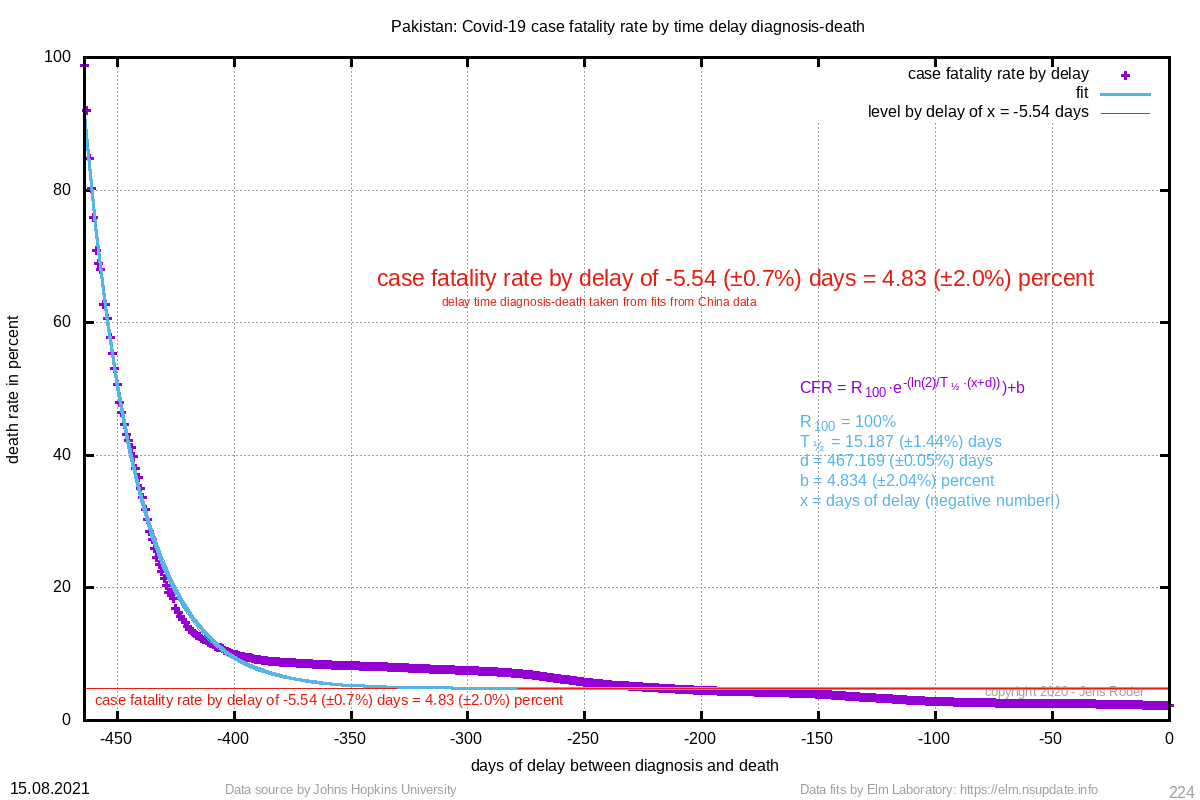 | 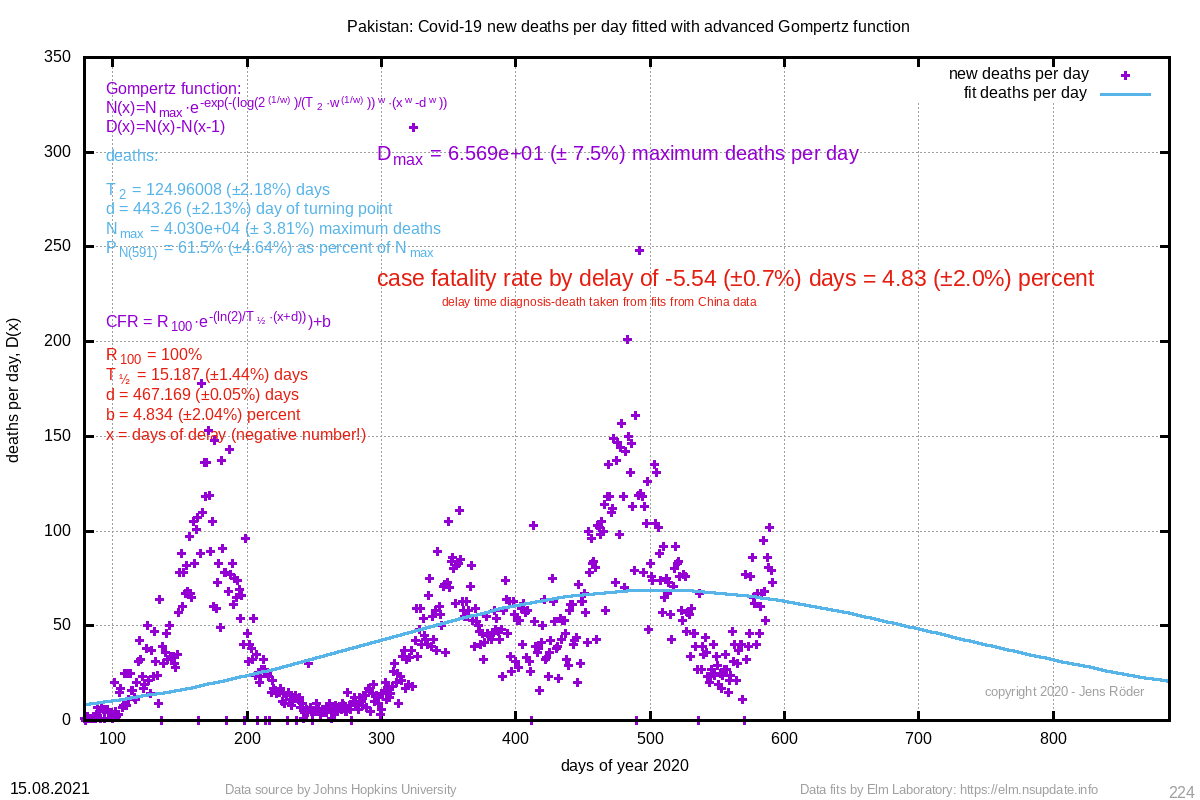 | 124.960 (±2.2%) | 443.26 (±2.1%) |
| 23810 | 169984 (±36.3%) | 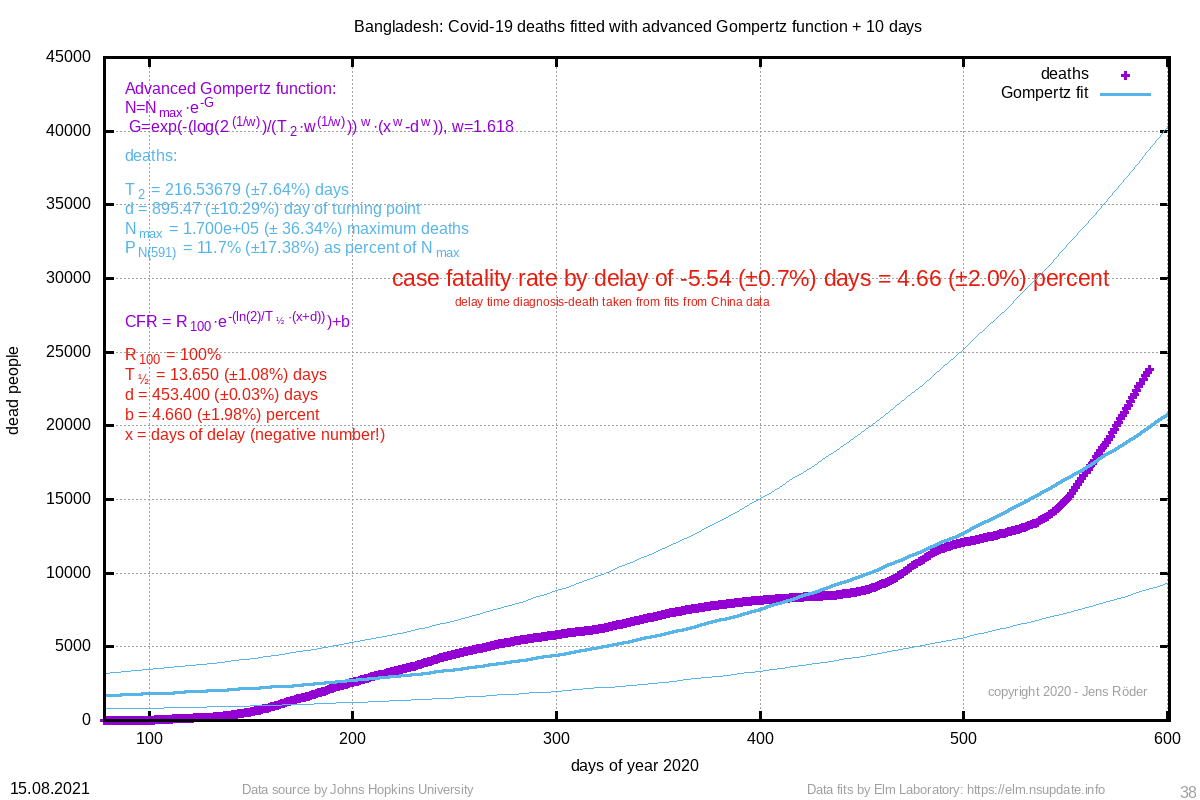 | Bangladesh | 4.66 (±2.0%) | 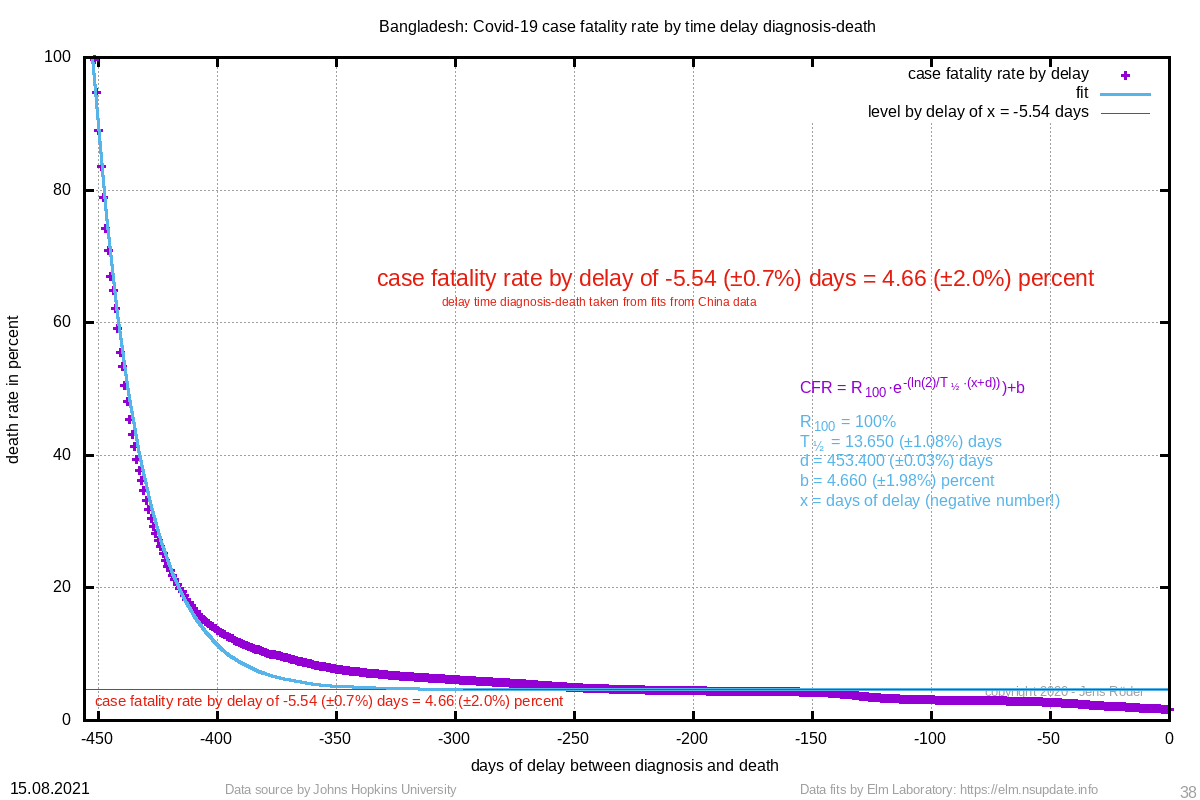 | 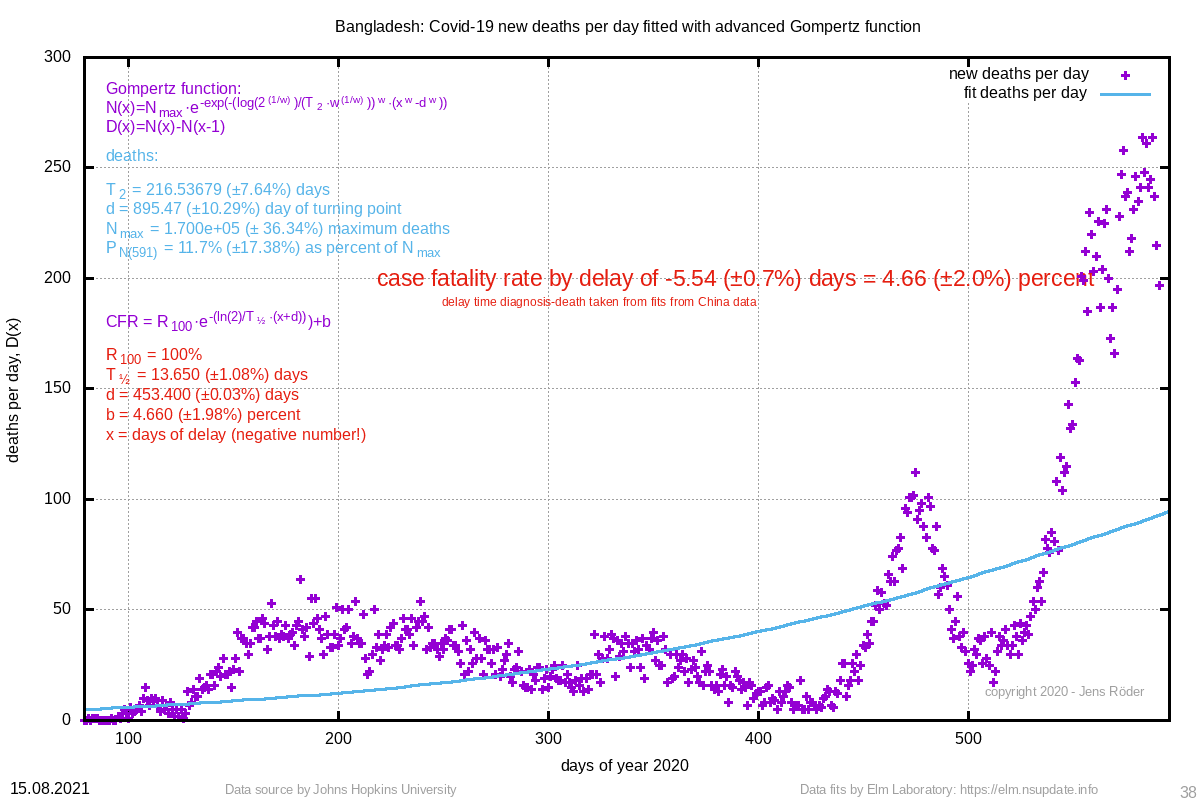 | 216.537 (±7.6%) | 895.47 (±10.3%) |
| 19541 | 16416 (±0.6%) | 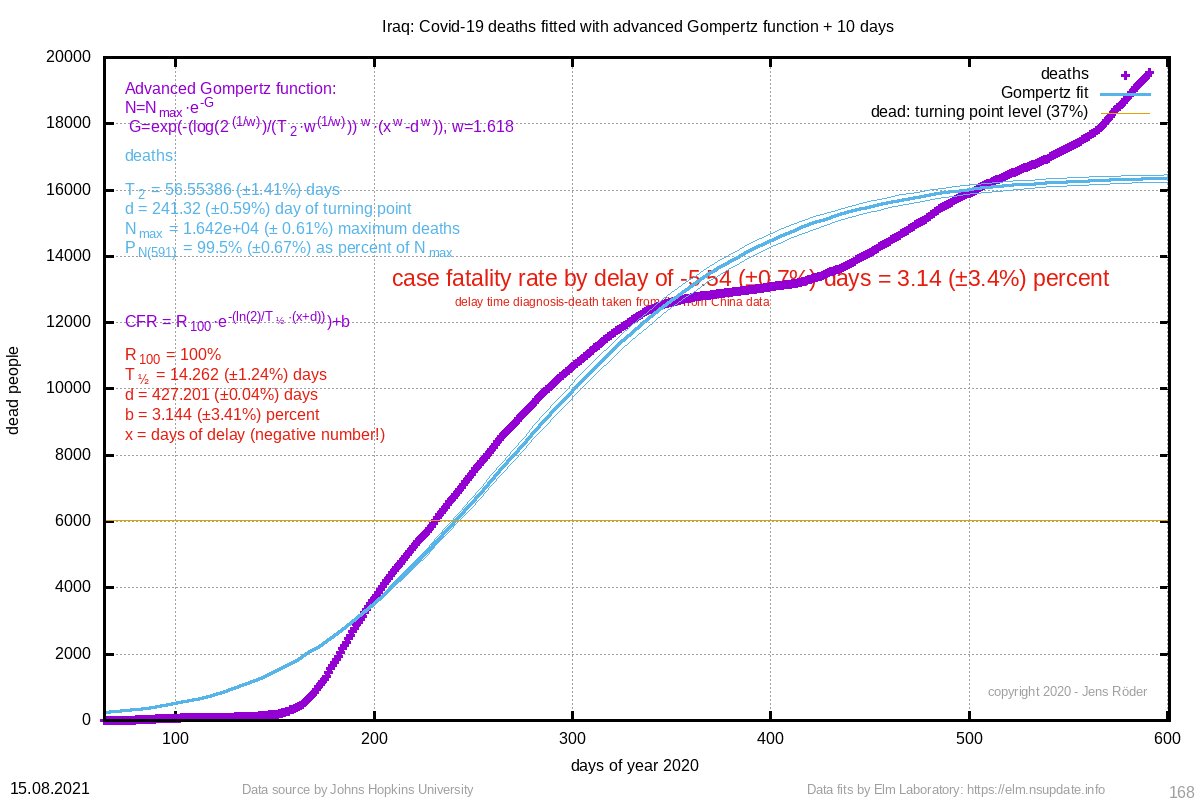 | Iraq | 3.14 (±3.4%) | 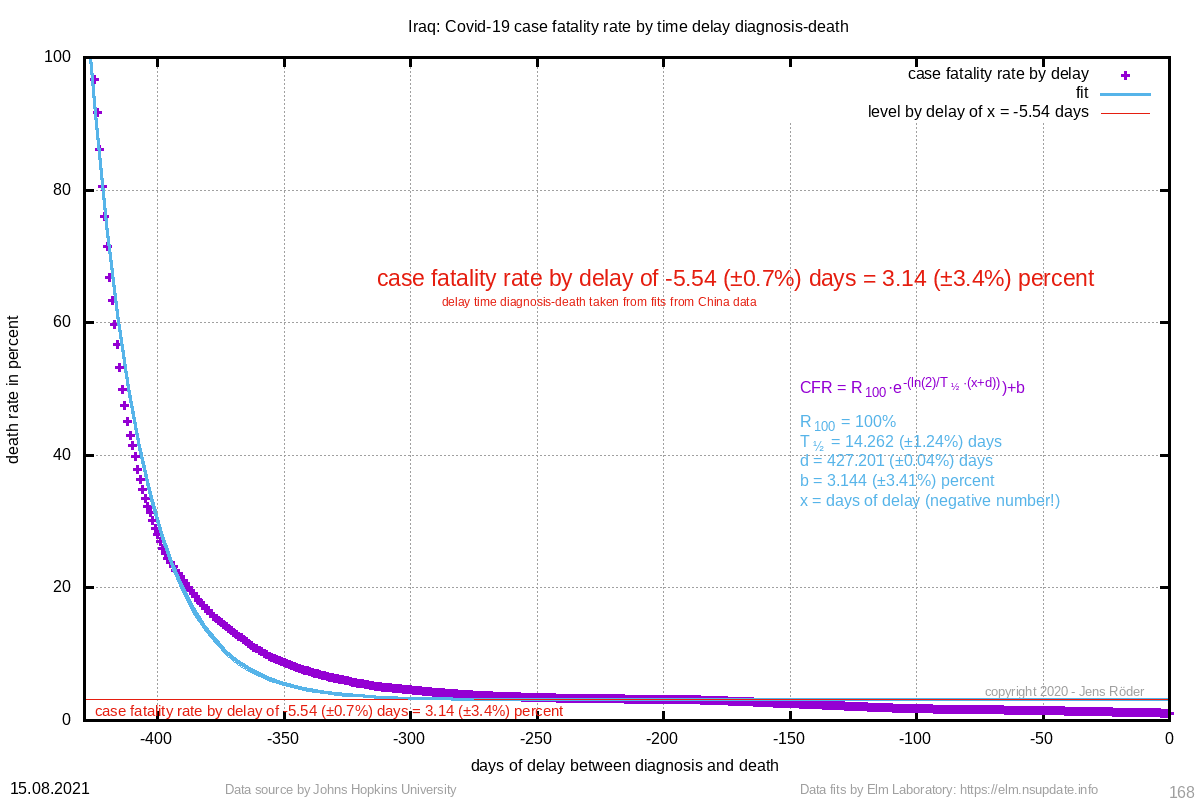 |  | 56.554 (±1.4%) | 241.32 (±0.6%) |
| 18332 | 20013 (±0.7%) |  | Bulgaria | 0.03 (±1376.1%) | 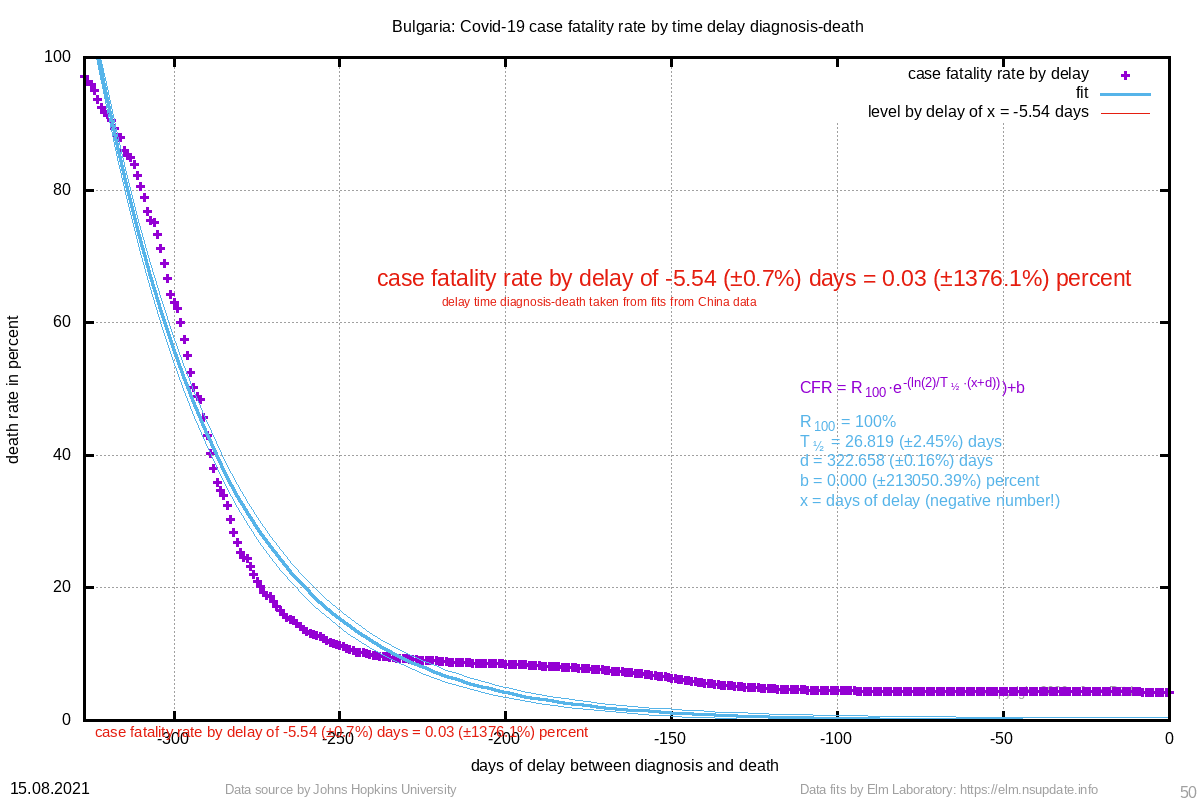 |  | 64.156 (±1.0%) | 377.58 (±0.2%) |
| 18152 | 17406 (±1.6%) |  | Bolivia | 8.12 (±2.1%) |  | 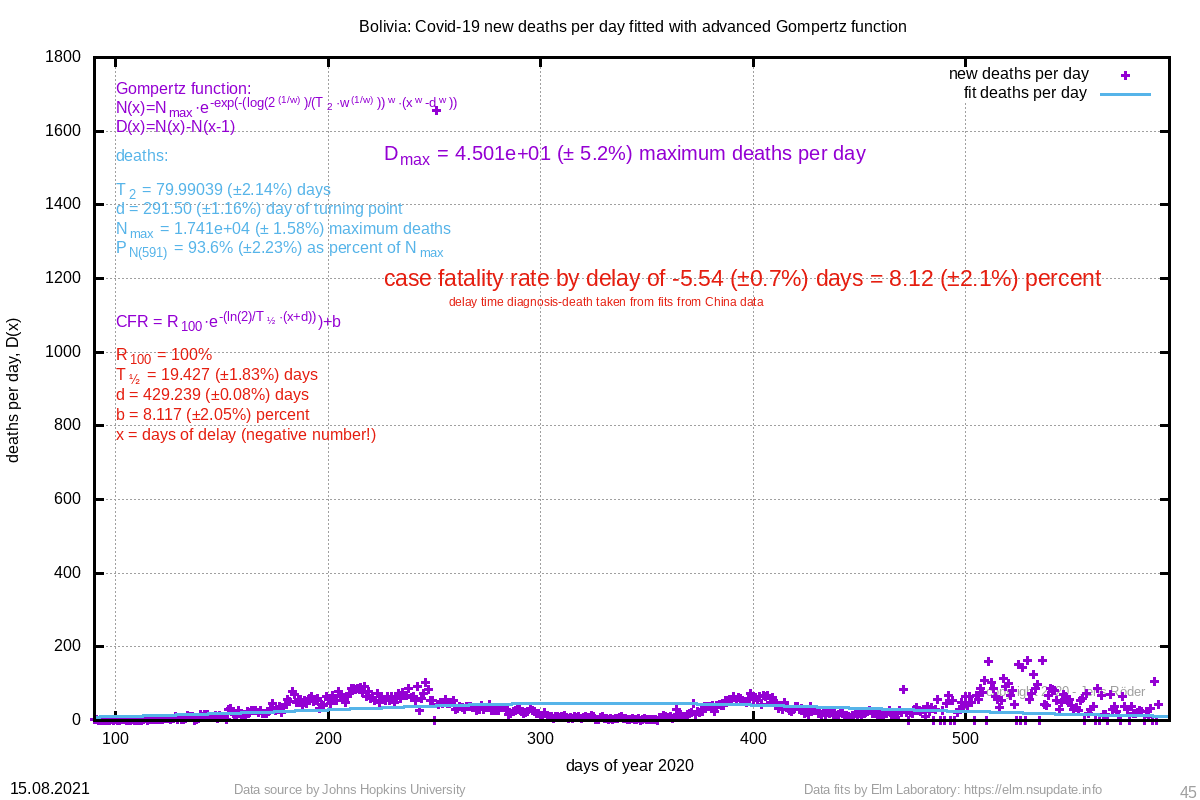 | 79.990 (±2.1%) | 291.50 (±1.2%) |
| 12544 | 13074 (±0.2%) | 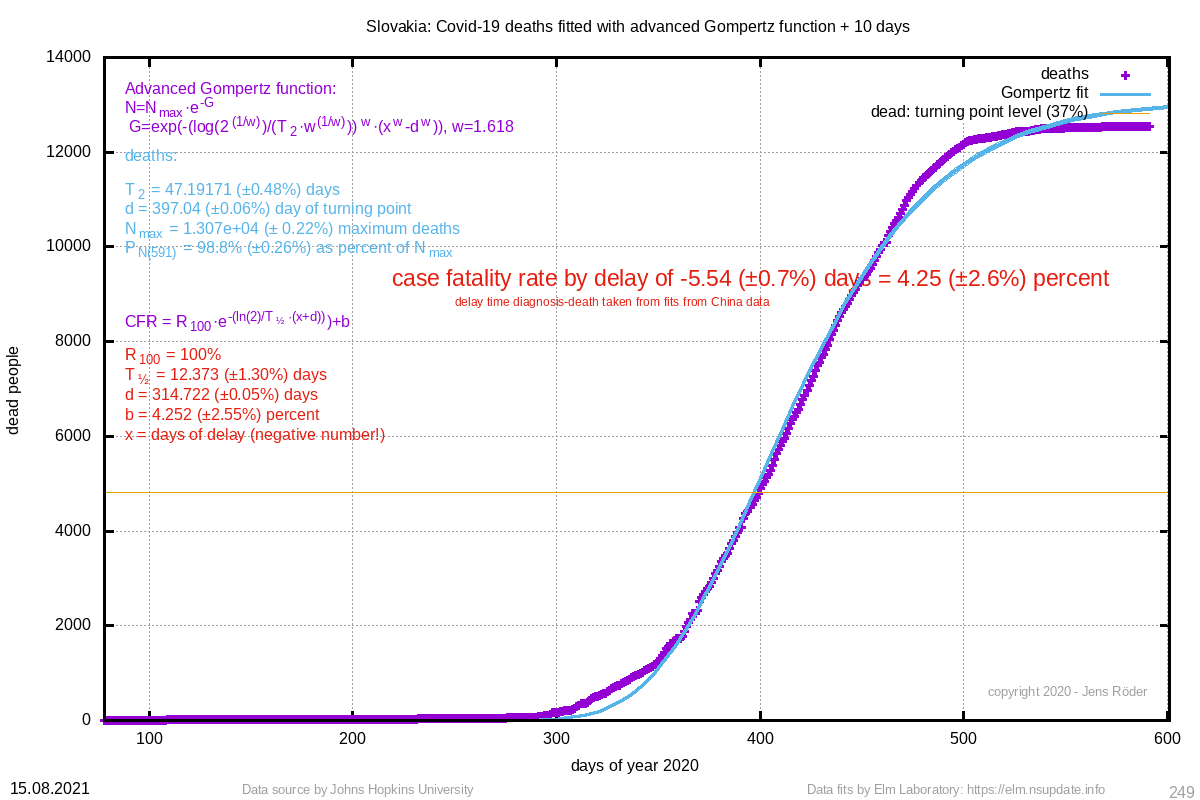 | Slovakia | 4.25 (±2.6%) |  | 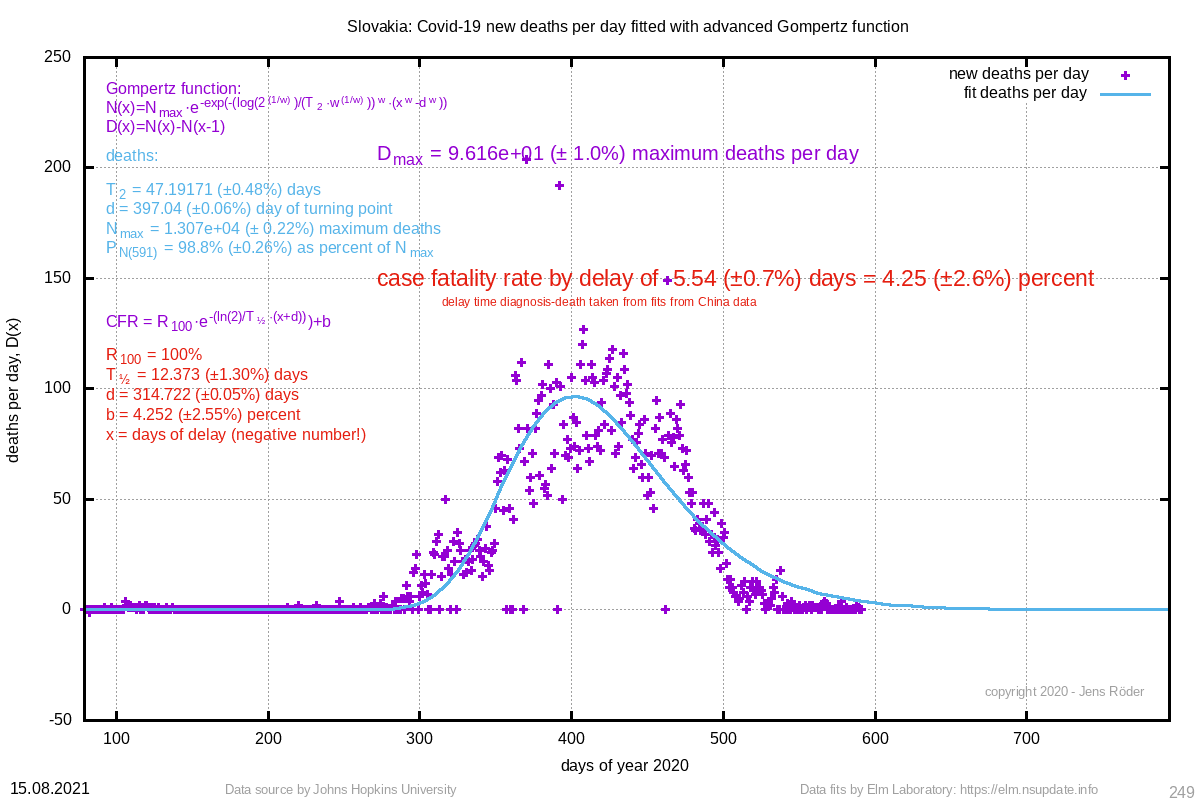 | 47.192 (±0.5%) | 397.04 (±0.1%) |
| 10791 | 20508 (±7.4%) | 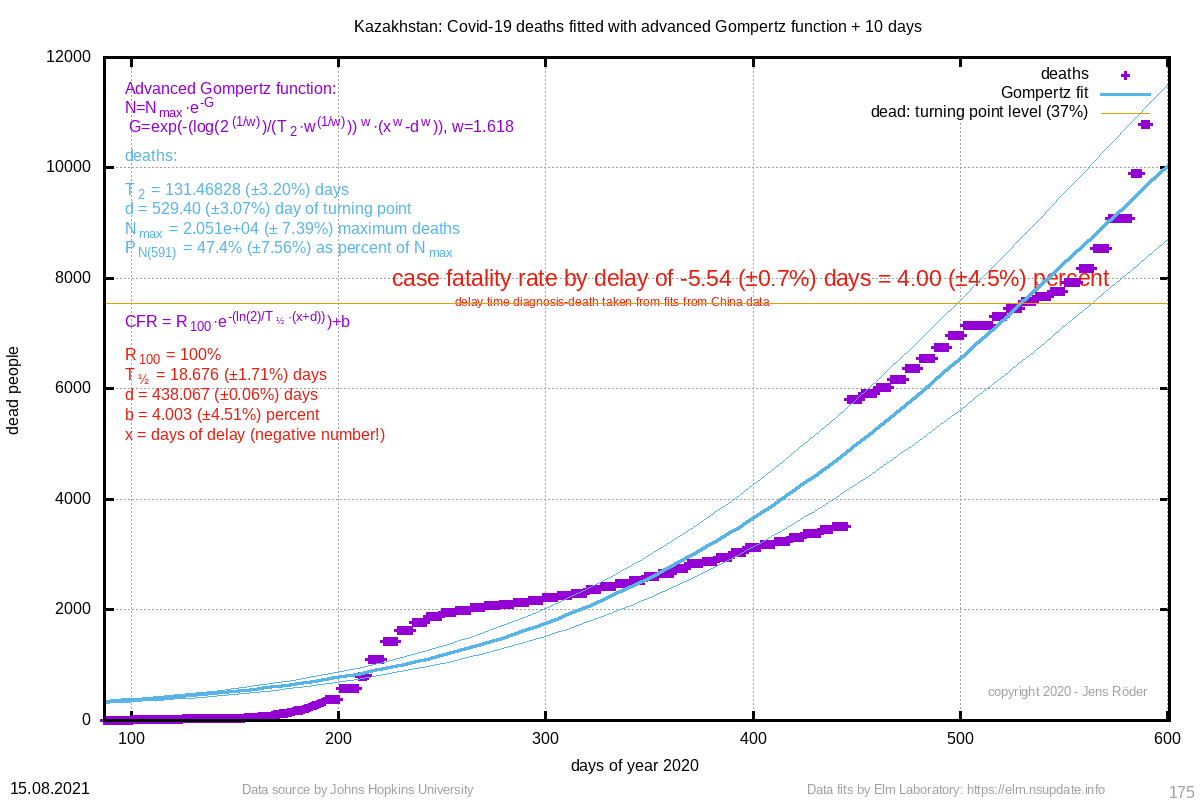 | Kazakhstan | 4.00 (±4.5%) | 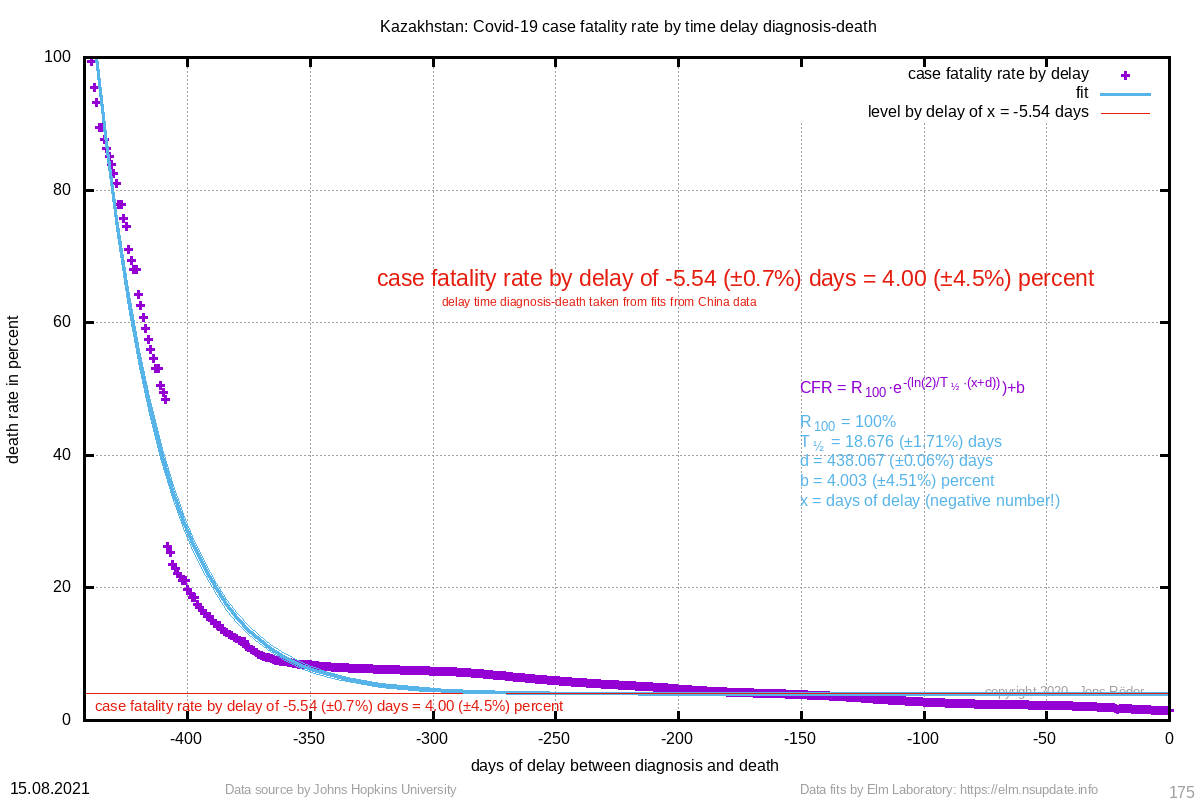 | 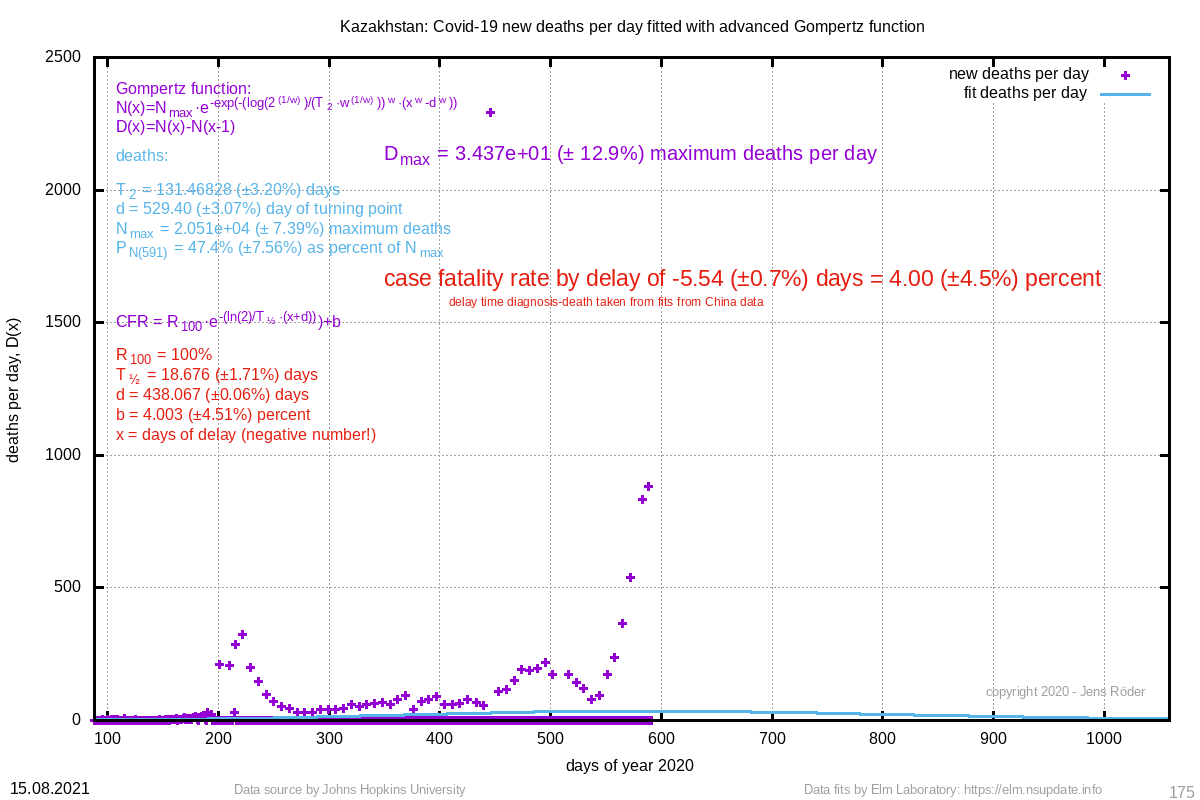 | 131.468 (±3.2%) | 529.40 (±3.1%) |
| 10753 | 7794927072 (±1368.2%) | 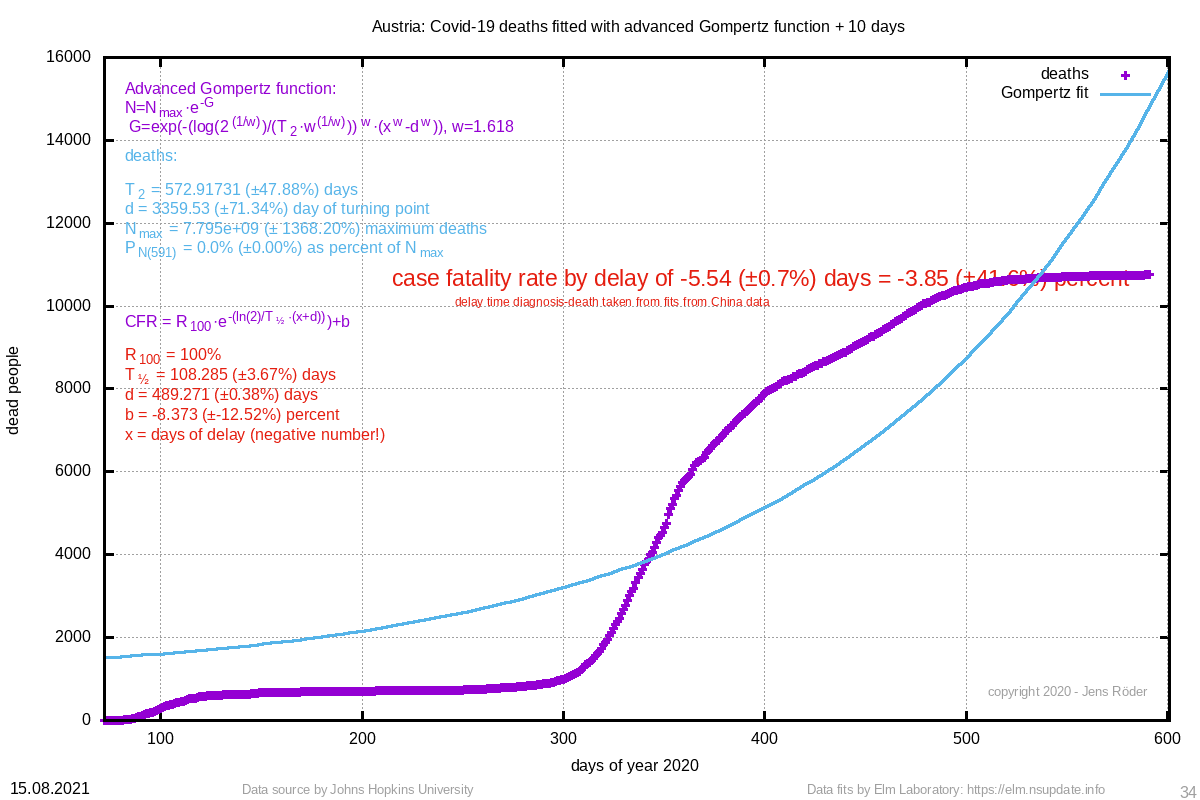 | Austria | -3.85 (±41.6%) |  | 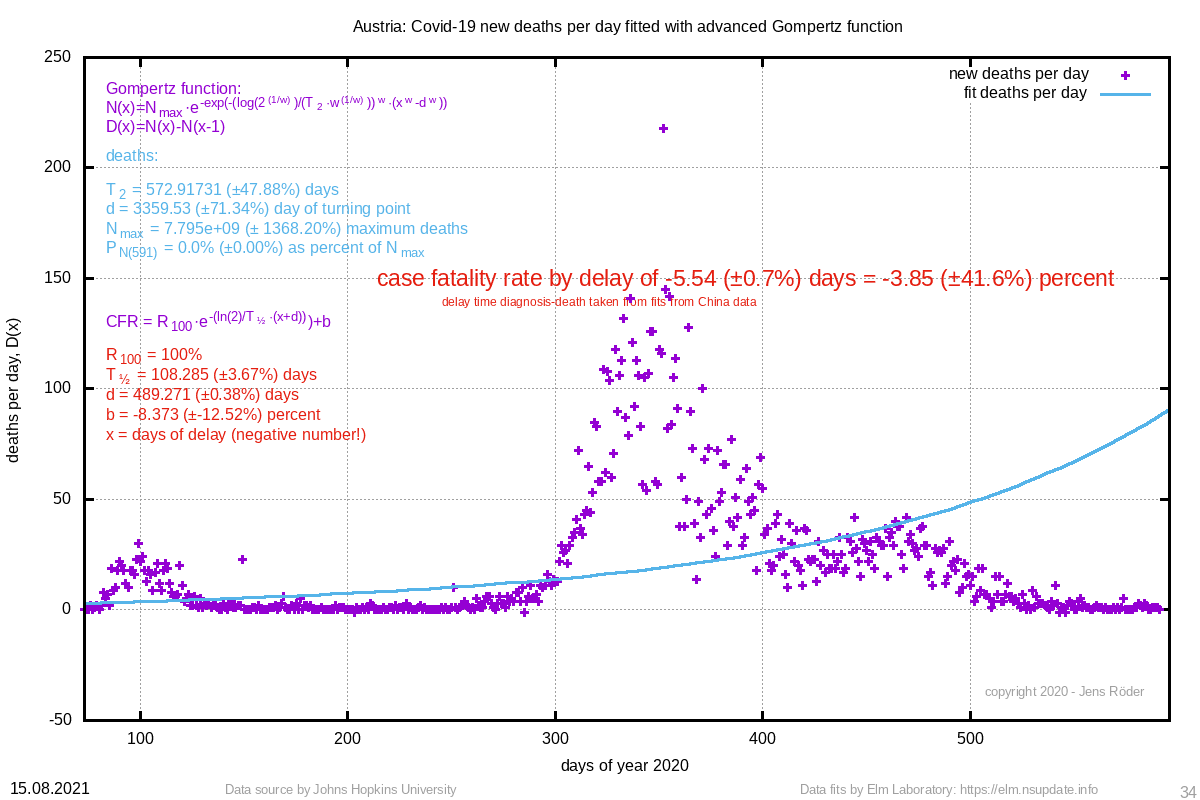 | 572.917 (±47.9%) | 3359.53 (±71.3%) |
| 10187 | 11478 (±1.2%) | 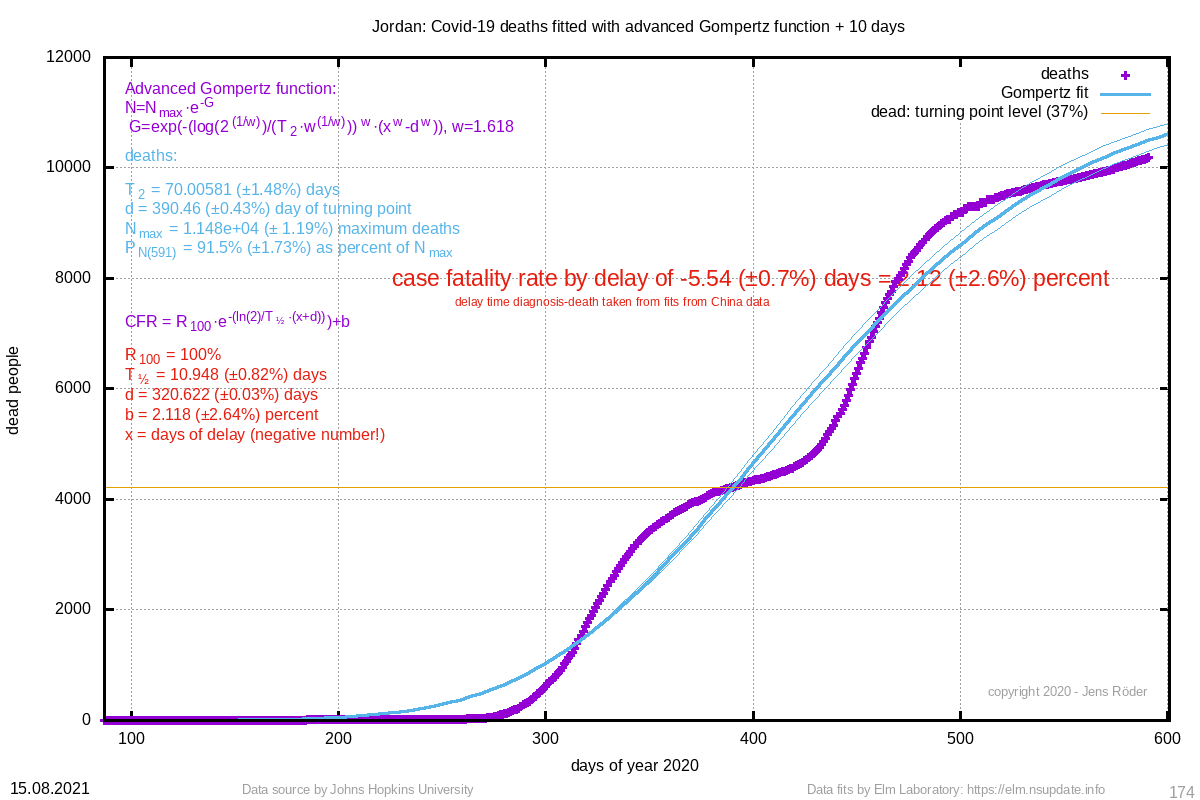 | Jordan | 2.12 (±2.6%) | 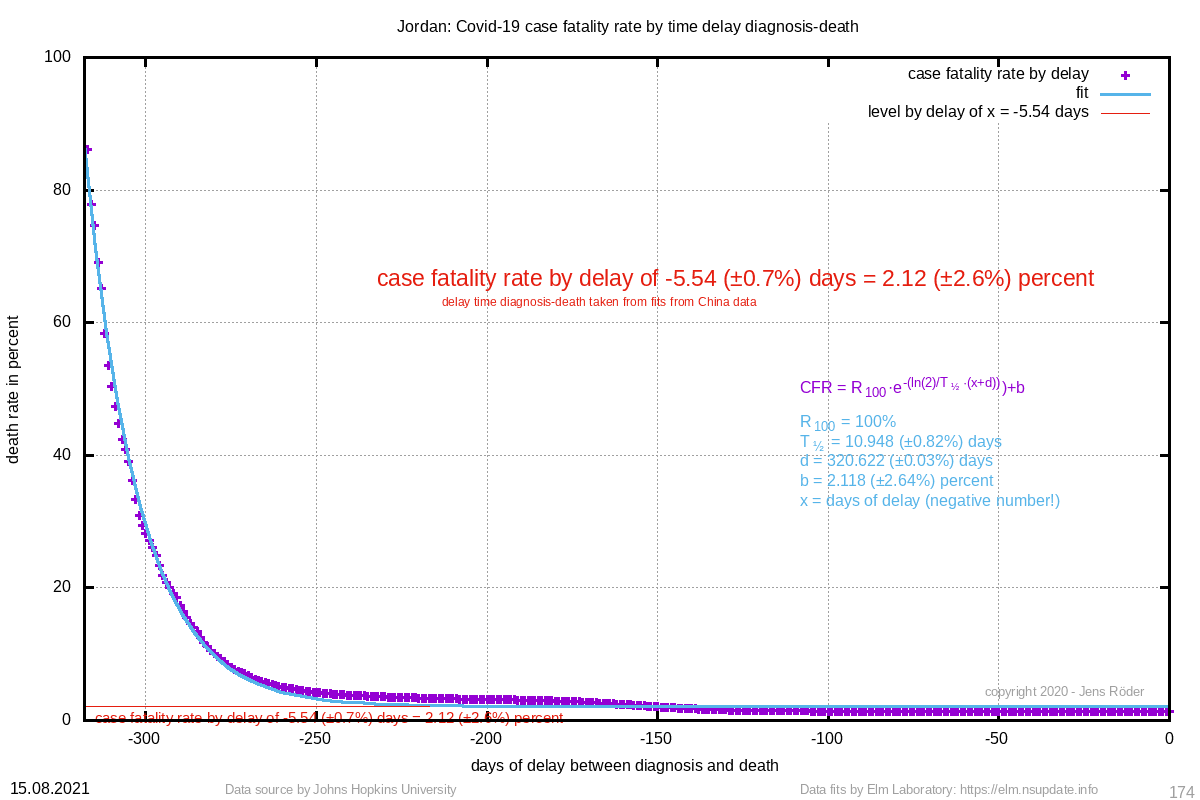 | 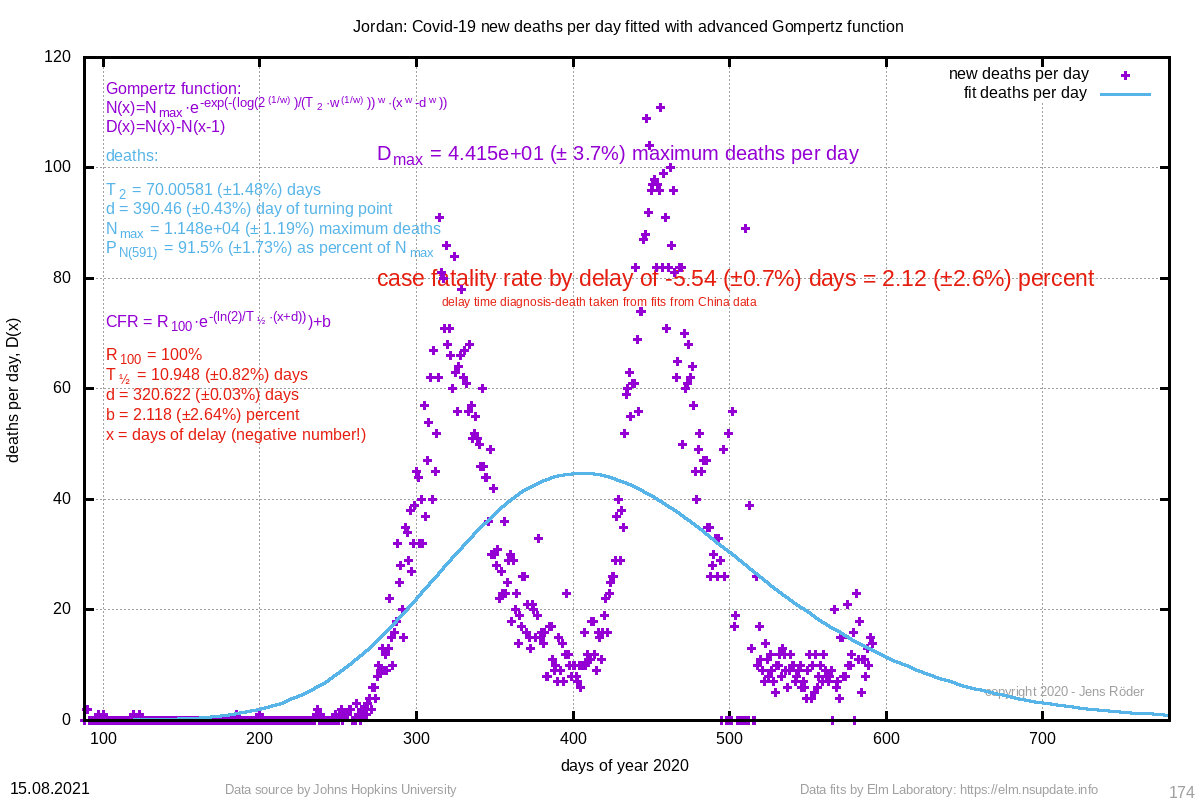 | 70.006 (±1.5%) | 390.46 (±0.4%) |
| 9701 | 11548 (±1.0%) | 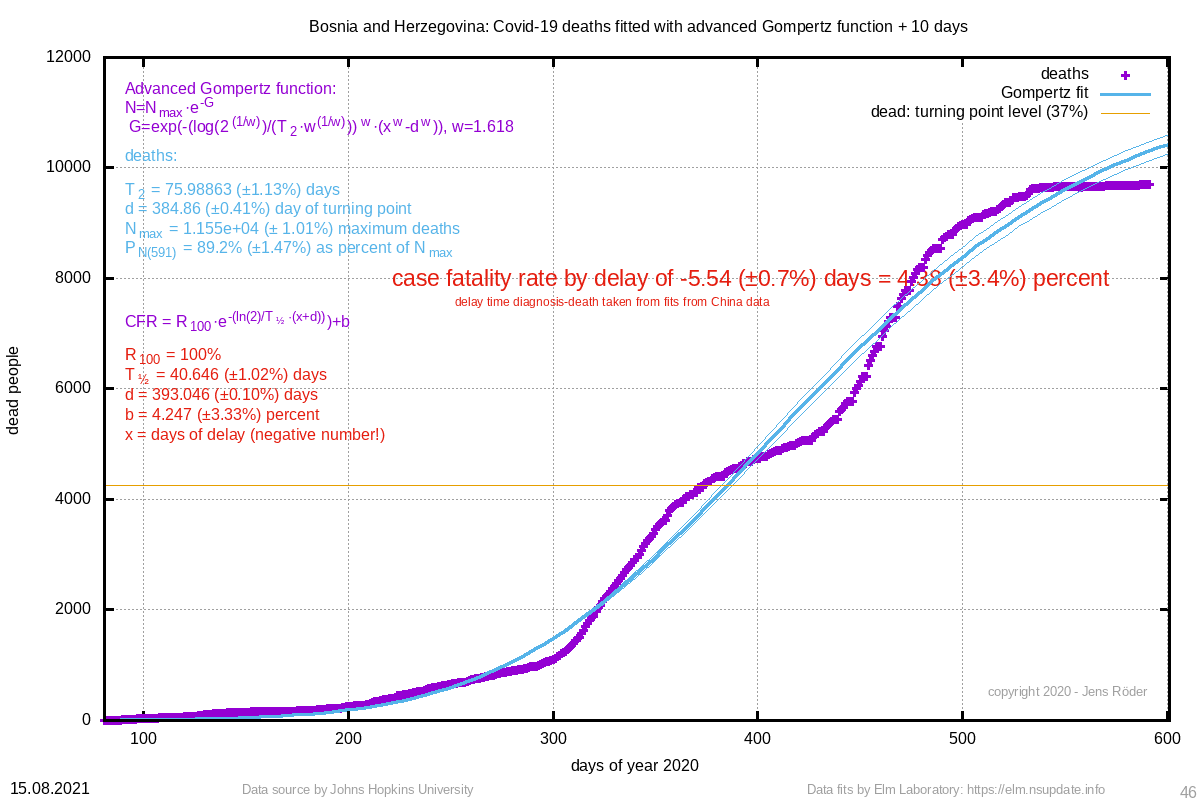 | Bosnia and Herzegovina | 4.38 (±3.4%) | 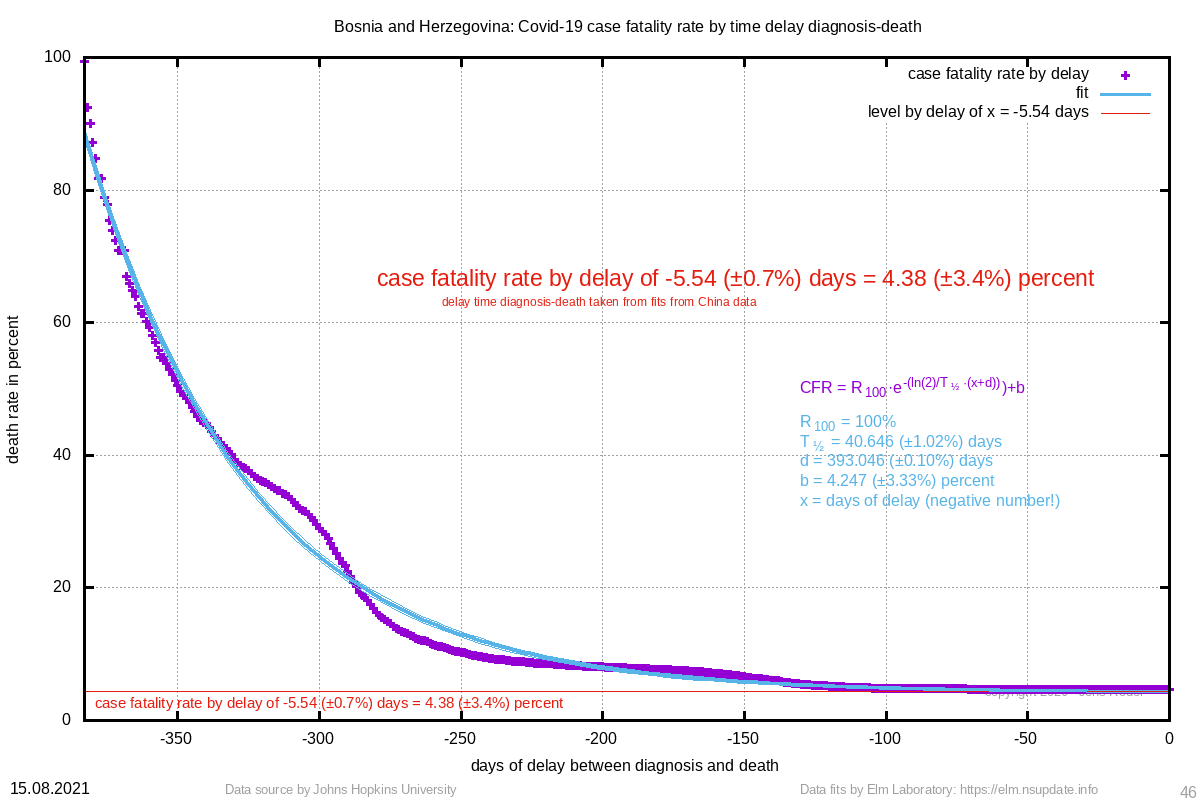 | 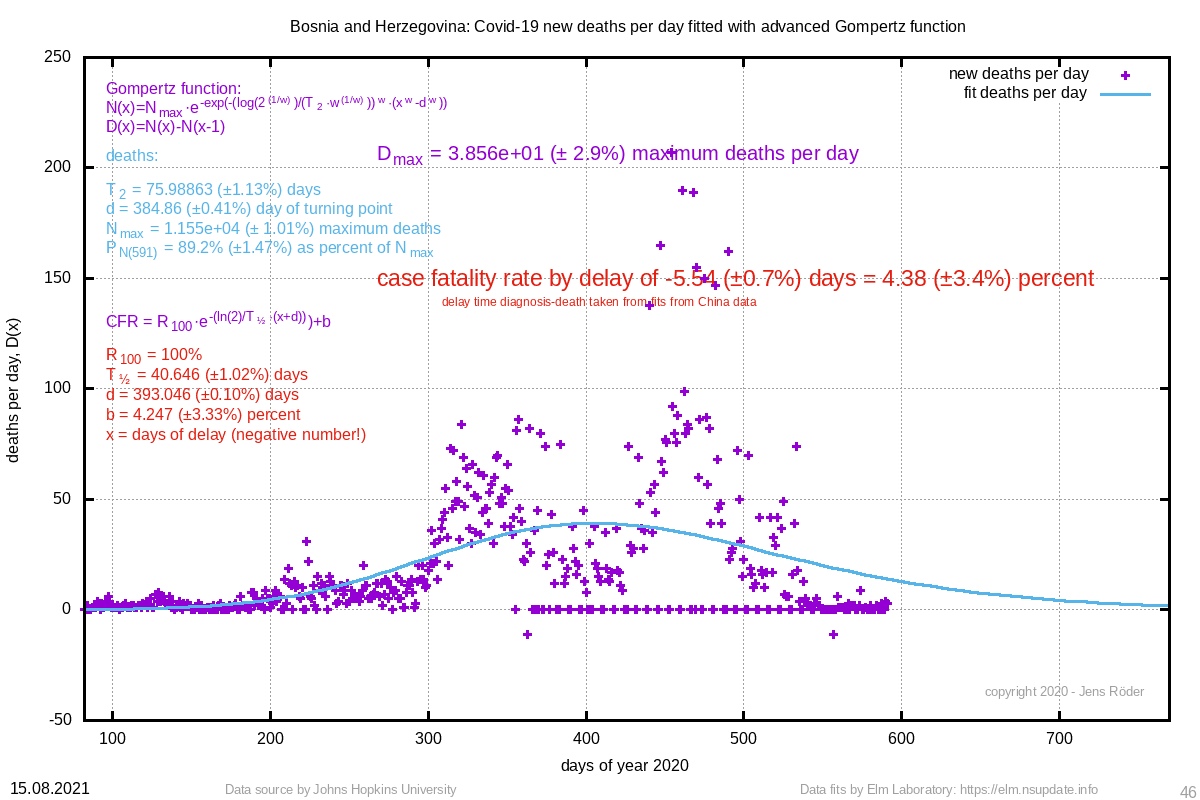 | 75.989 (±1.1%) | 384.86 (±0.4%) |
| 7000 | 160987727 (±538.3%) | 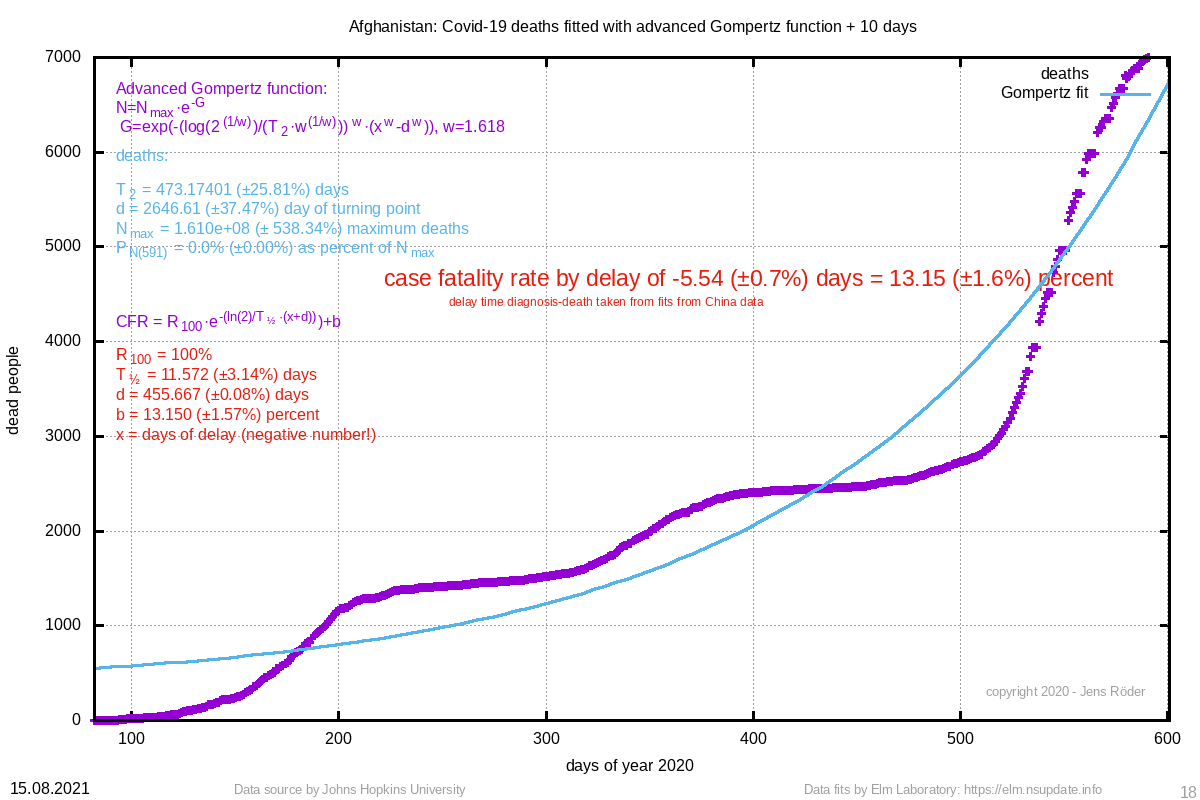 | Afghanistan | 13.15 (±1.6%) | 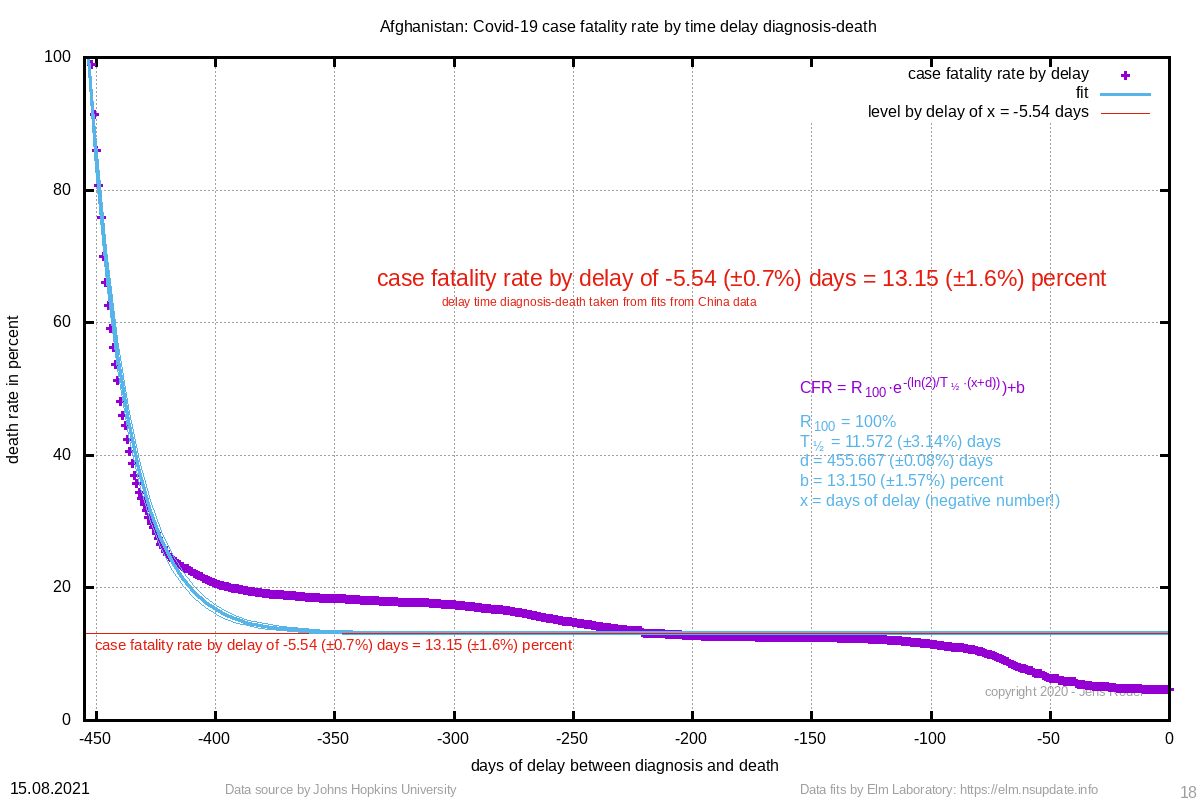 | 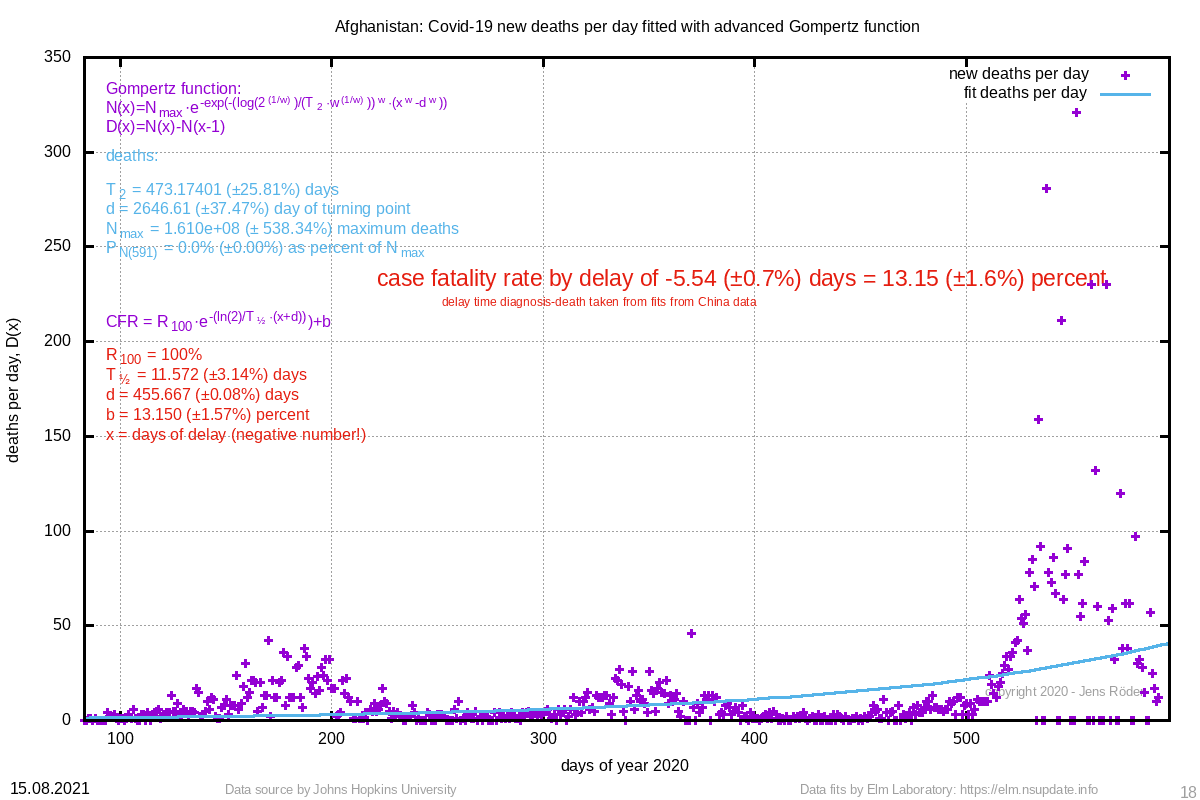 | 473.174 (±25.8%) | 2646.61 (±37.5%) |
| 5532 | 6818 (±1.1%) |  | North Macedonia | 2.54 (±8.8%) |  | 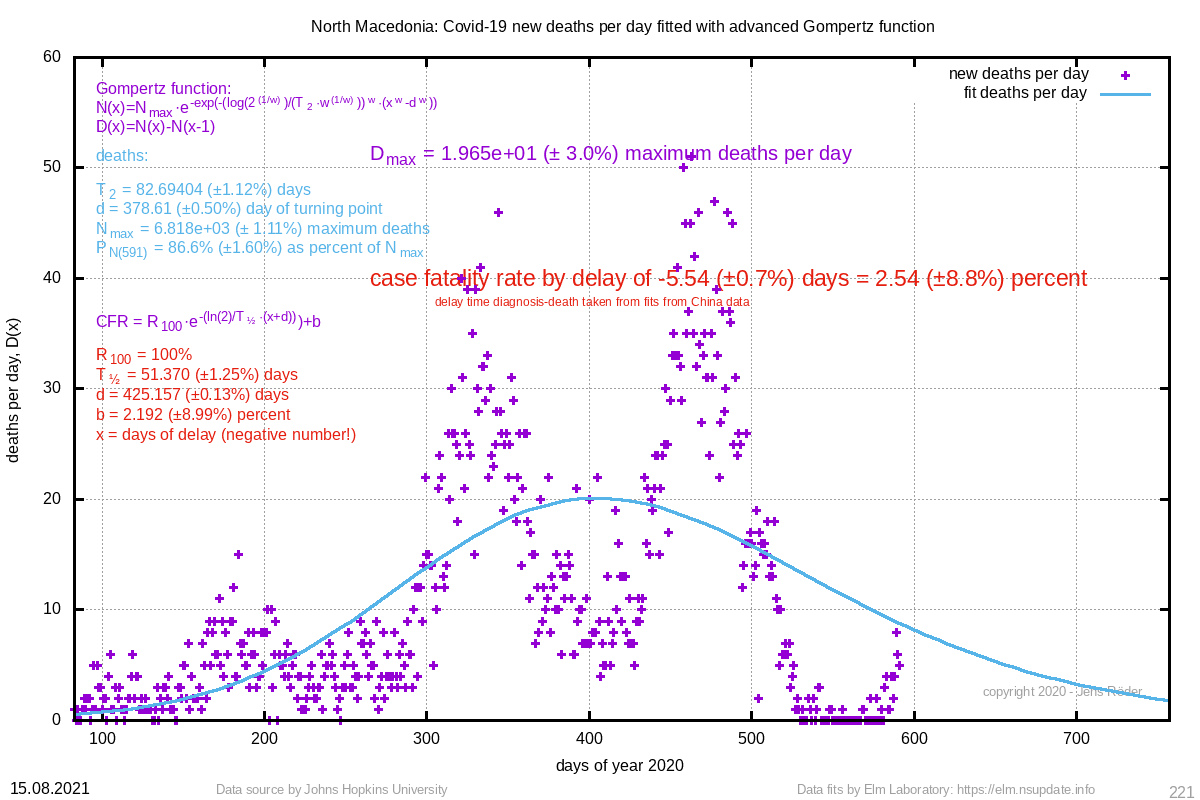 | 82.694 (±1.1%) | 378.61 (±0.5%) |
| 5125 | 5578 (±0.9%) | 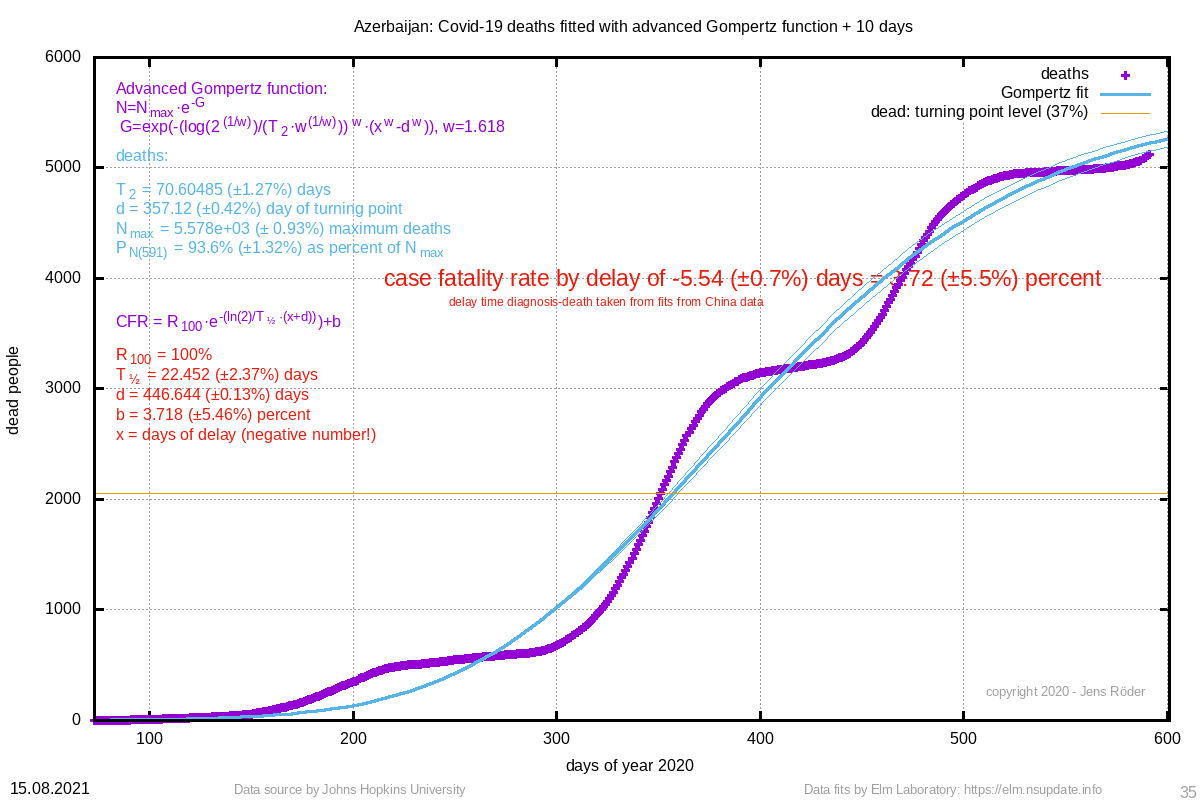 | Azerbaijan | 3.72 (±5.5%) | 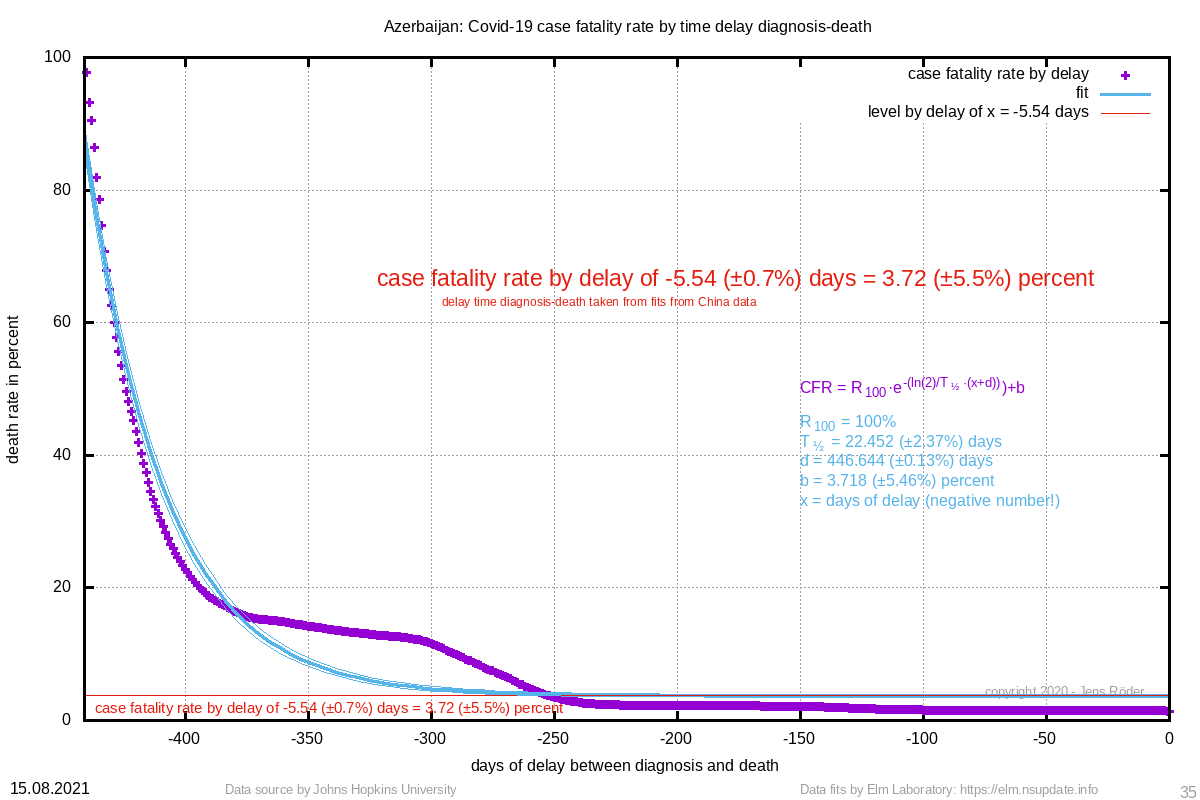 | 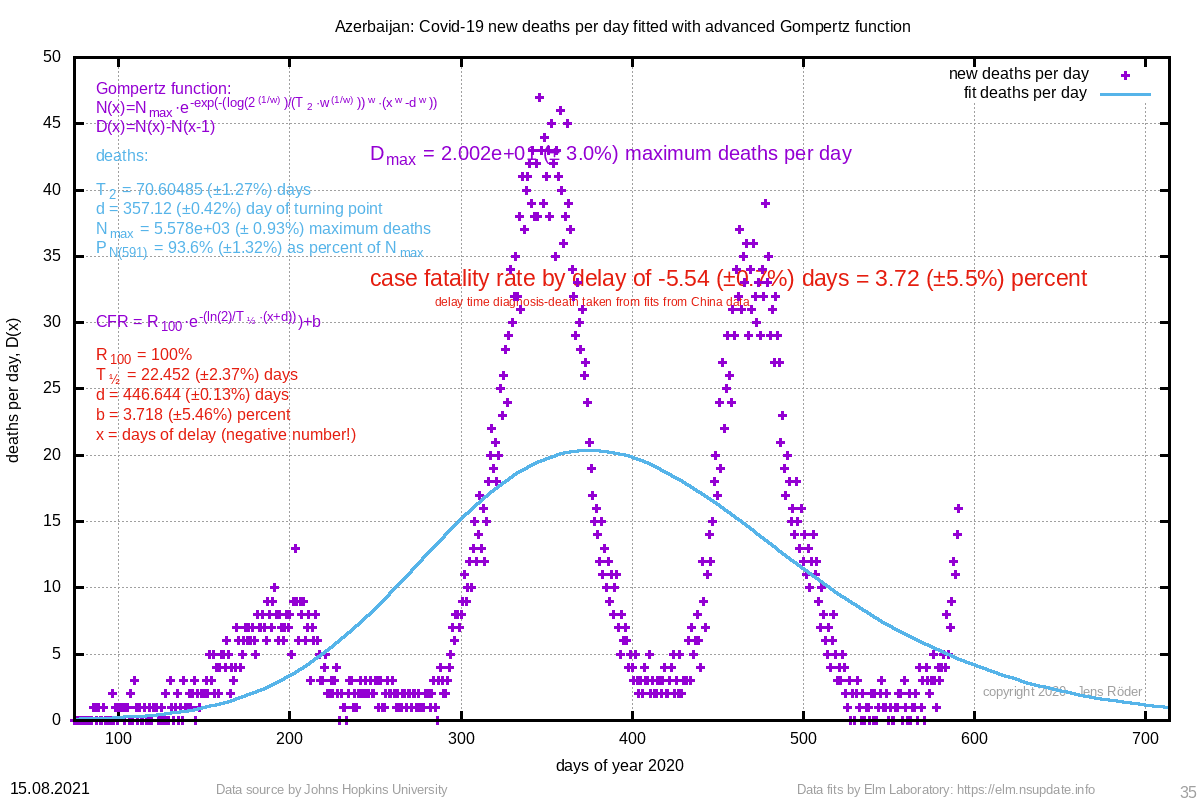 | 70.605 (±1.3%) | 357.12 (±0.4%) |
| 4730 | 4030 (±0.8%) | 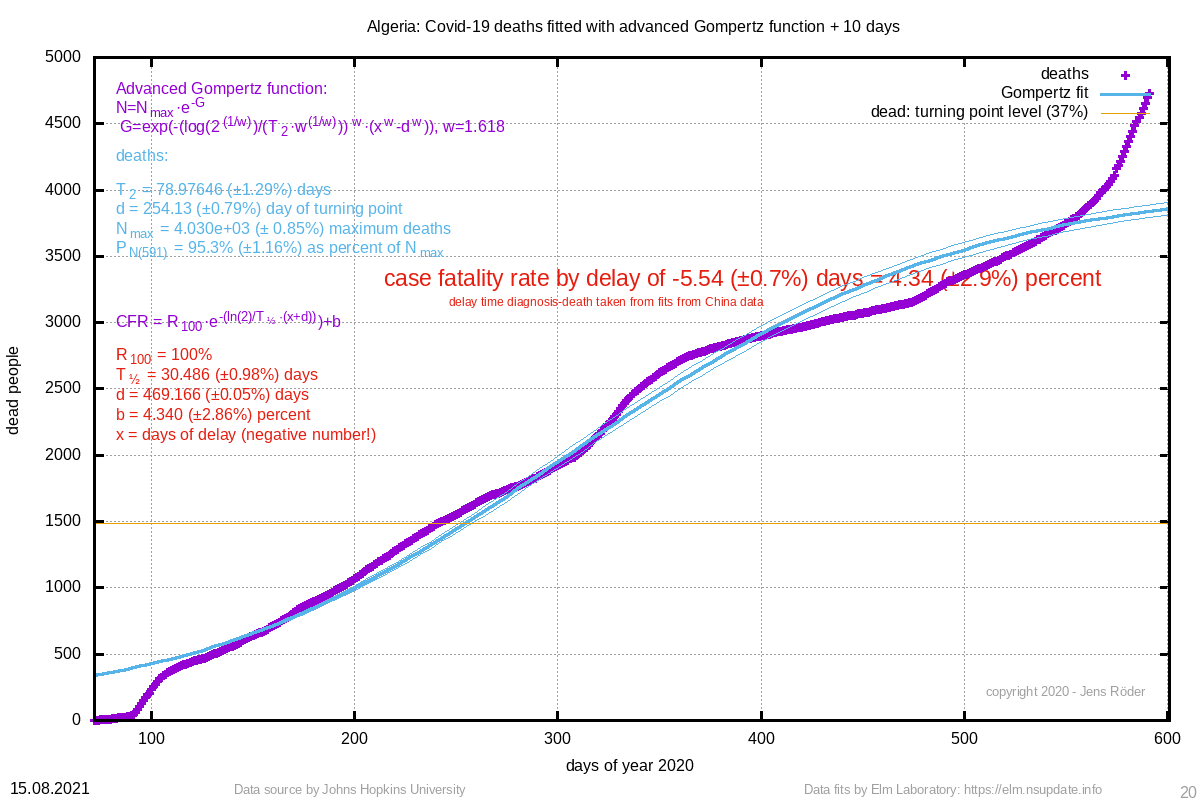 | Algeria | 4.34 (±2.9%) | 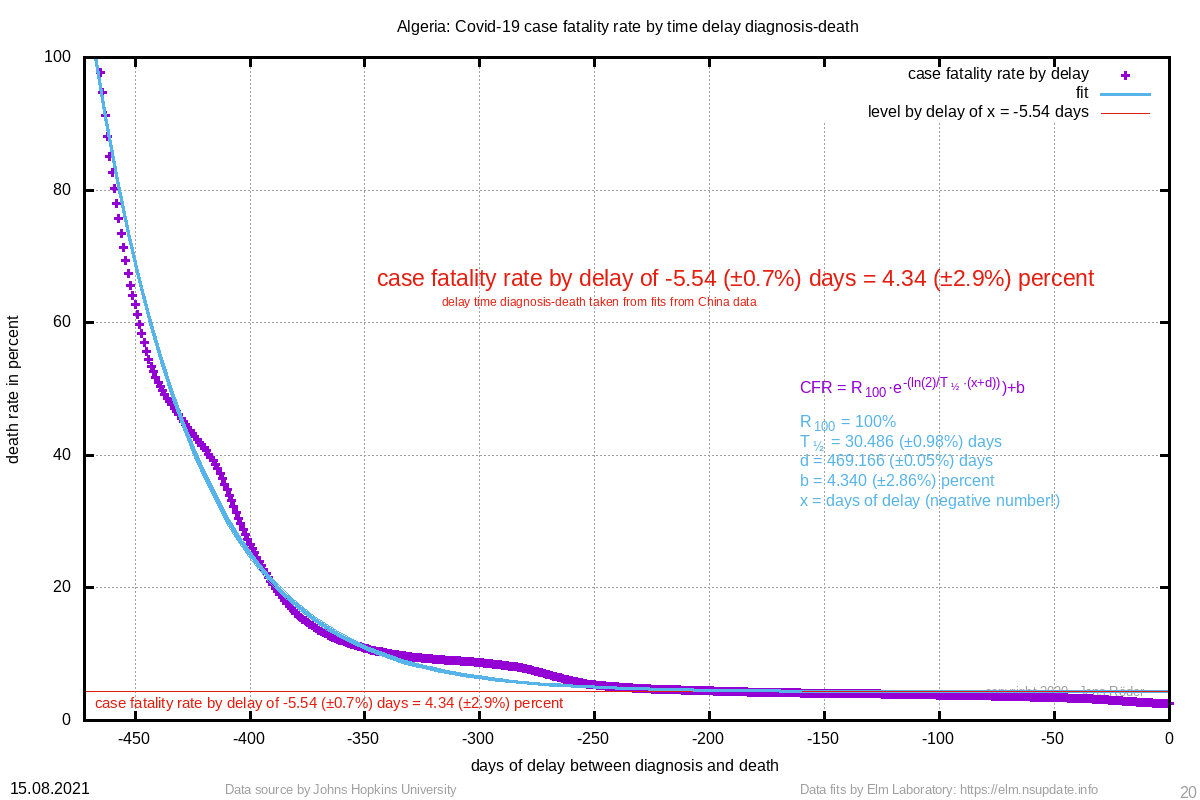 | 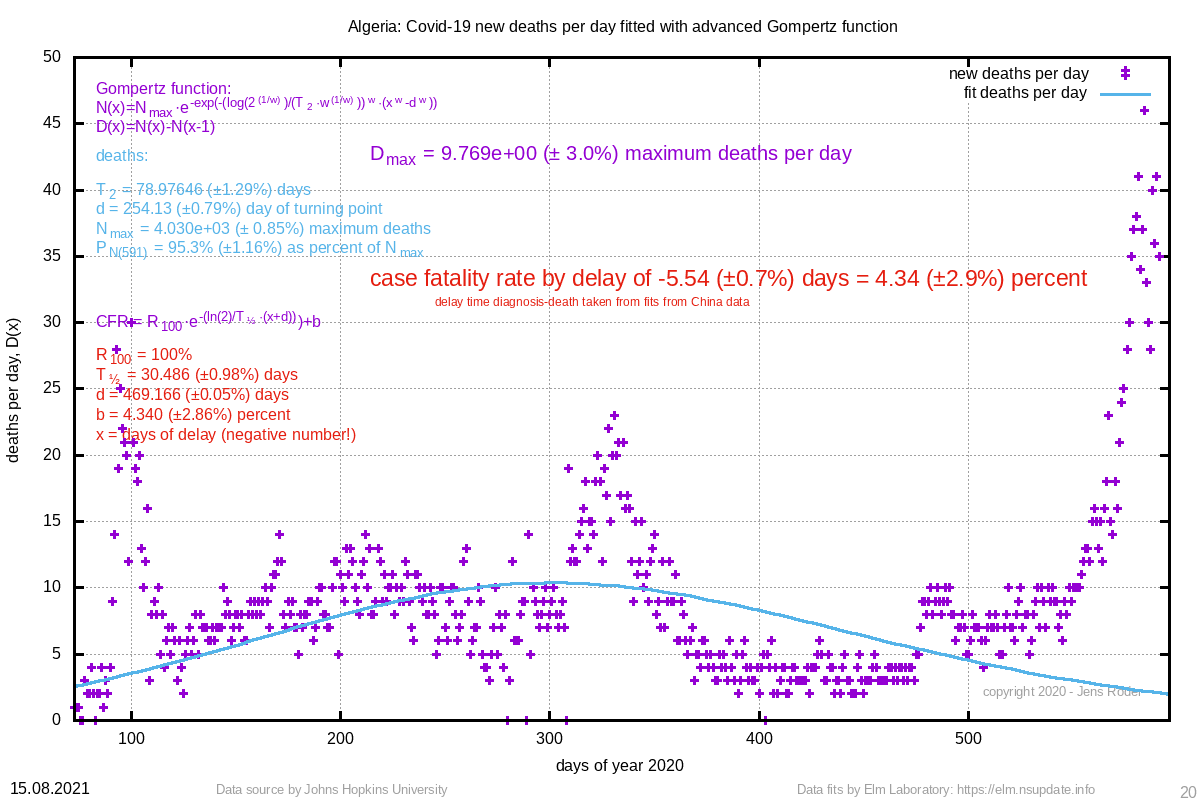 | 78.976 (±1.3%) | 254.13 (±0.8%) |
| 4678 | 5013 (±0.7%) | 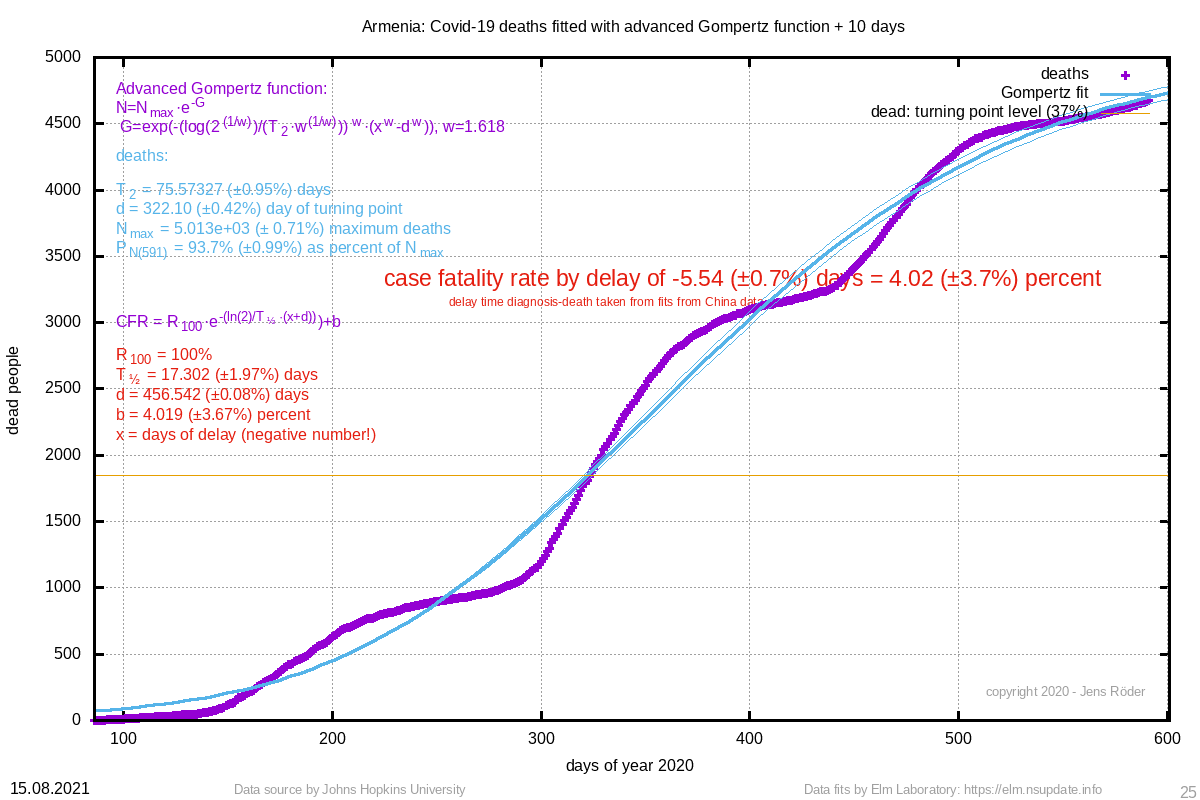 | Armenia | 4.02 (±3.7%) | 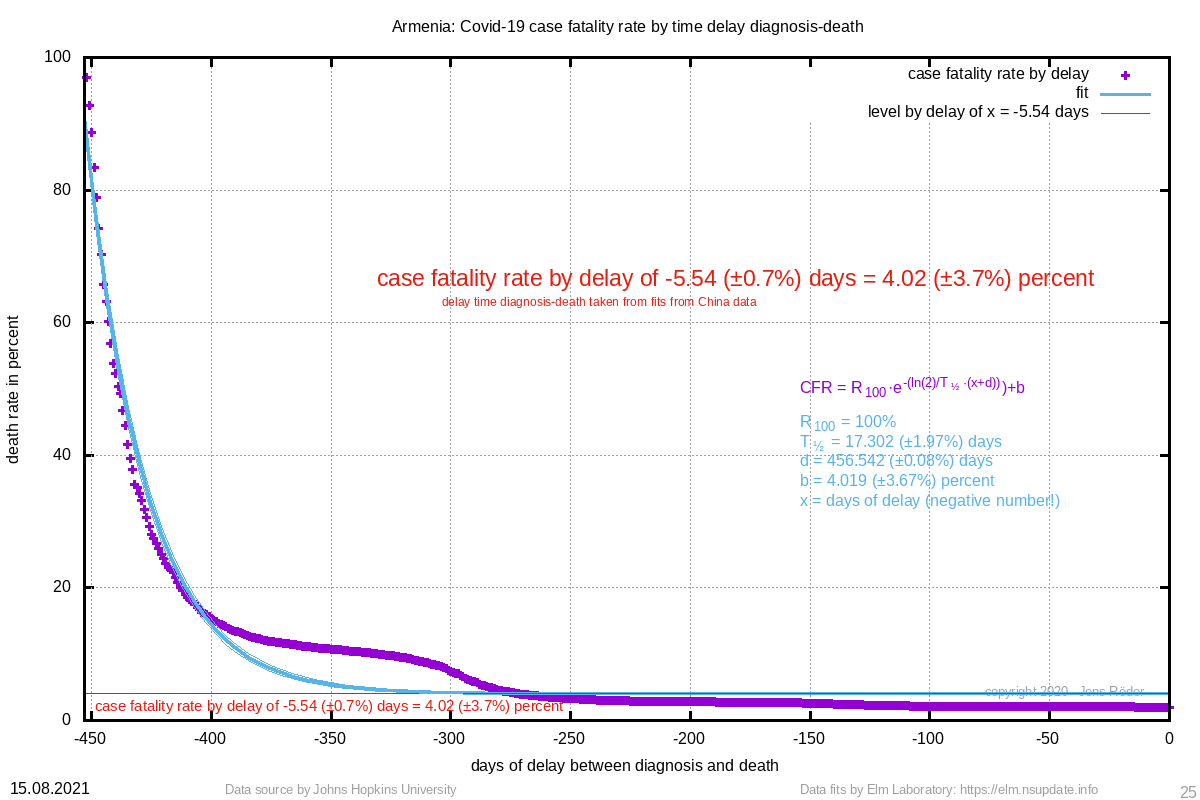 |  | 75.573 (±0.9%) | 322.10 (±0.4%) |
| 4460 | 5763 (±2.0%) | 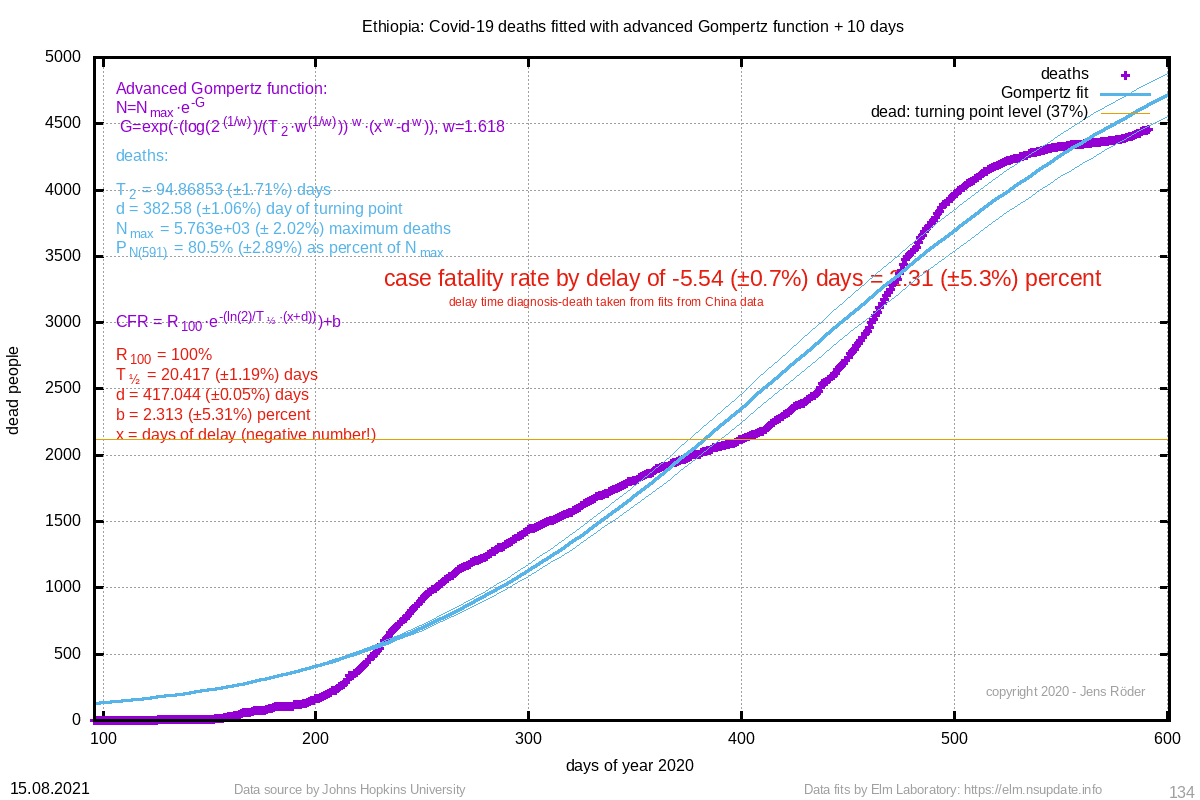 | Ethiopia | 2.31 (±5.3%) | 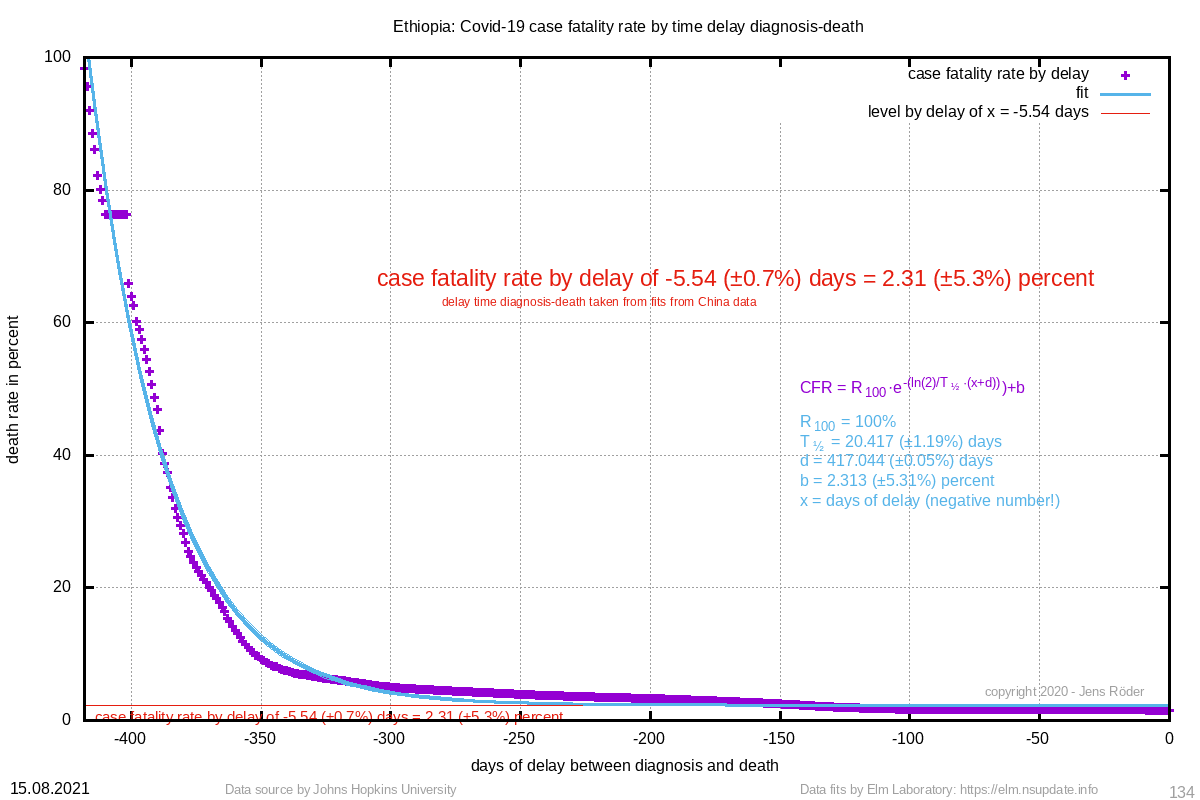 | 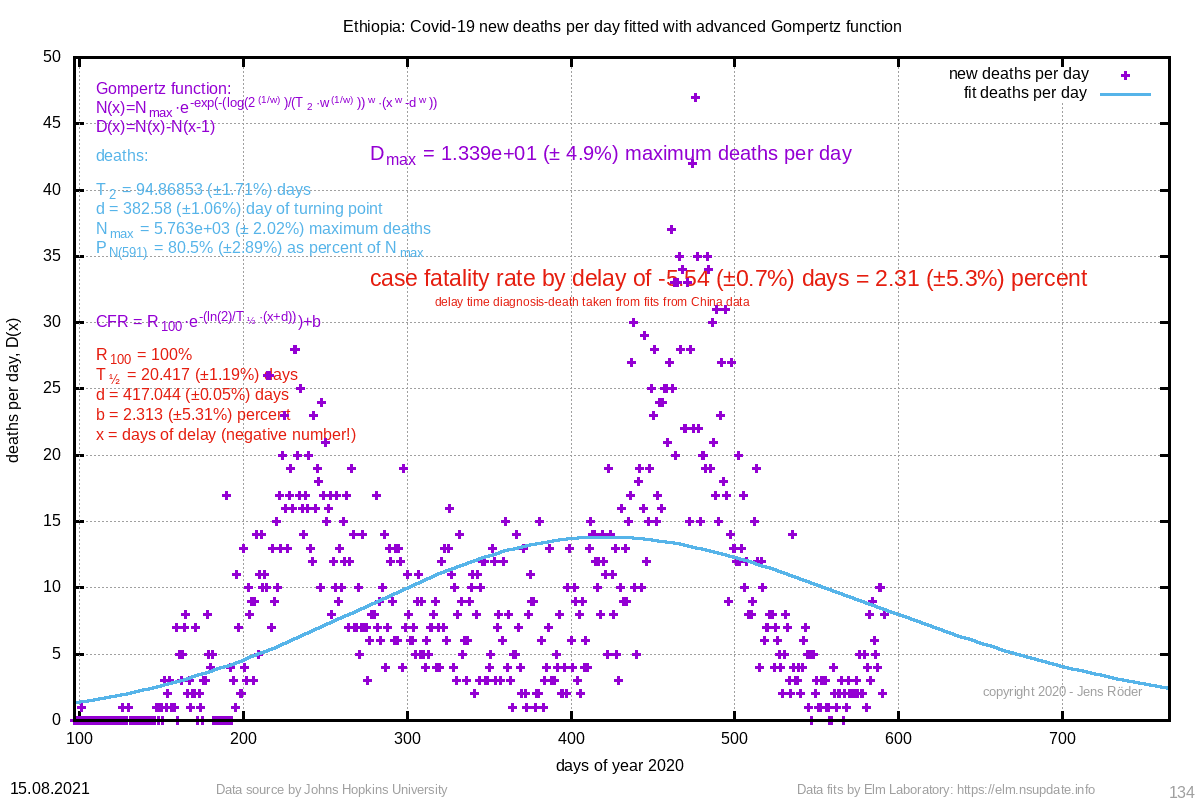 | 94.869 (±1.7%) | 382.58 (±1.1%) |
| 3976 | 3922 (±0.8%) | 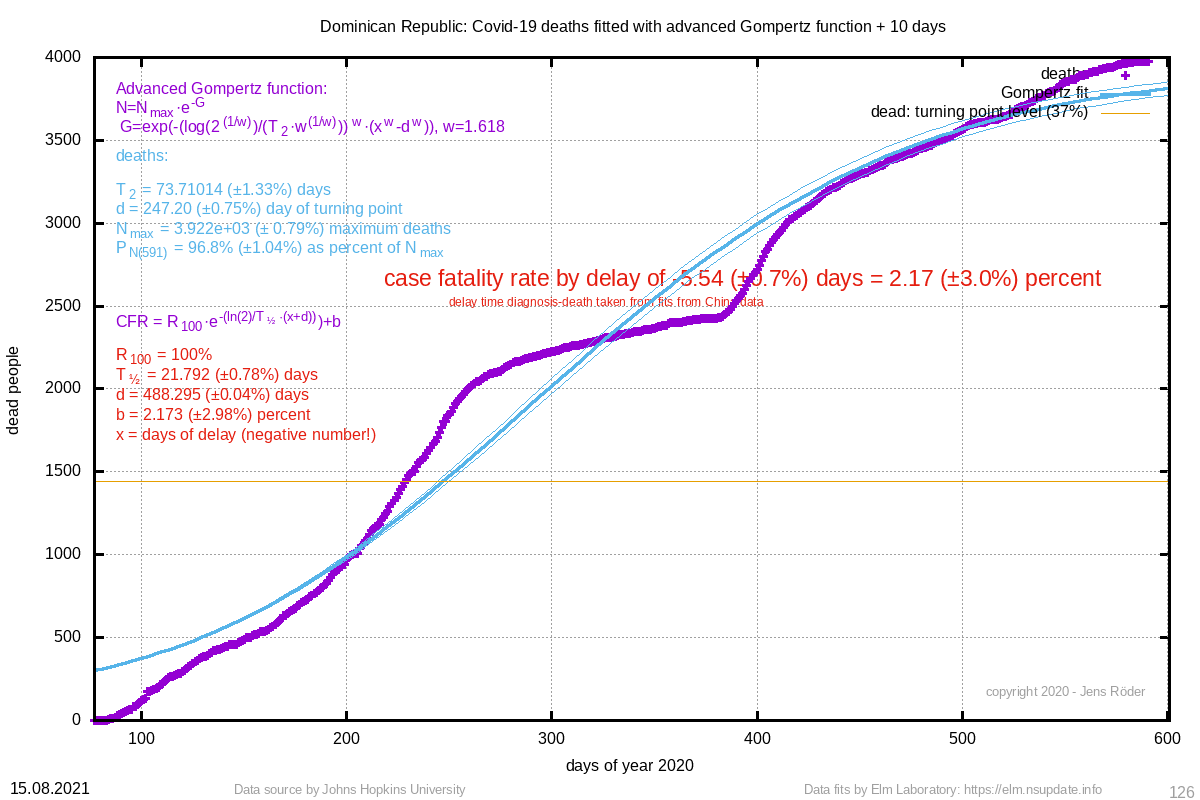 | Dominican Republic | 2.17 (±3.0%) |  | 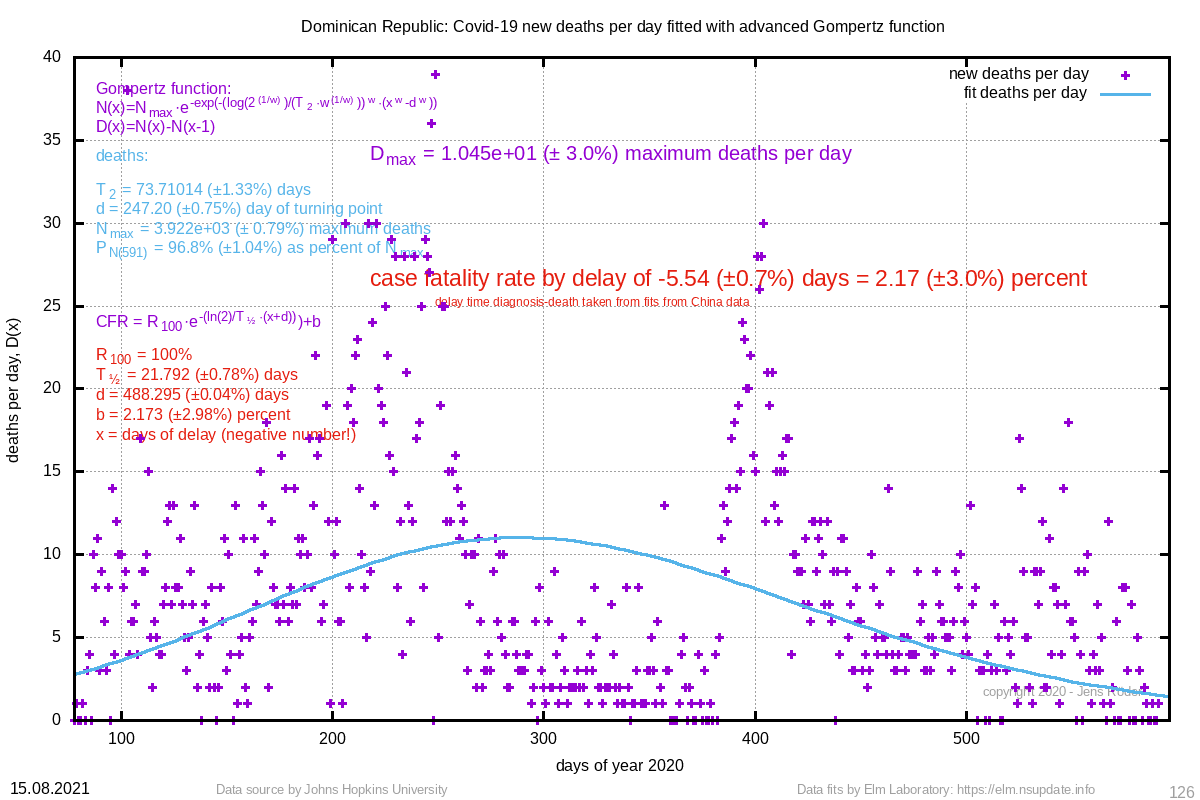 | 73.710 (±1.3%) | 247.20 (±0.8%) |
| 3842 | 3515509483 (±448.0%) | 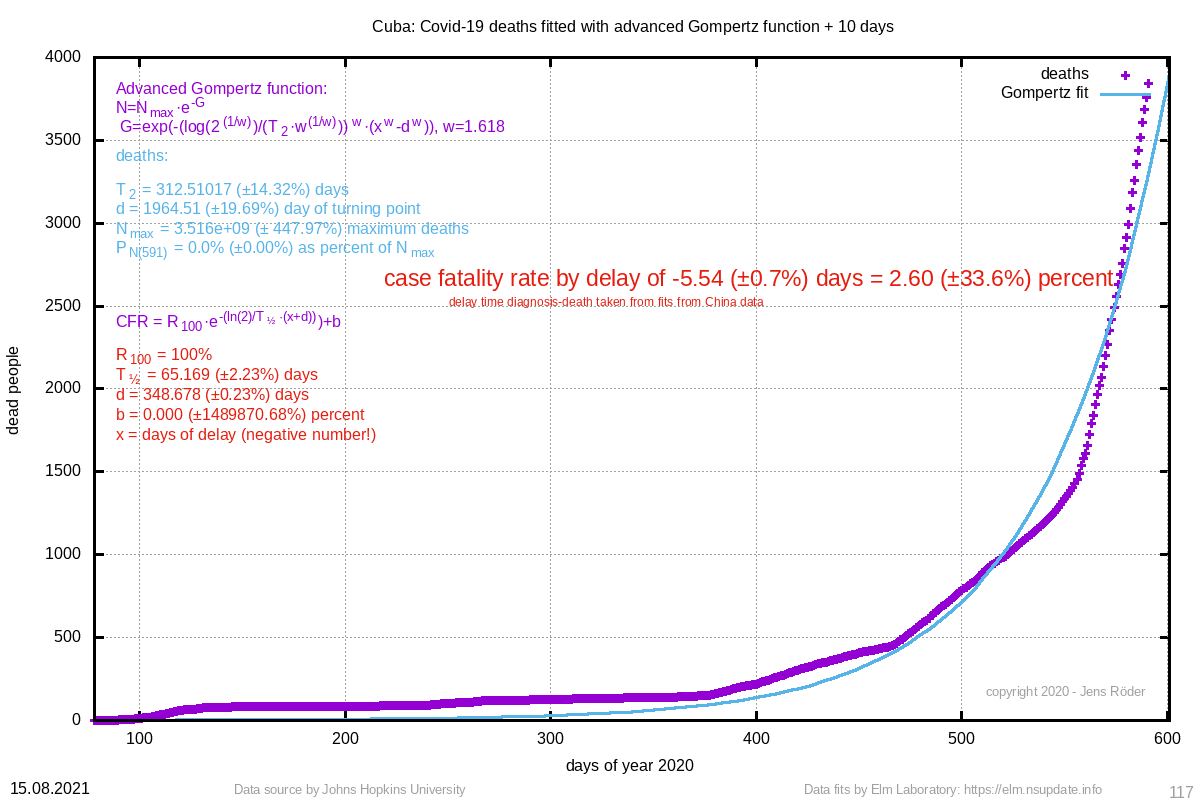 | Cuba | 2.60 (±33.6%) | 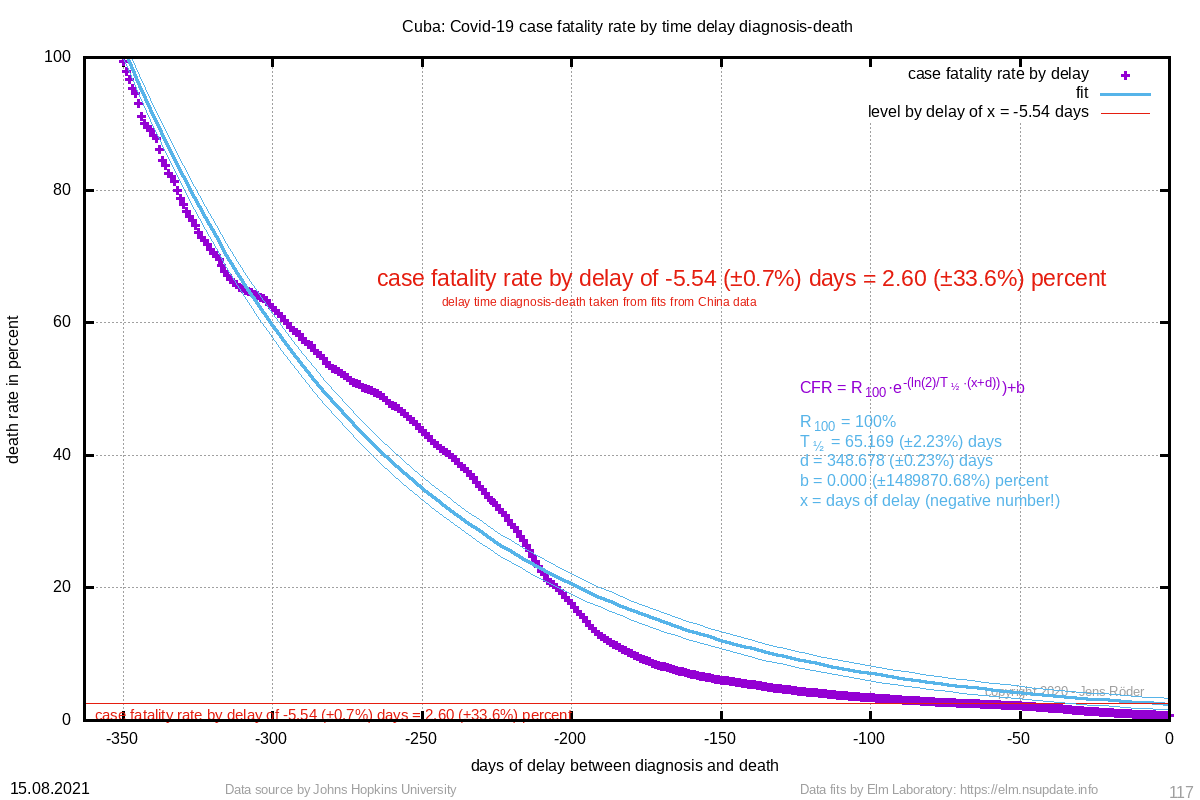 | 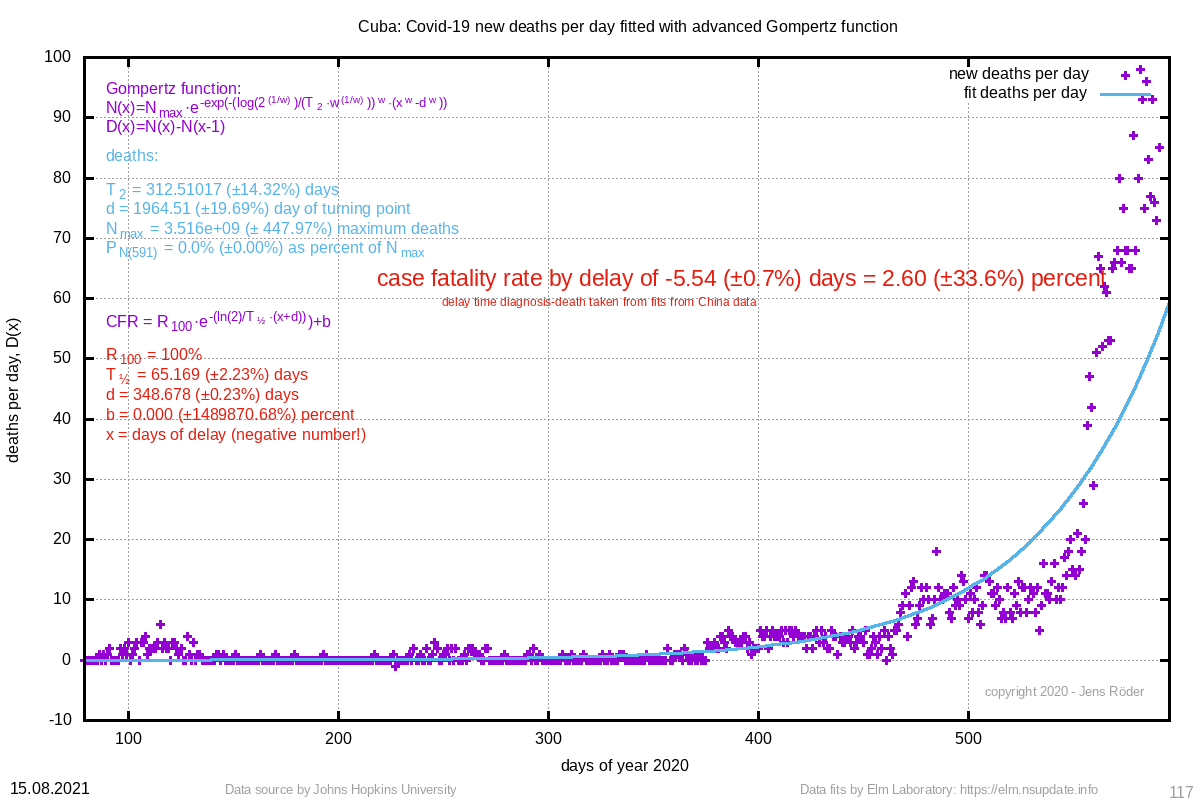 | 312.510 (±14.3%) | 1964.51 (±19.7%) |
| 3582 | 4983 (±1.1%) | 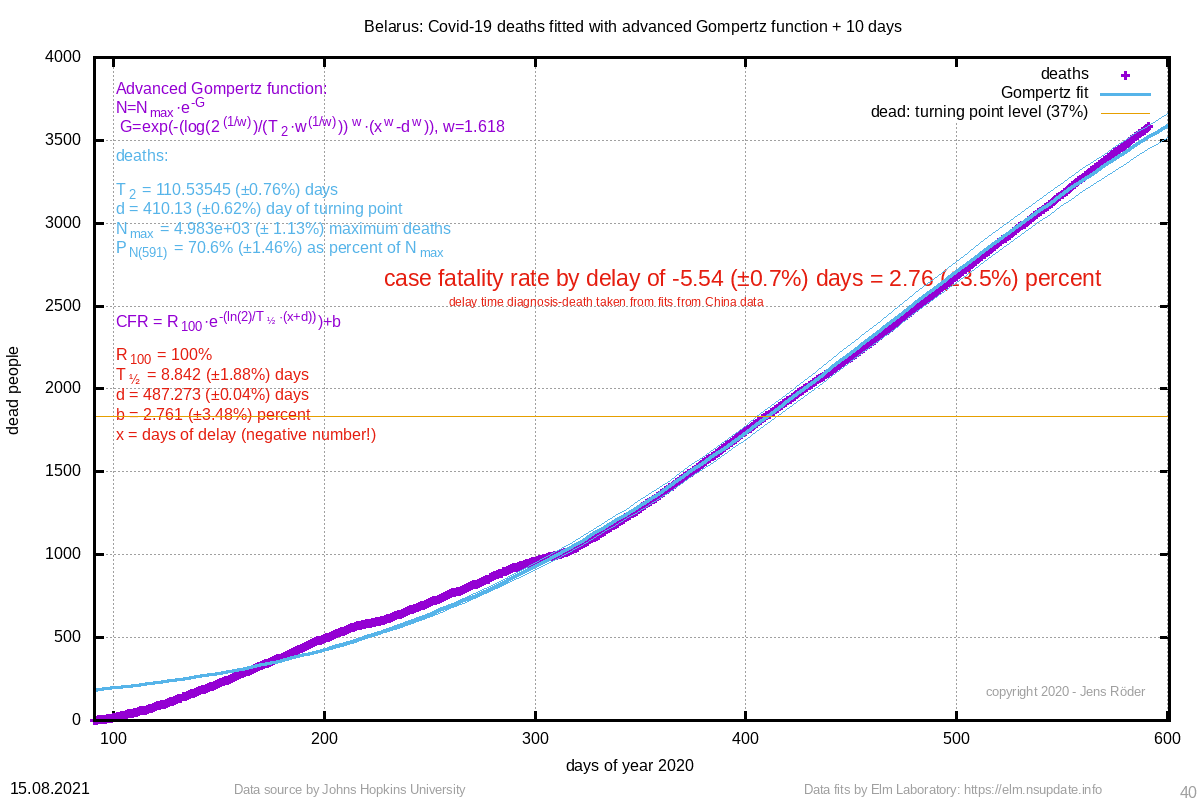 | Belarus | 2.76 (±3.5%) | 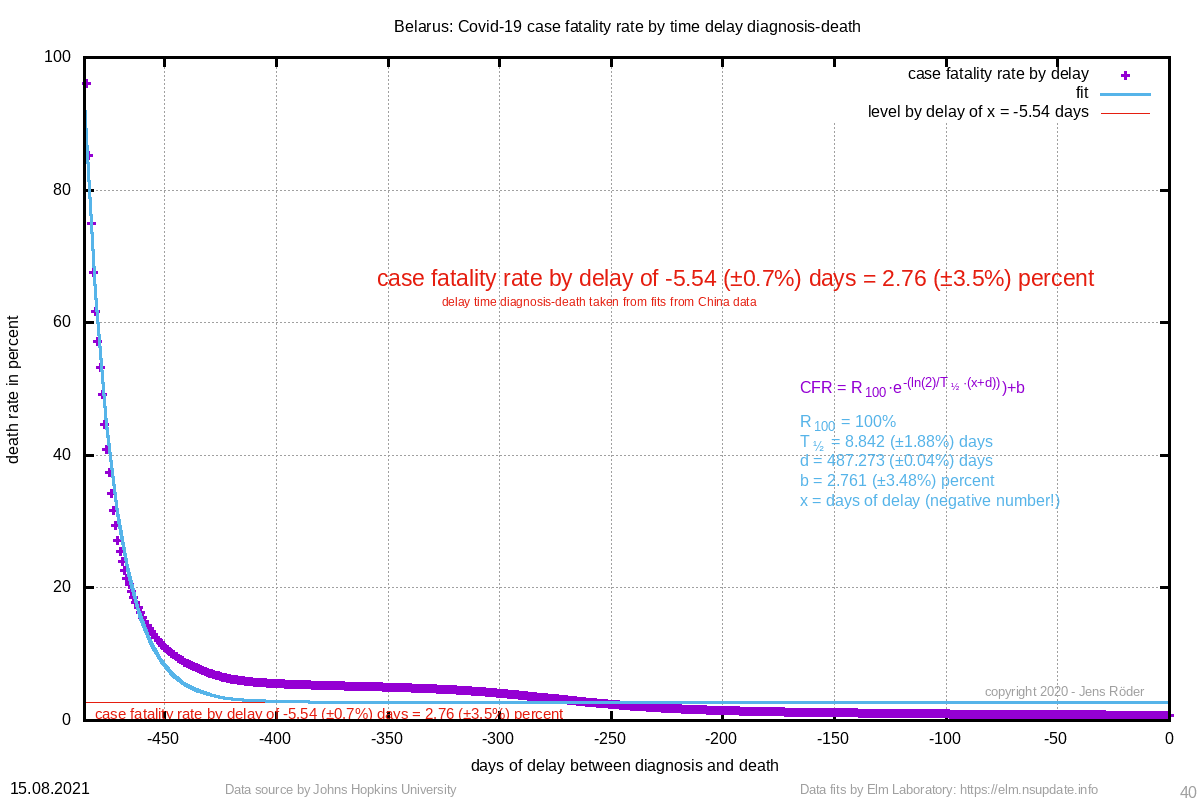 | 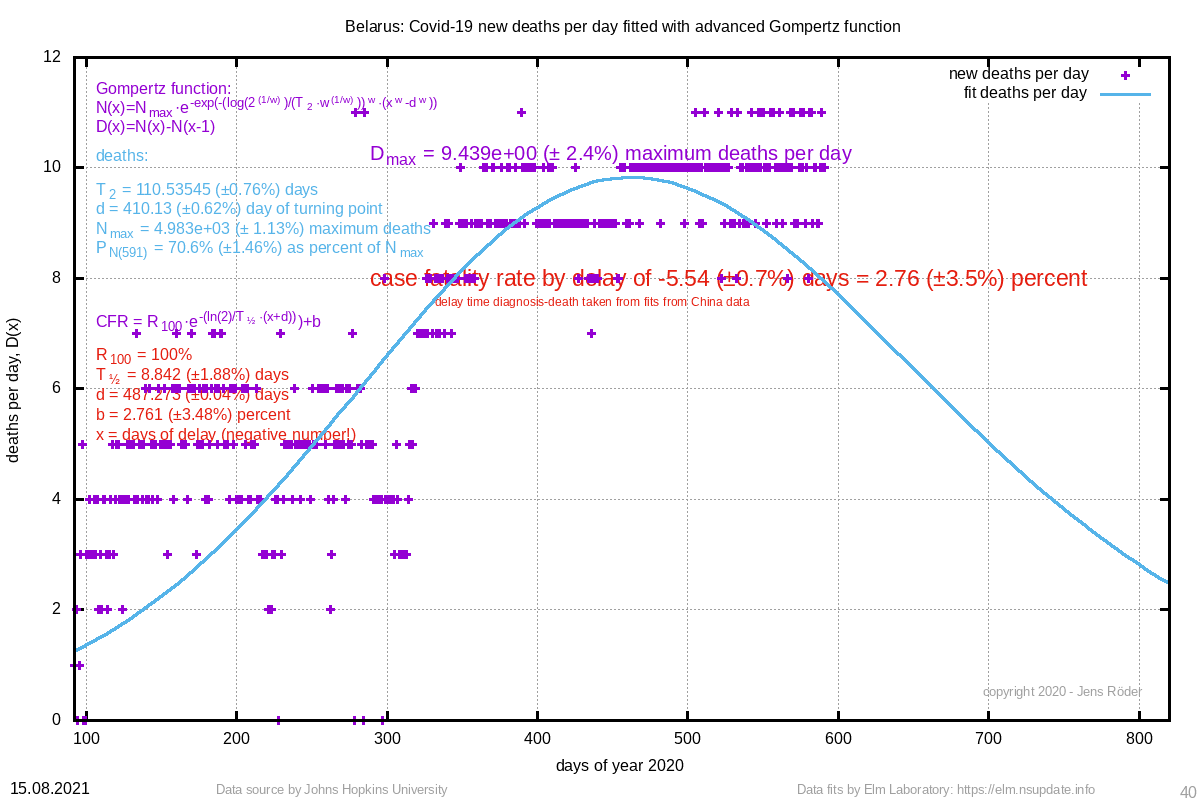 | 110.535 (±0.8%) | 410.13 (±0.6%) |
| 2558 | 3174 (±2.5%) | 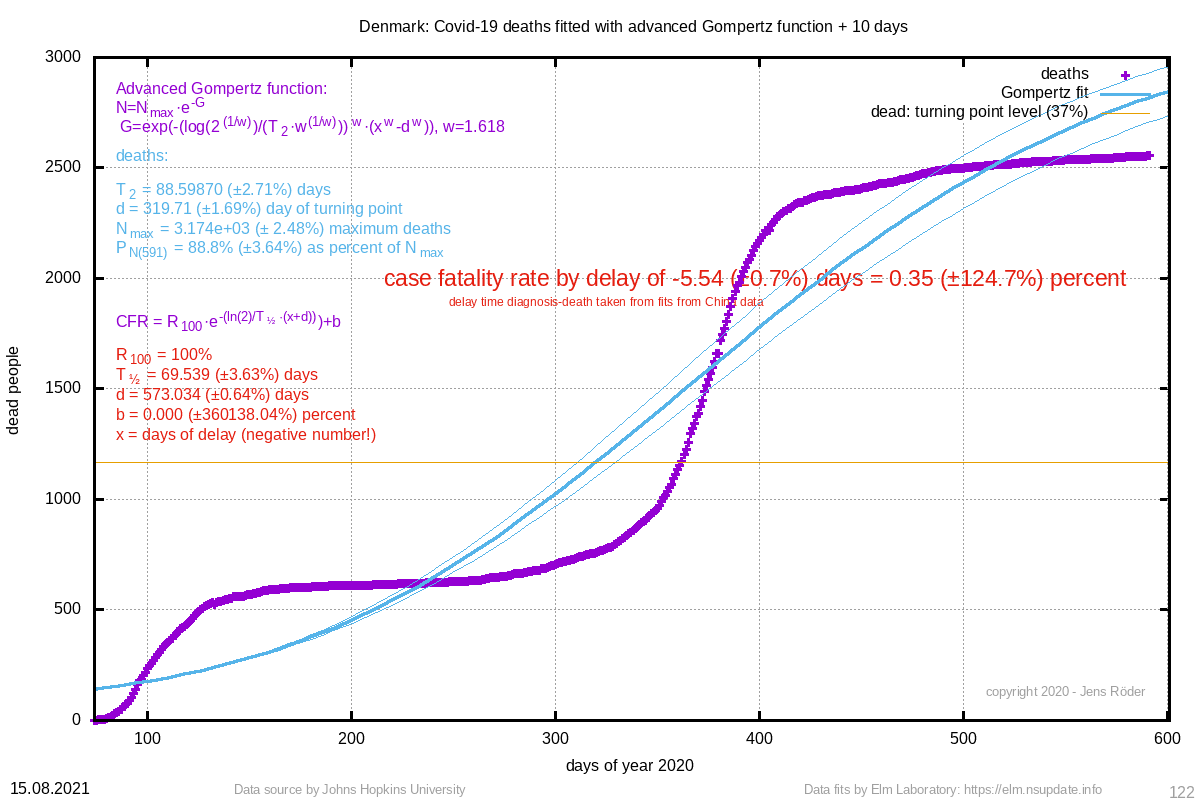 | Denmark | 0.35 (±124.7%) |  |  | 88.599 (±2.7%) | 319.71 (±1.7%) |
| 2461 | 2724 (±0.6%) |  | Albania | 2.13 (±4.4%) | 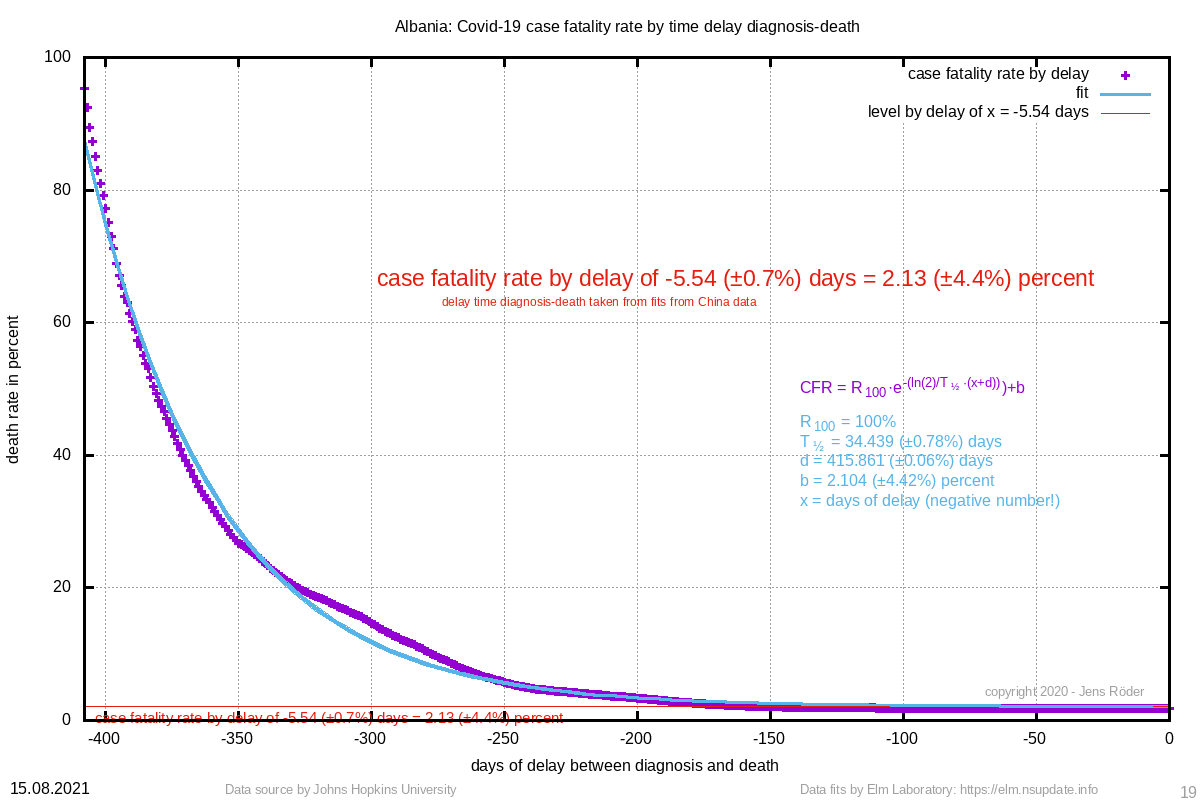 | 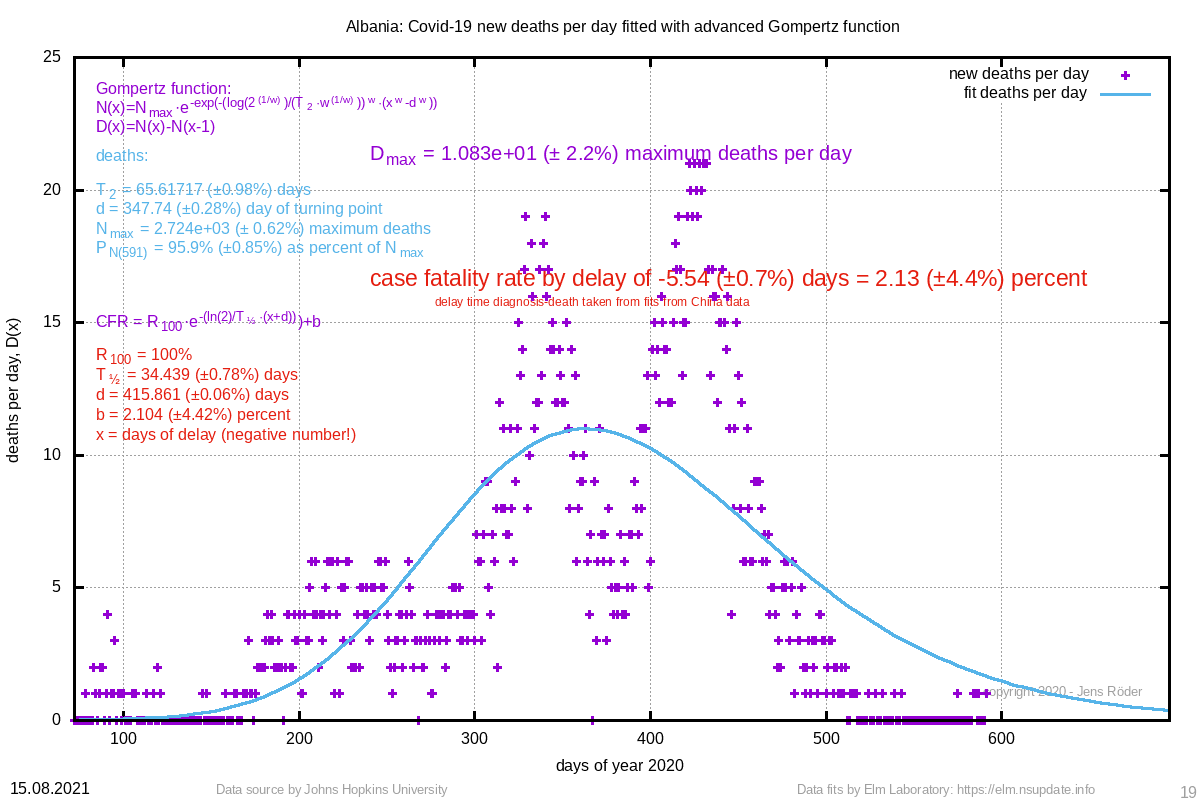 | 65.617 (±1.0%) | 347.74 (±0.3%) |
| 2332 | 2356 (±0.6%) | 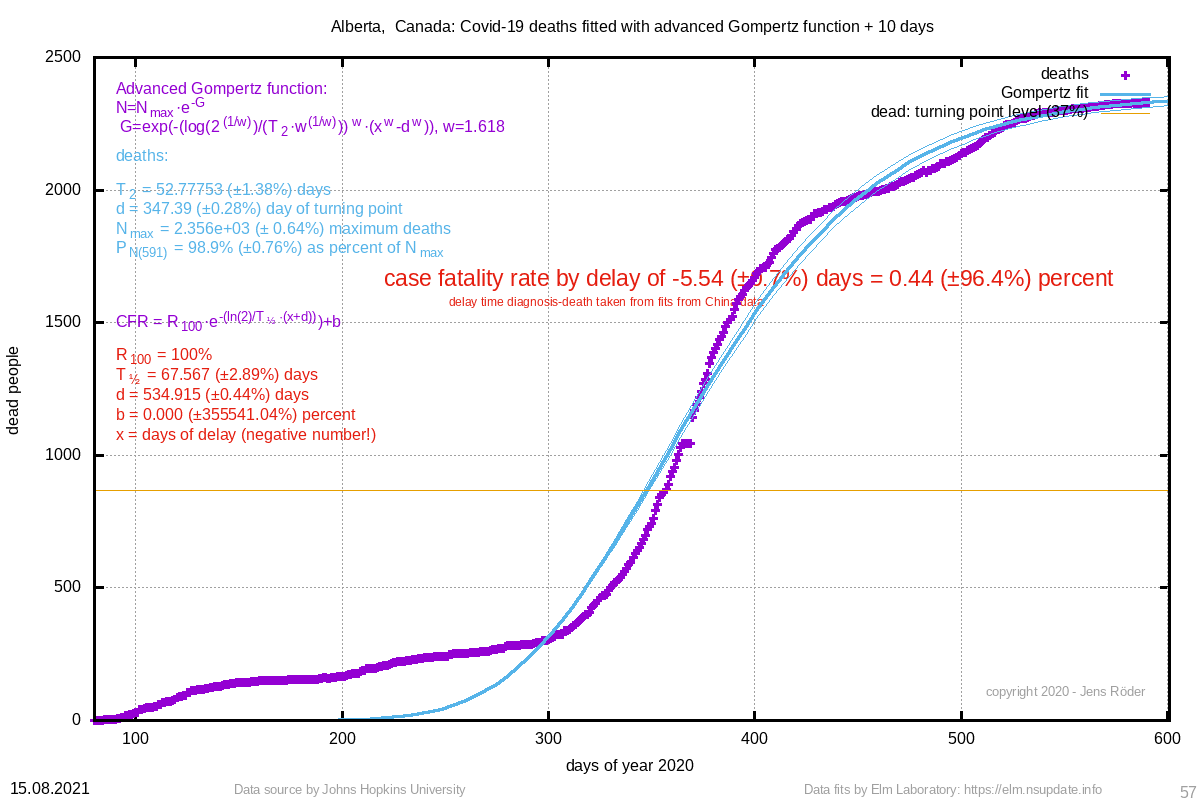 | Alberta, Canada | 0.44 (±96.4%) |  | 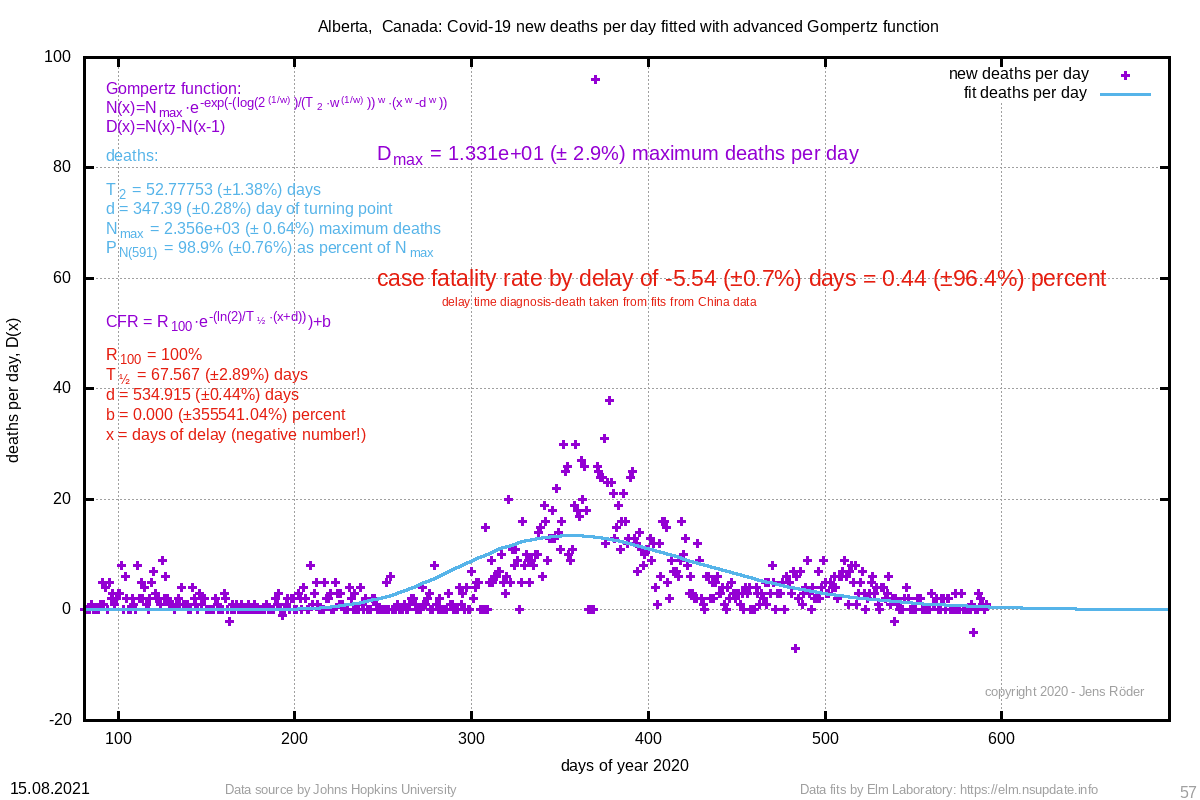 | 52.778 (±1.4%) | 347.39 (±0.3%) |
| 2211 | 2275 (±1.1%) | 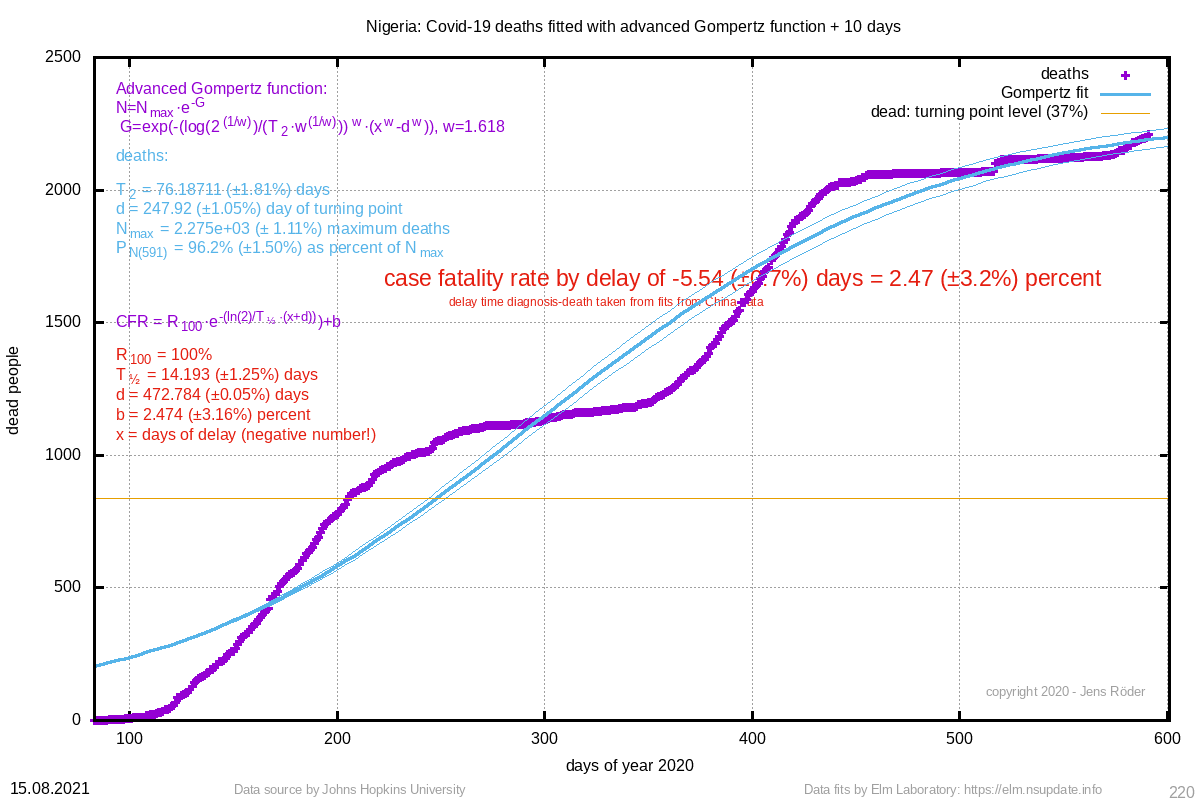 | Nigeria | 2.47 (±3.2%) | 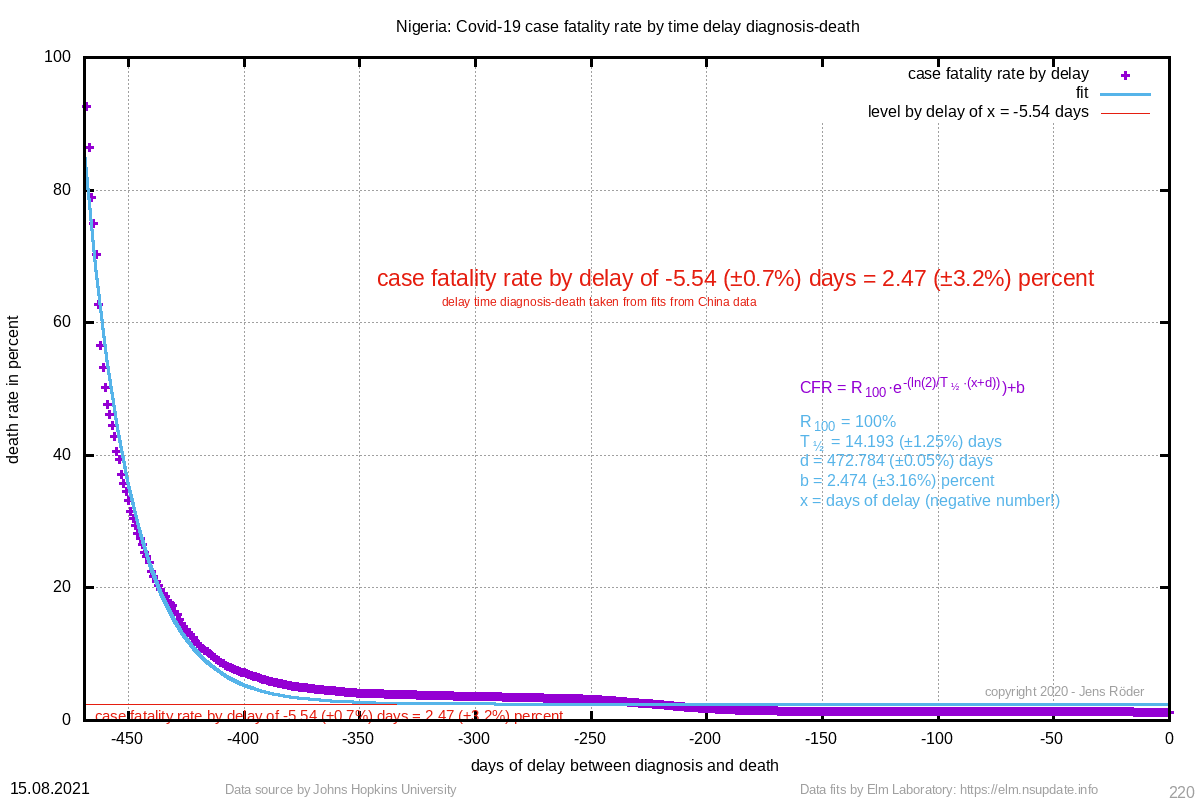 | 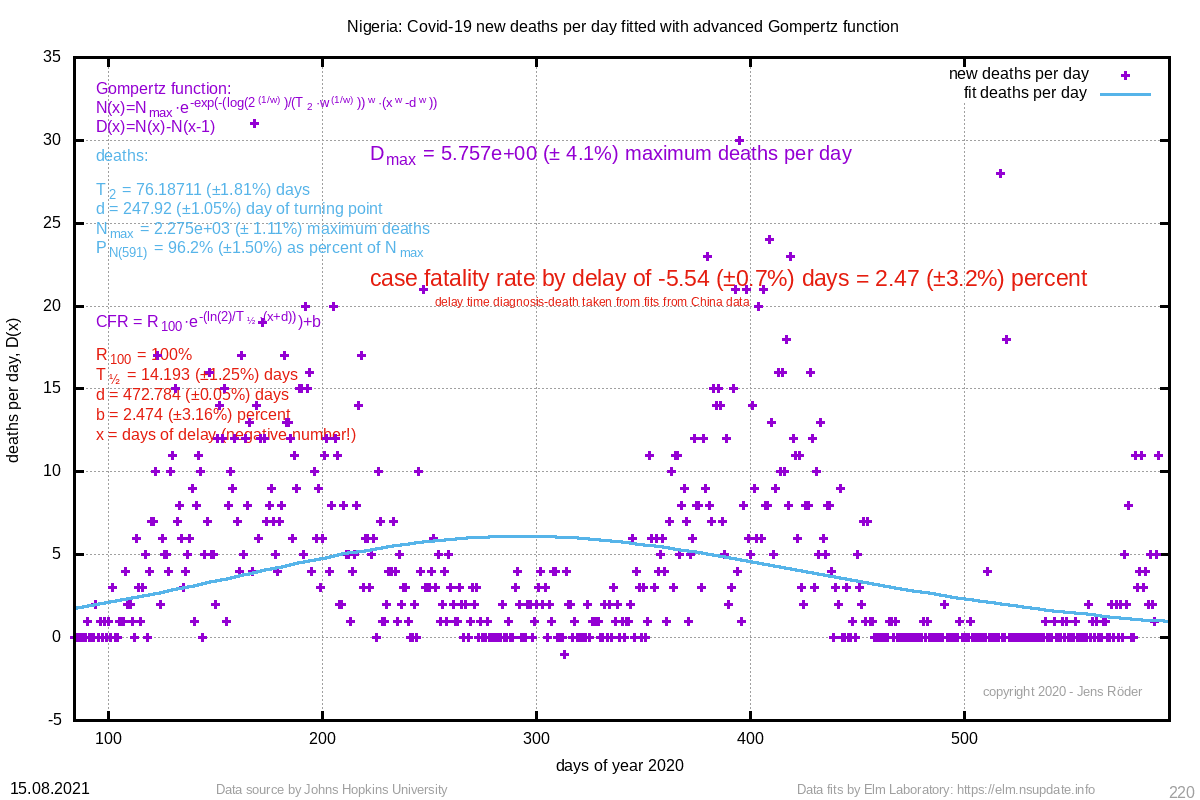 | 76.187 (±1.8%) | 247.92 (±1.1%) |
| 1973 | 5188 (±9.5%) |  | Botswana | 3.47 (±6.0%) | 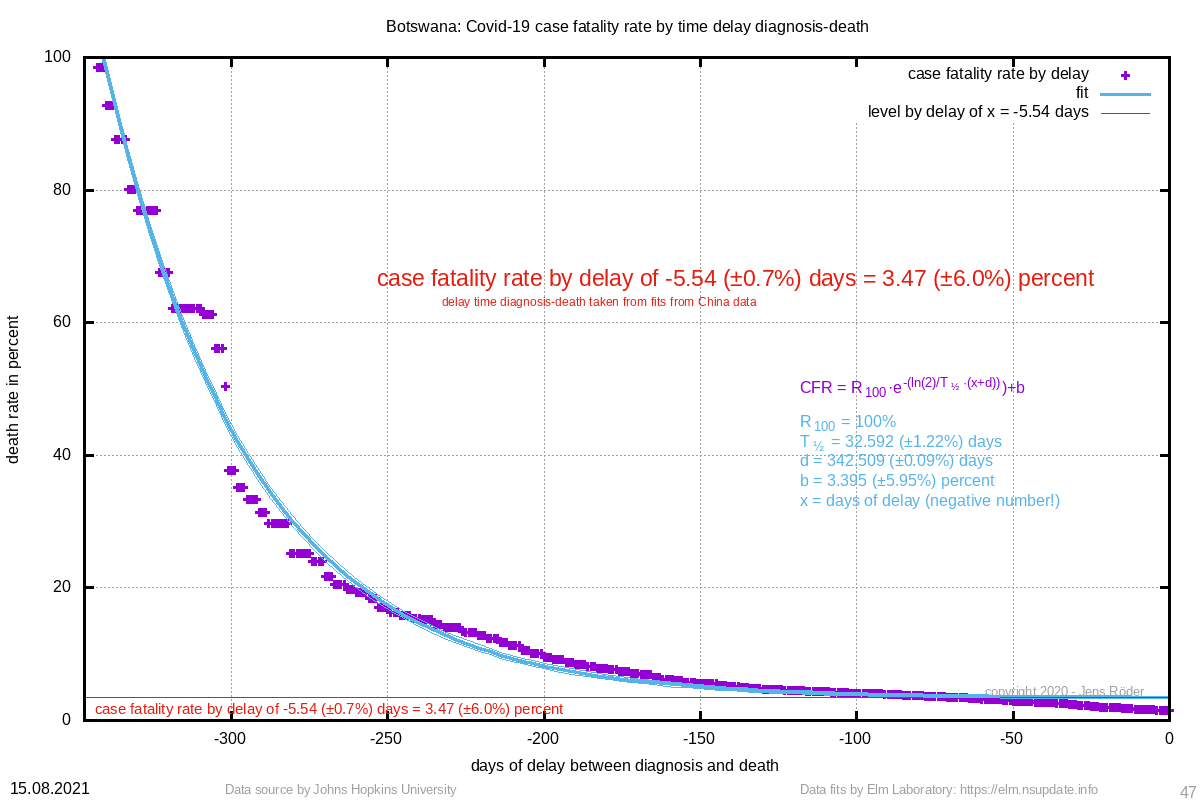 | 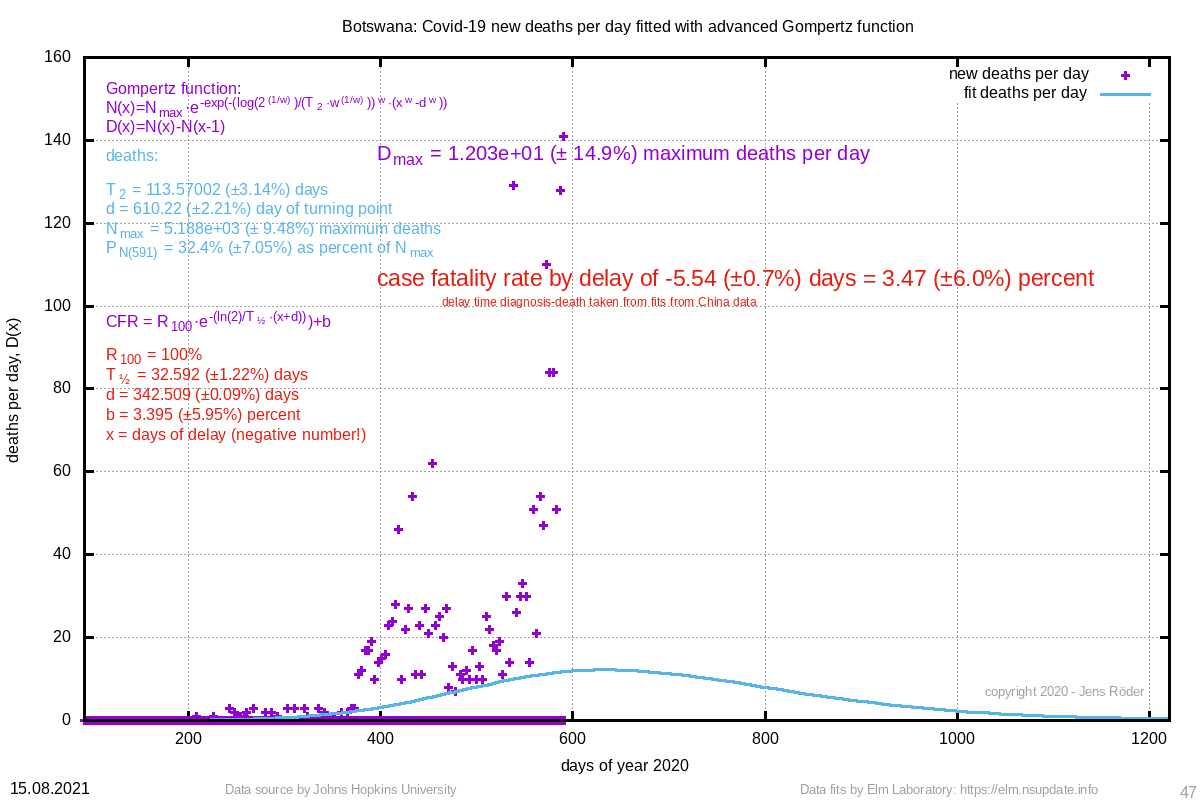 | 113.570 (±3.1%) | 610.22 (±2.2%) |
| 1640 | 1837 (±0.5%) | 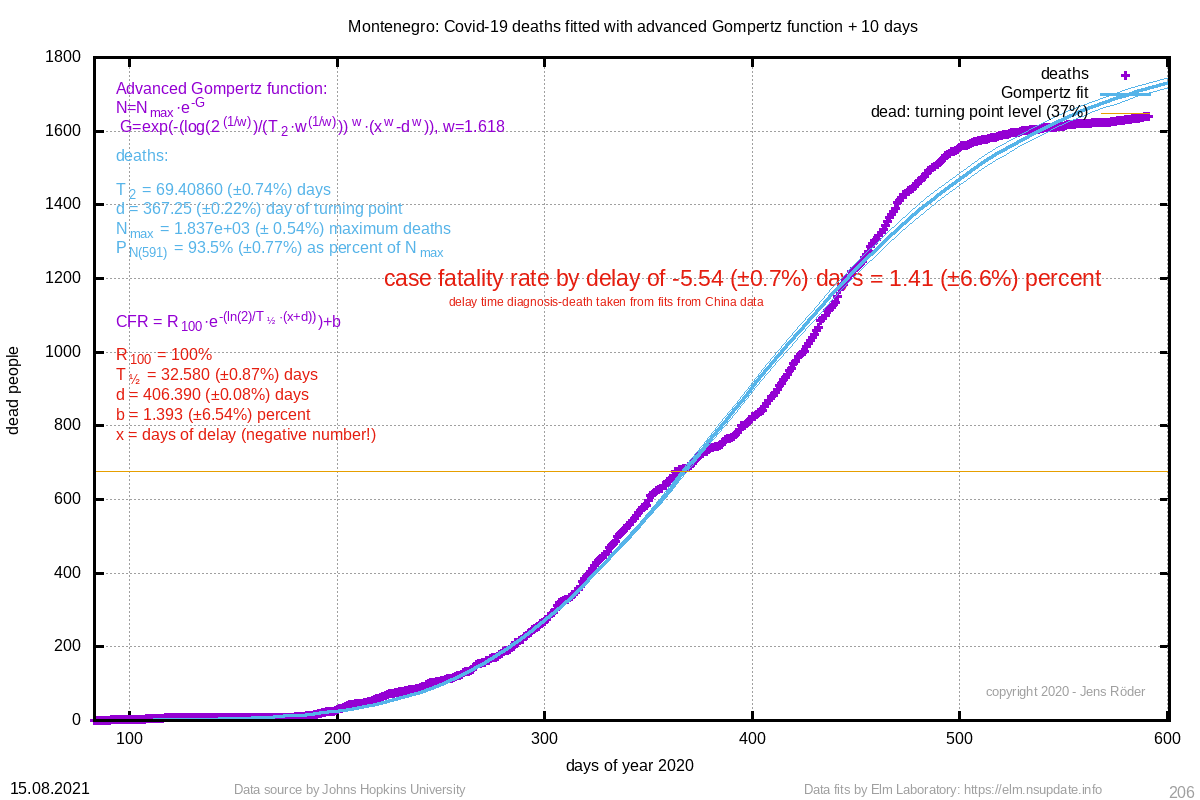 | Montenegro | 1.41 (±6.6%) |  | 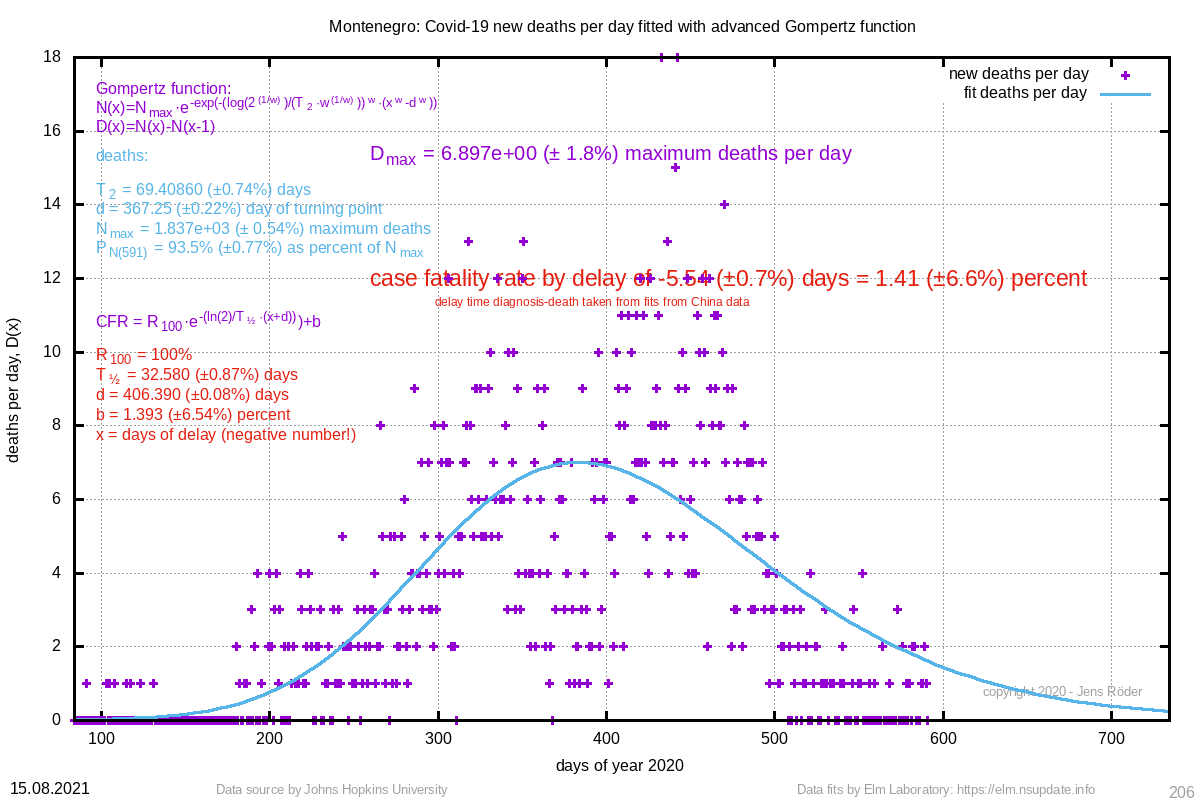 | 69.409 (±0.7%) | 367.25 (±0.2%) |
| 1532 | 1056 (±0.6%) | 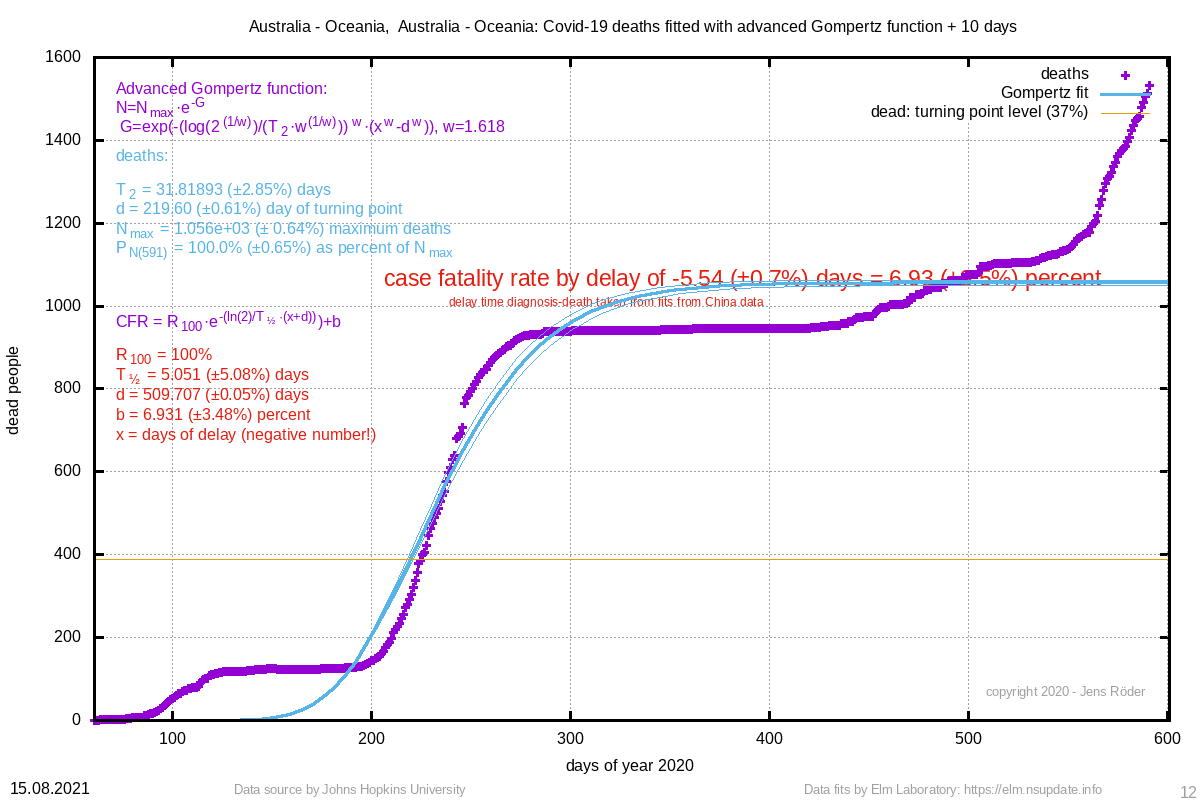 | Australia - Oceania, Australia - Oceania | 6.93 (±3.5%) |  | 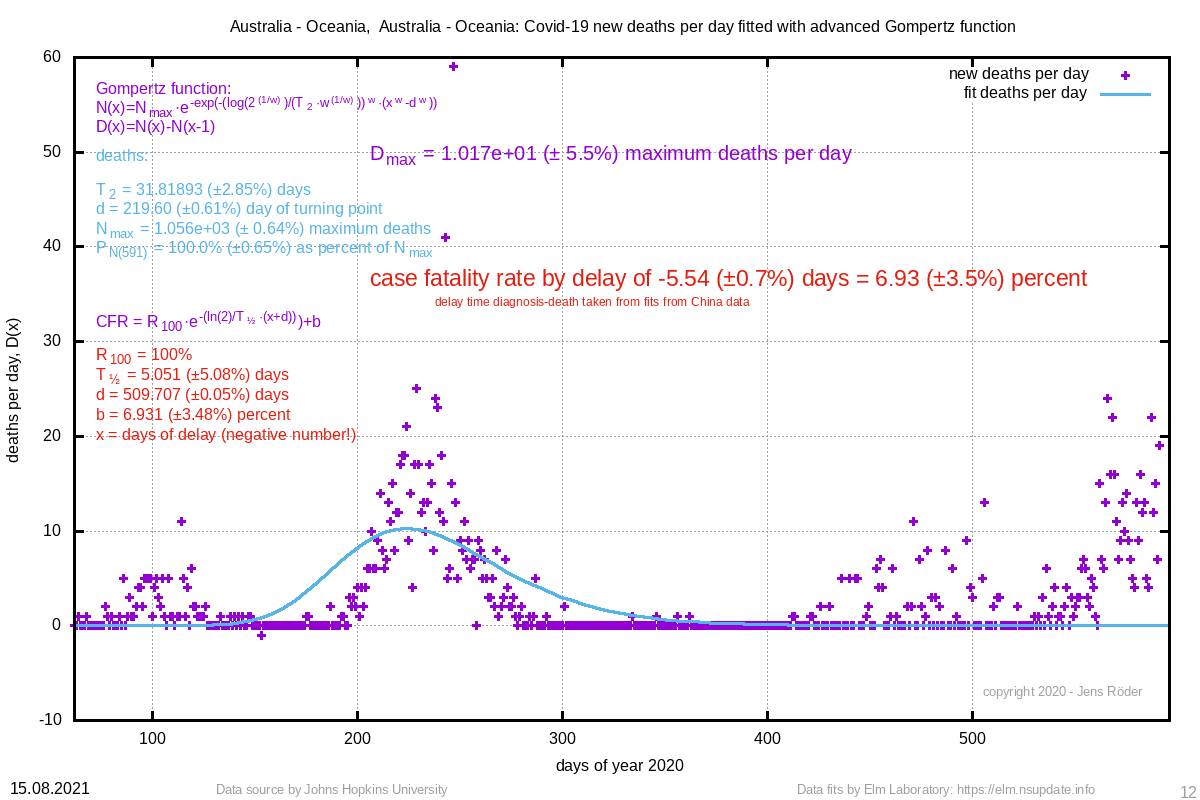 | 31.819 (±2.9%) | 219.60 (±0.6%) |
| 1384 | 152113983 (±375.7%) | 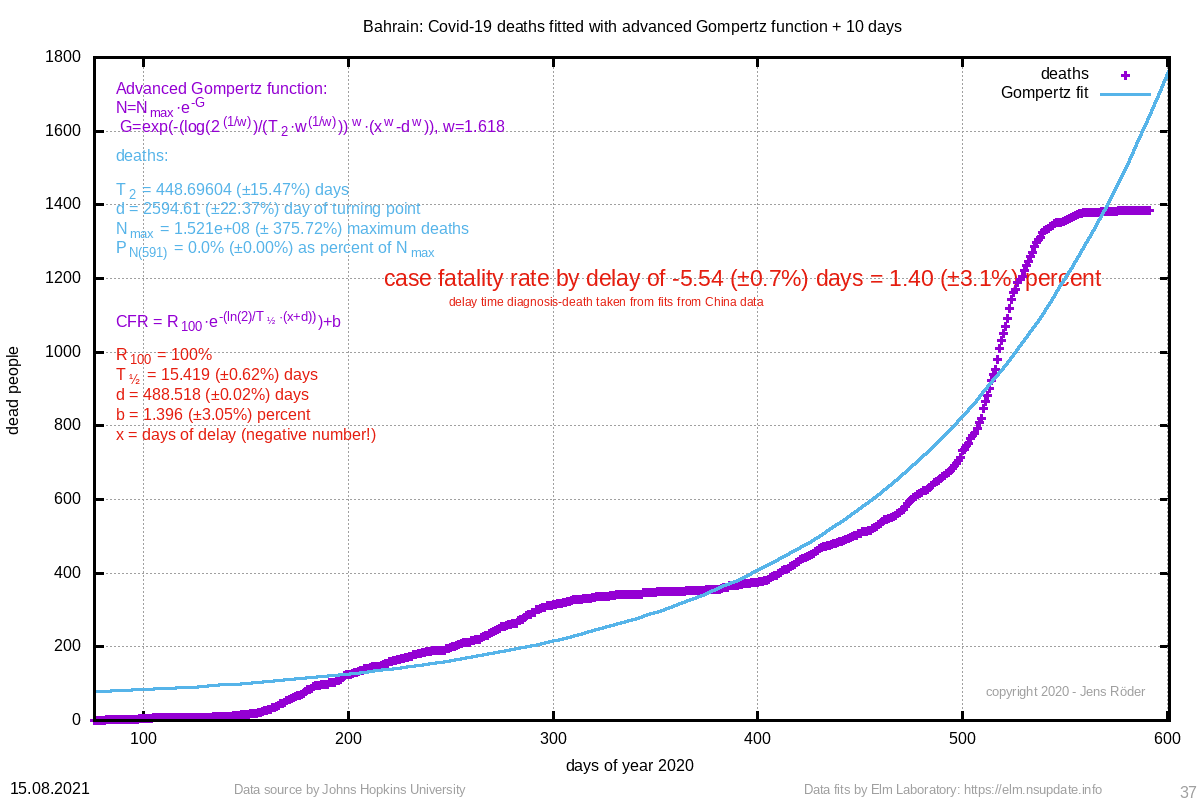 | Bahrain | 1.40 (±3.1%) | 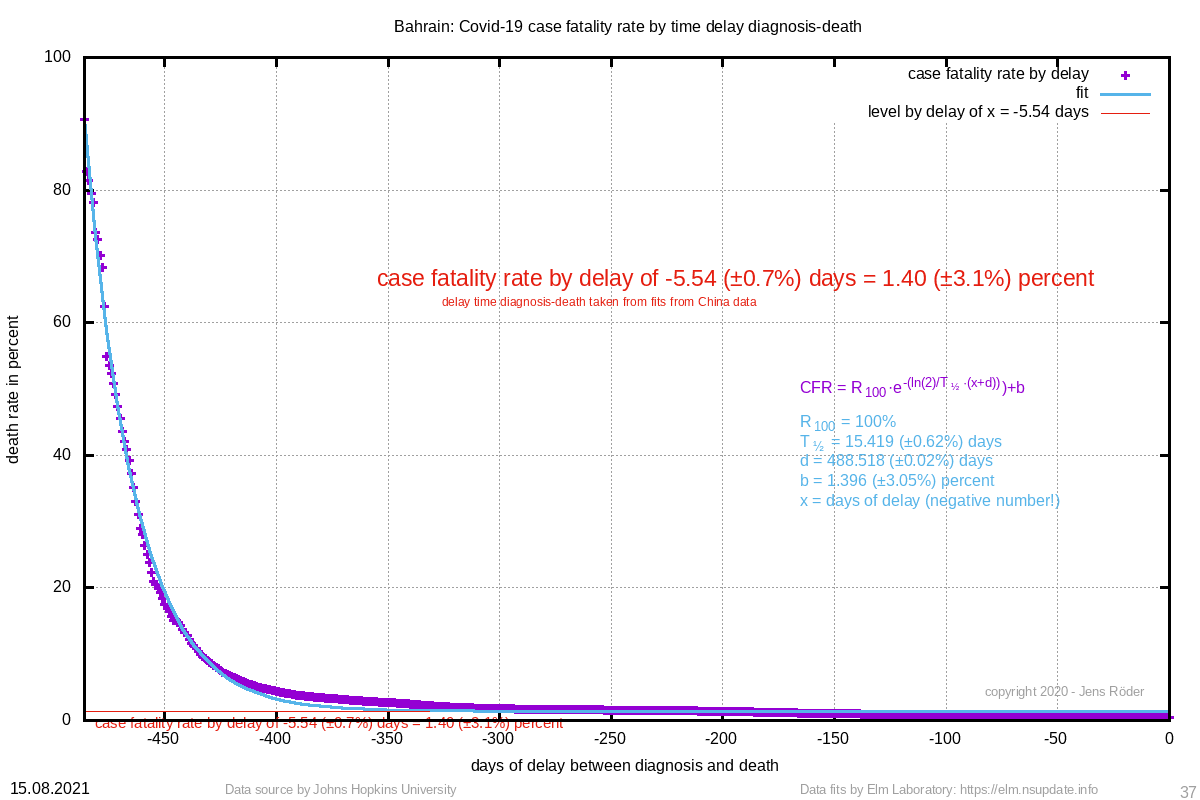 | 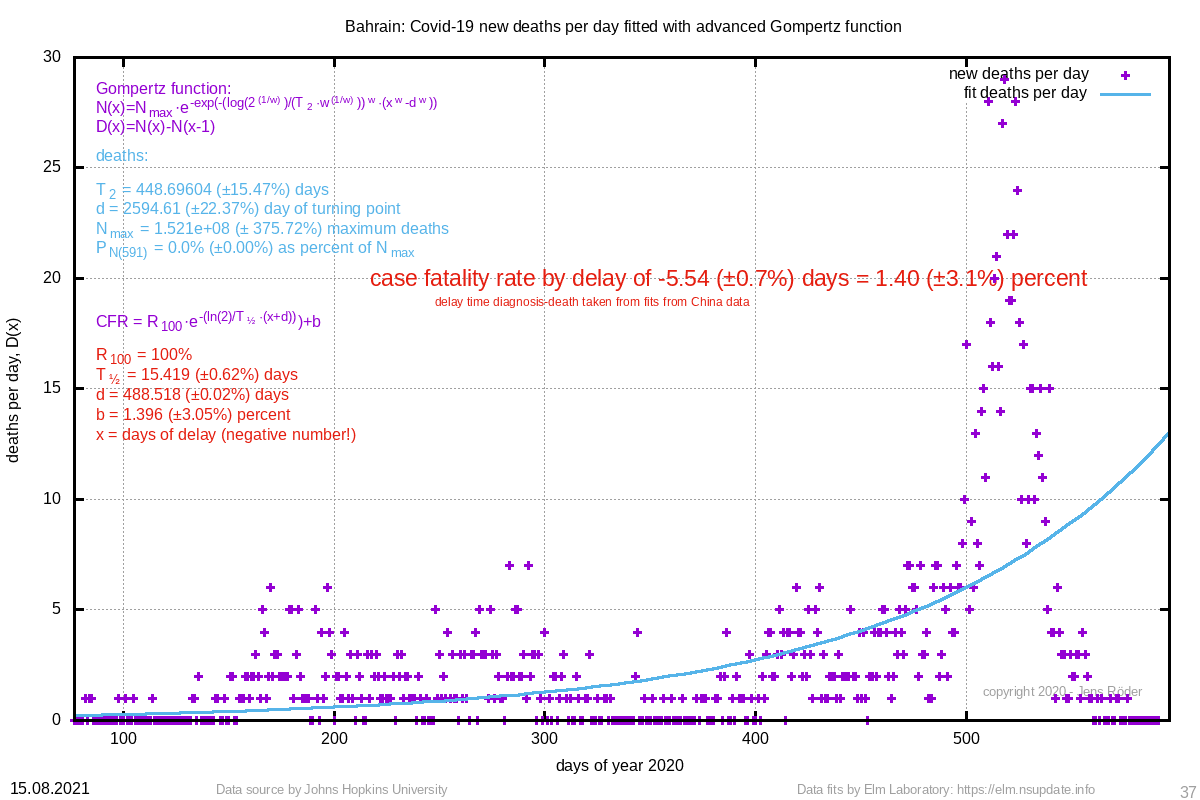 | 448.696 (±15.5%) | 2594.61 (±22.4%) |
| 1338 | 38040788 (±537.0%) | 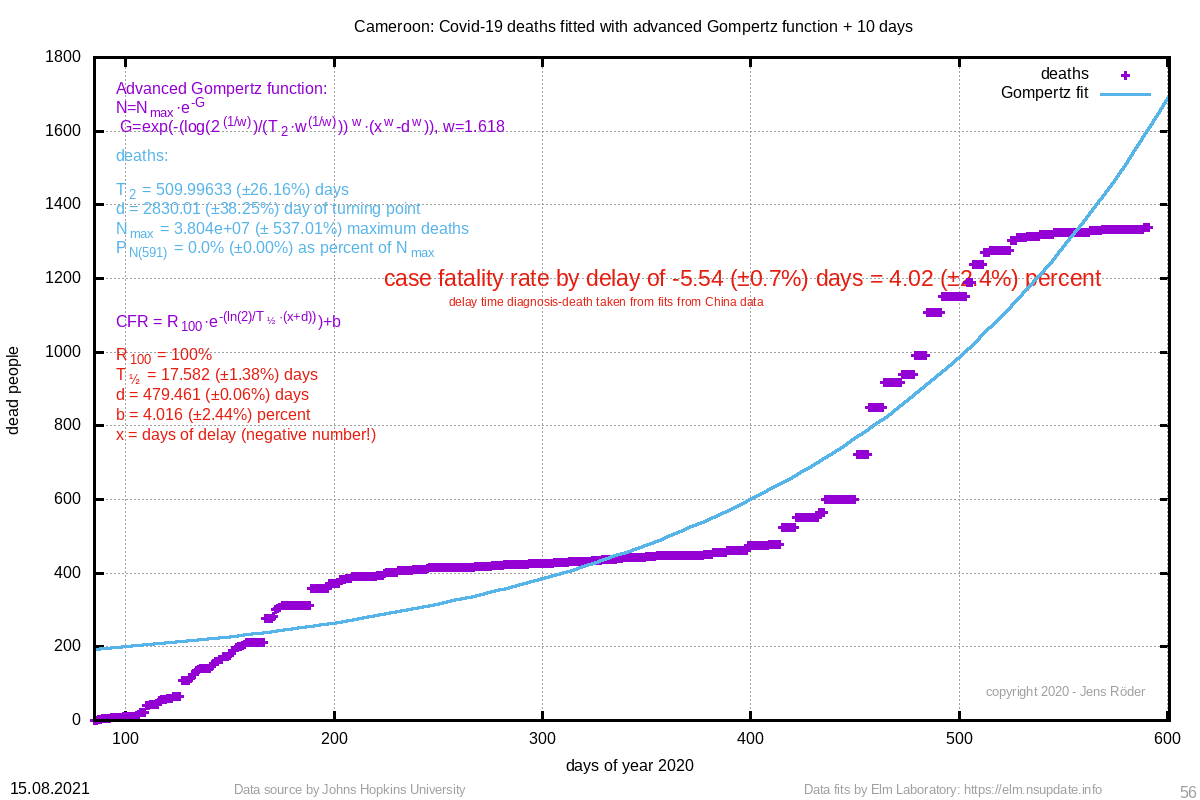 | Cameroon | 4.02 (±2.4%) | 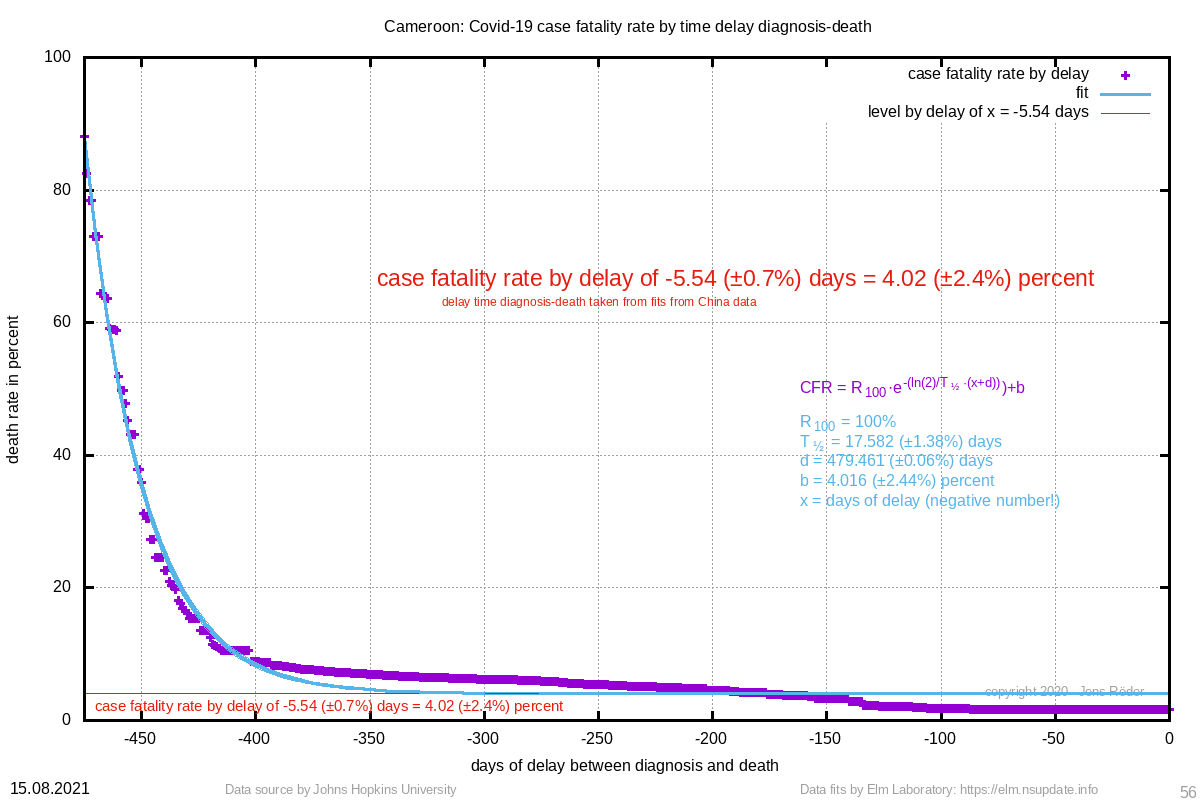 | 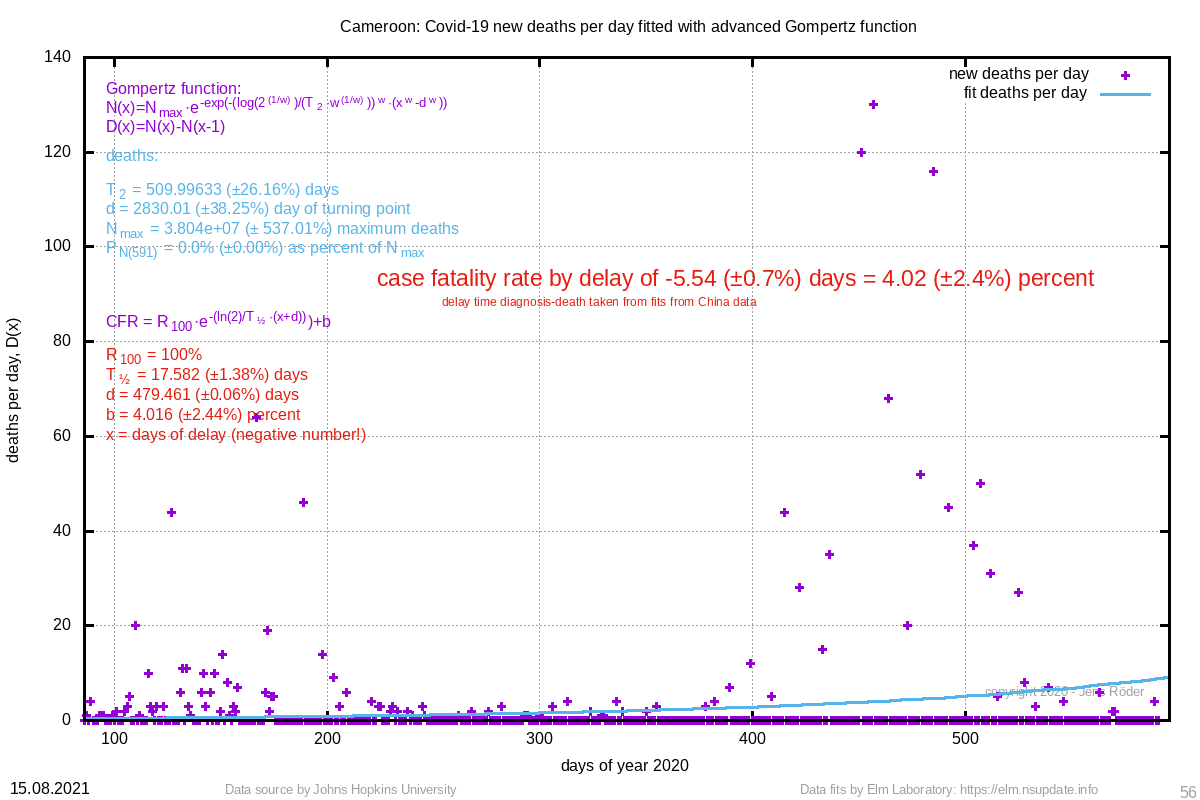 | 509.996 (±26.2%) | 2830.01 (±38.3%) |
| 1082 | 1500 (±3.7%) | 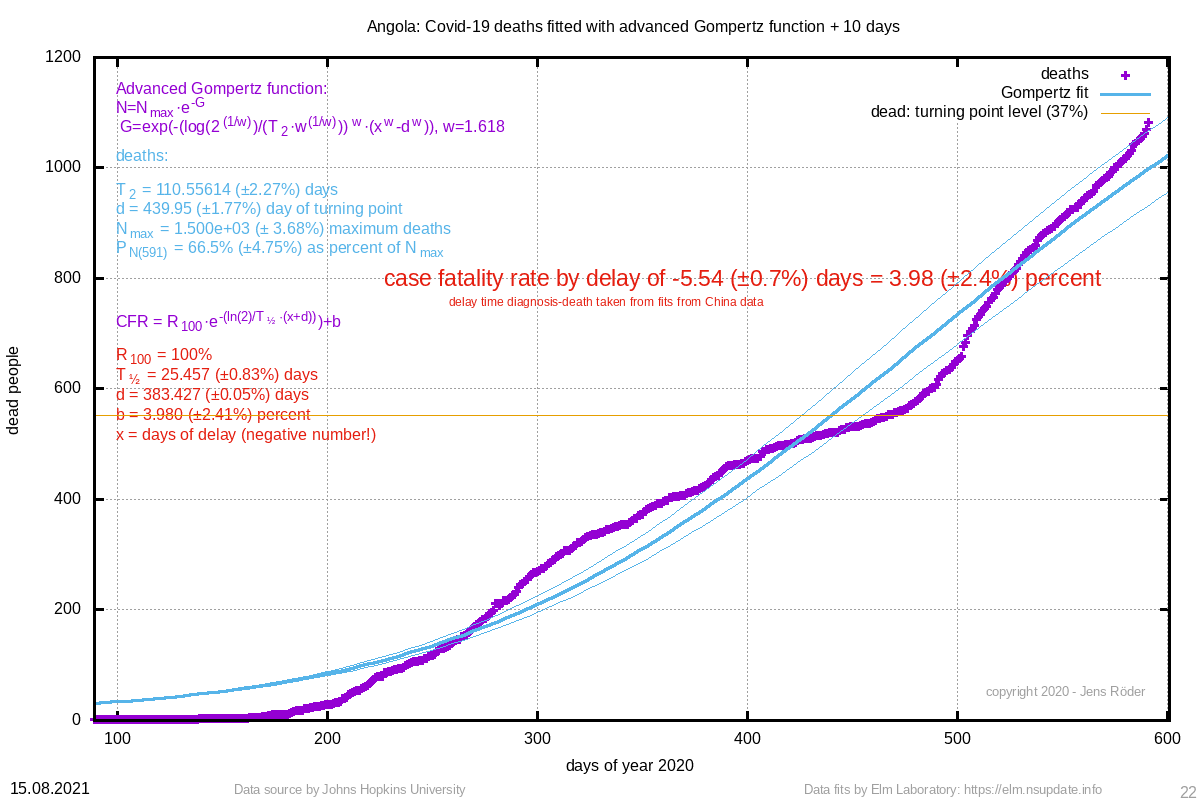 | Angola | 3.98 (±2.4%) | 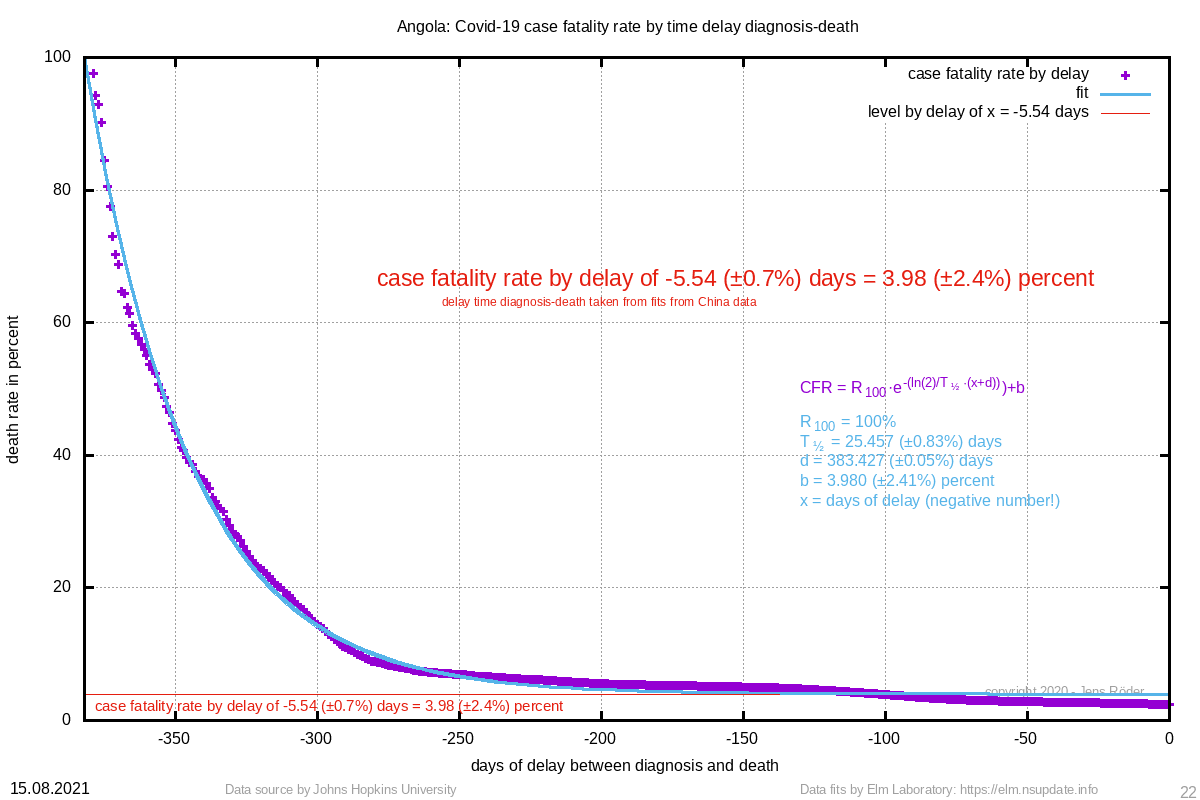 | 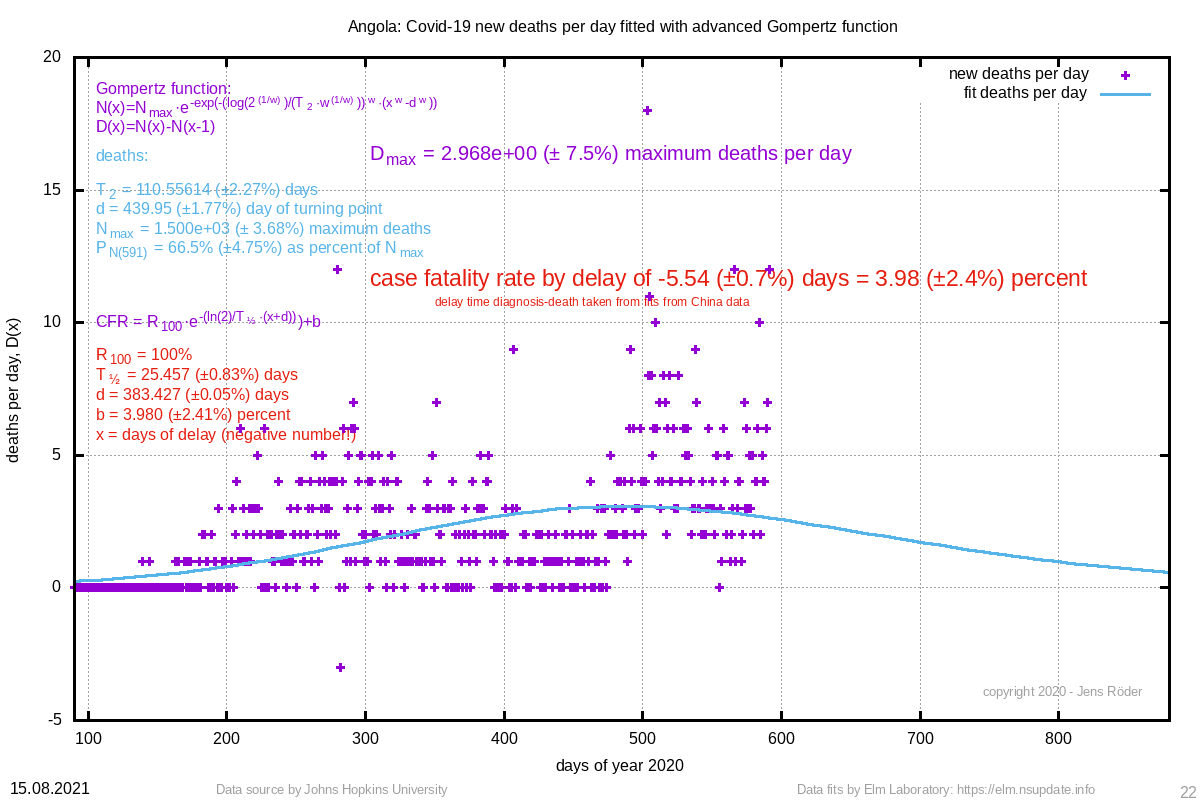 | 110.556 (±2.3%) | 439.95 (±1.8%) |
| 1050 | 1143 (±1.7%) | 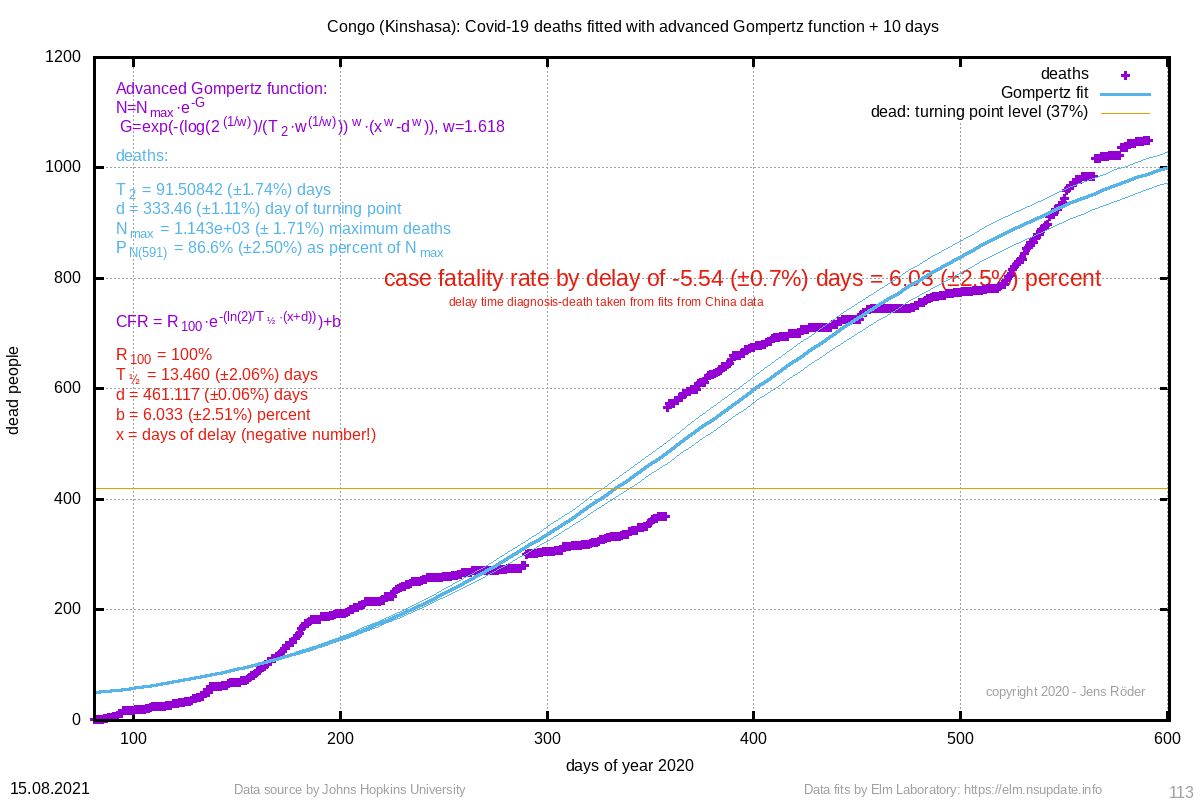 | Congo (Kinshasa) | 6.03 (±2.5%) | 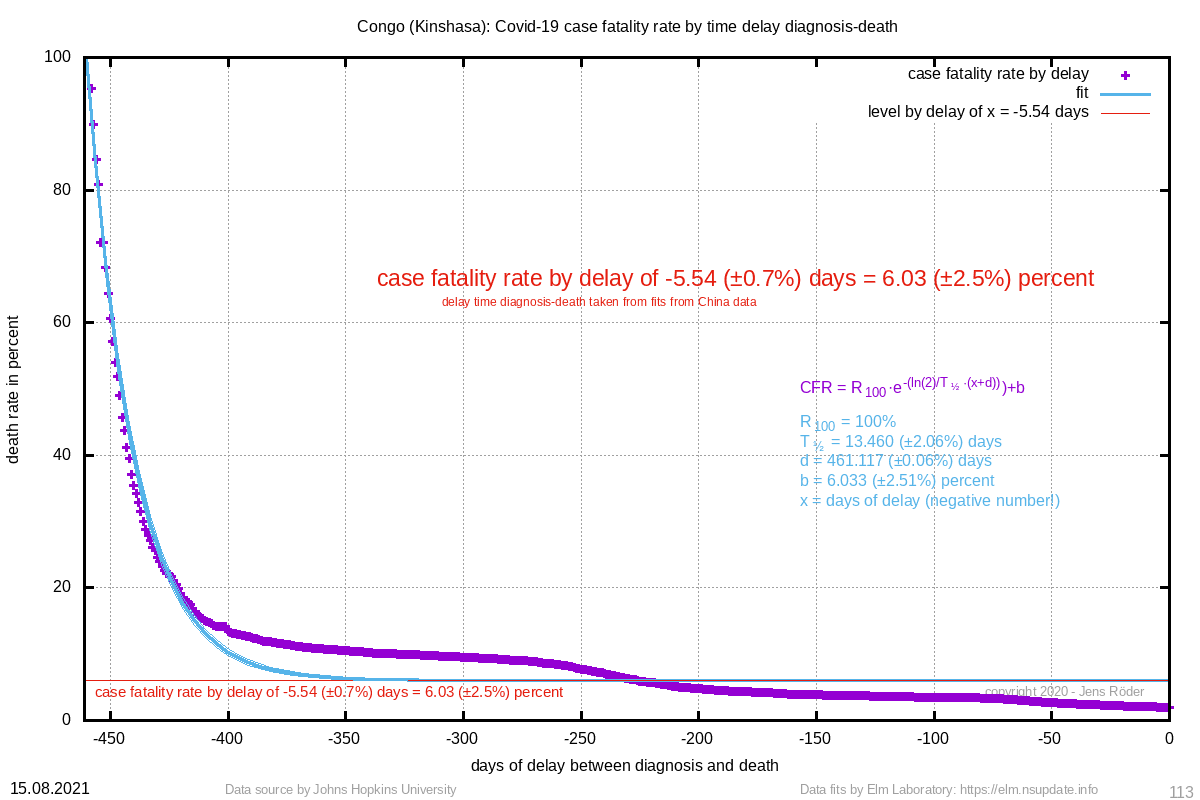 | 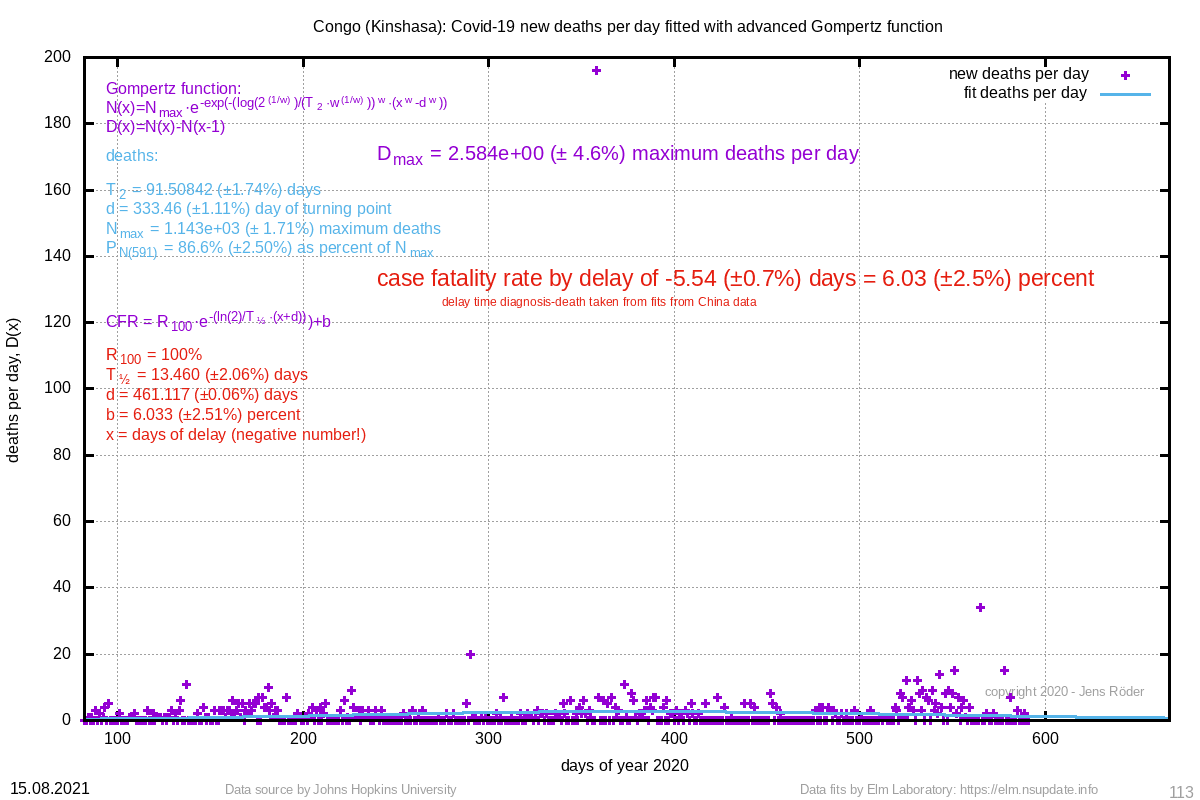 | 91.508 (±1.7%) | 333.46 (±1.1%) |
| 871 | 1285 (±2.2%) | 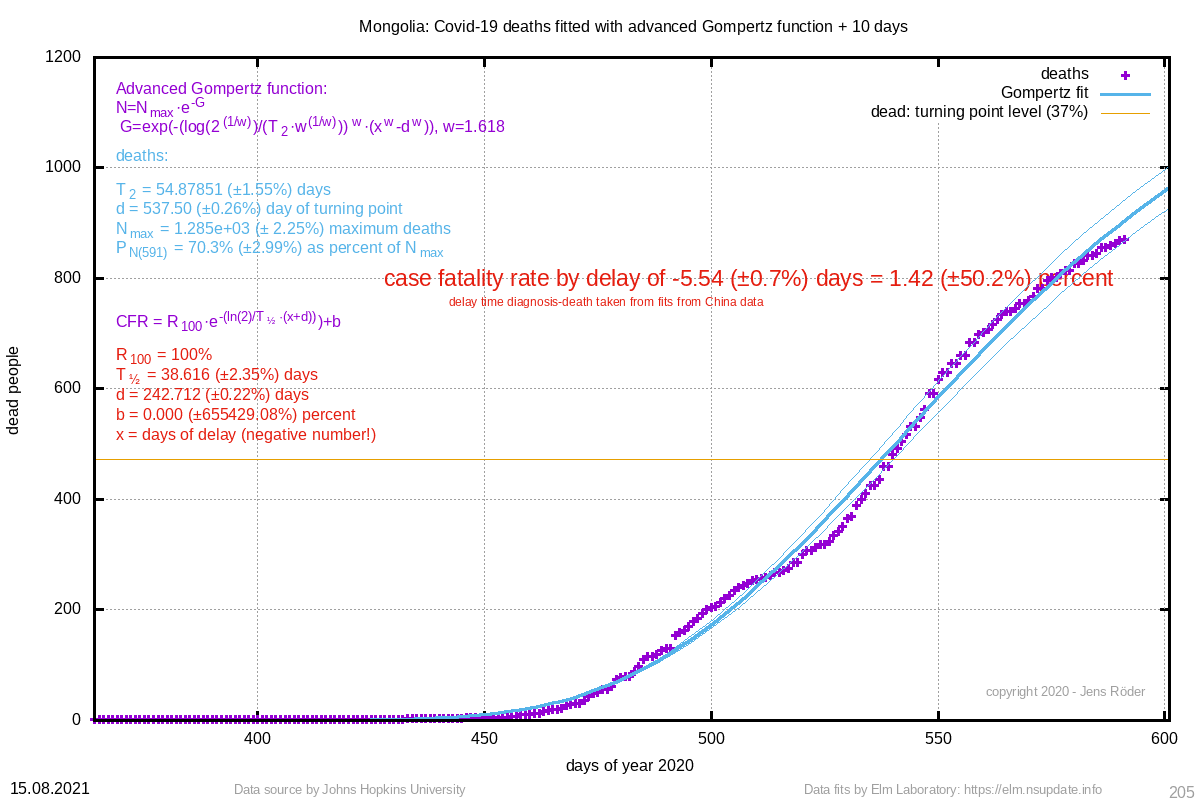 | Mongolia | 1.42 (±50.2%) | 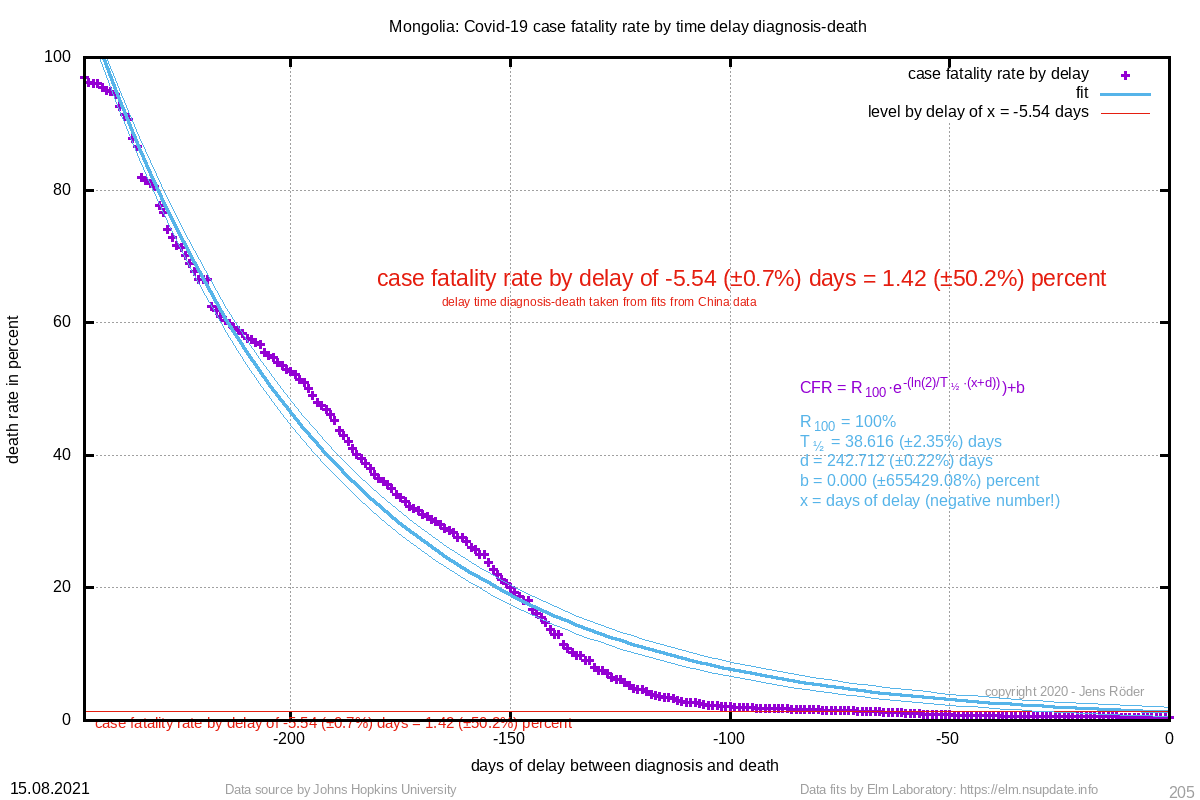 | 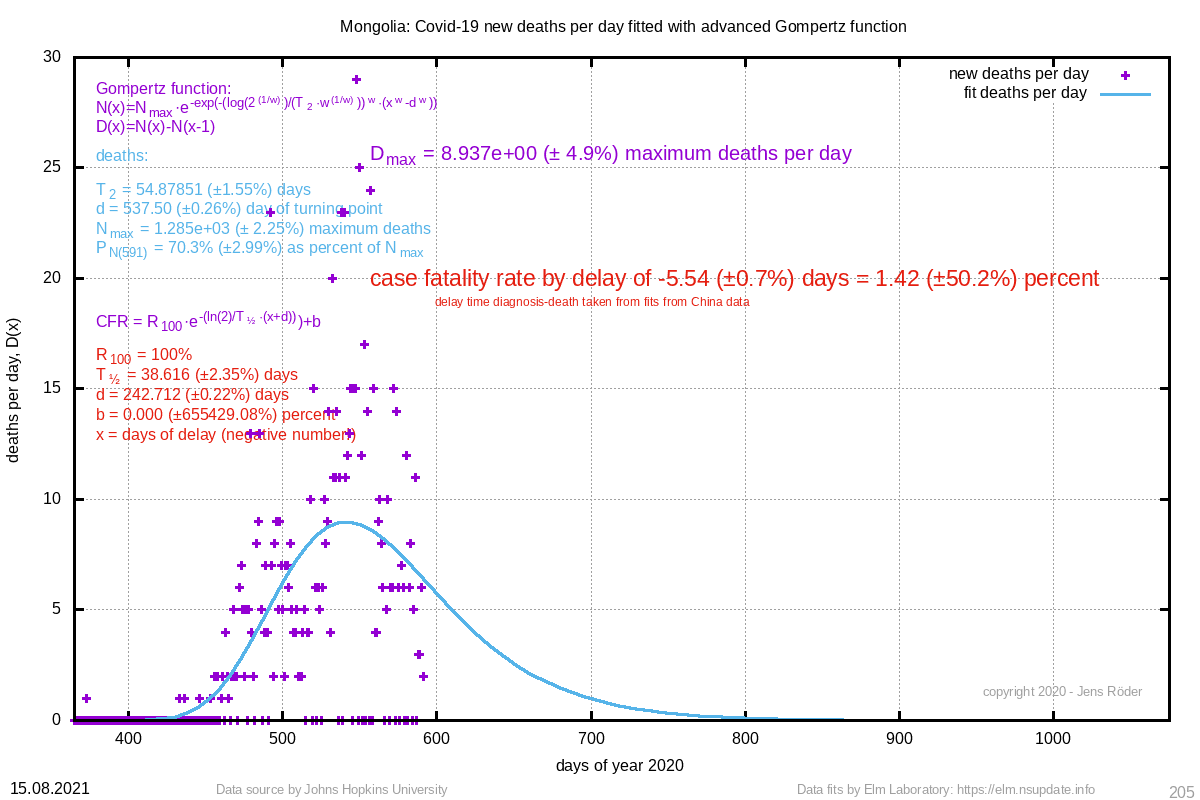 | 54.879 (±1.6%) | 537.50 (±0.3%) |
| 808 | 1149 (±3.2%) | 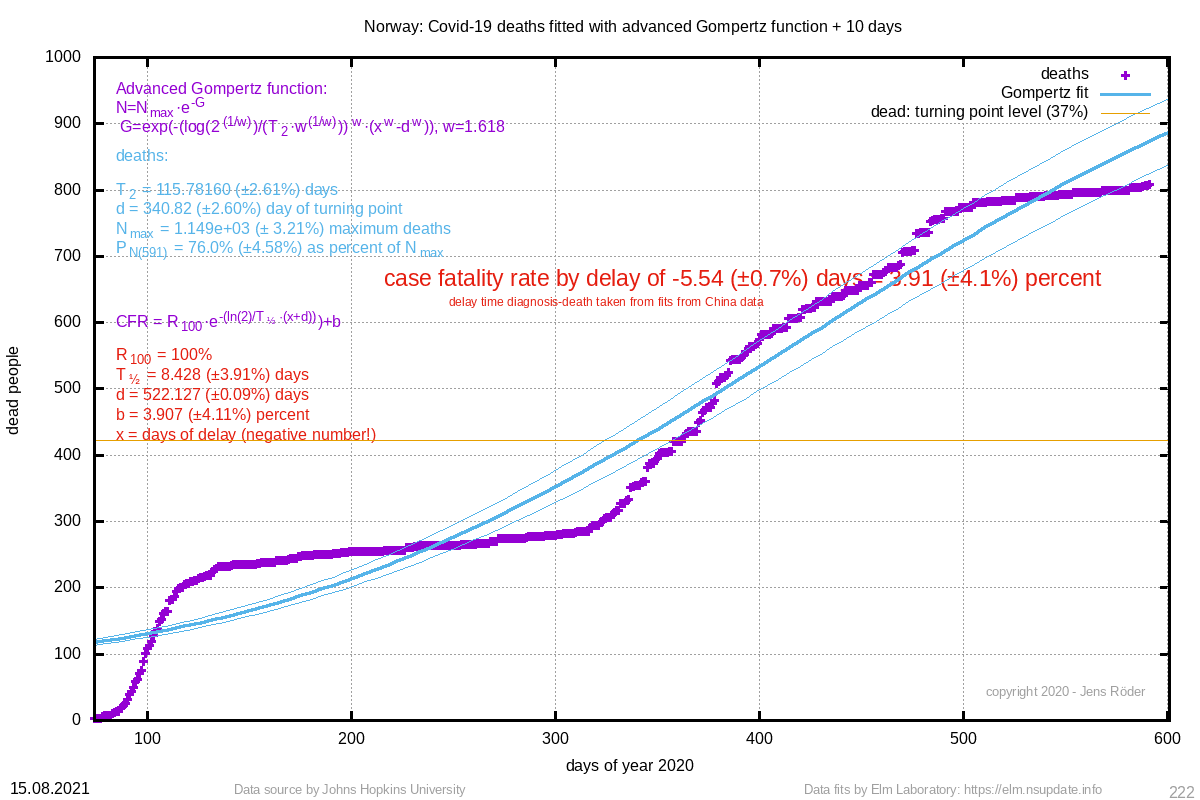 | Norway | 3.91 (±4.1%) | 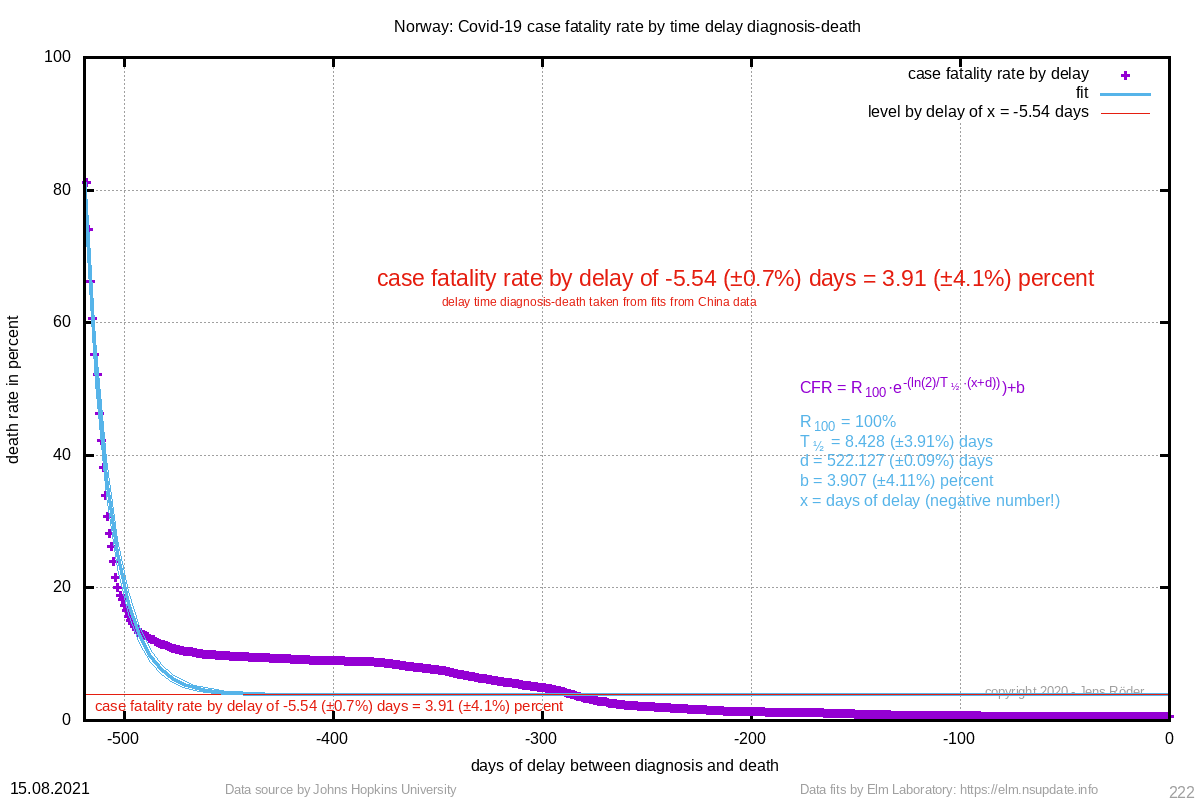 |  | 115.782 (±2.6%) | 340.82 (±2.6%) |
| 576 | 7235 (±124.4%) |  | Haiti | 5.45 (±1.4%) | 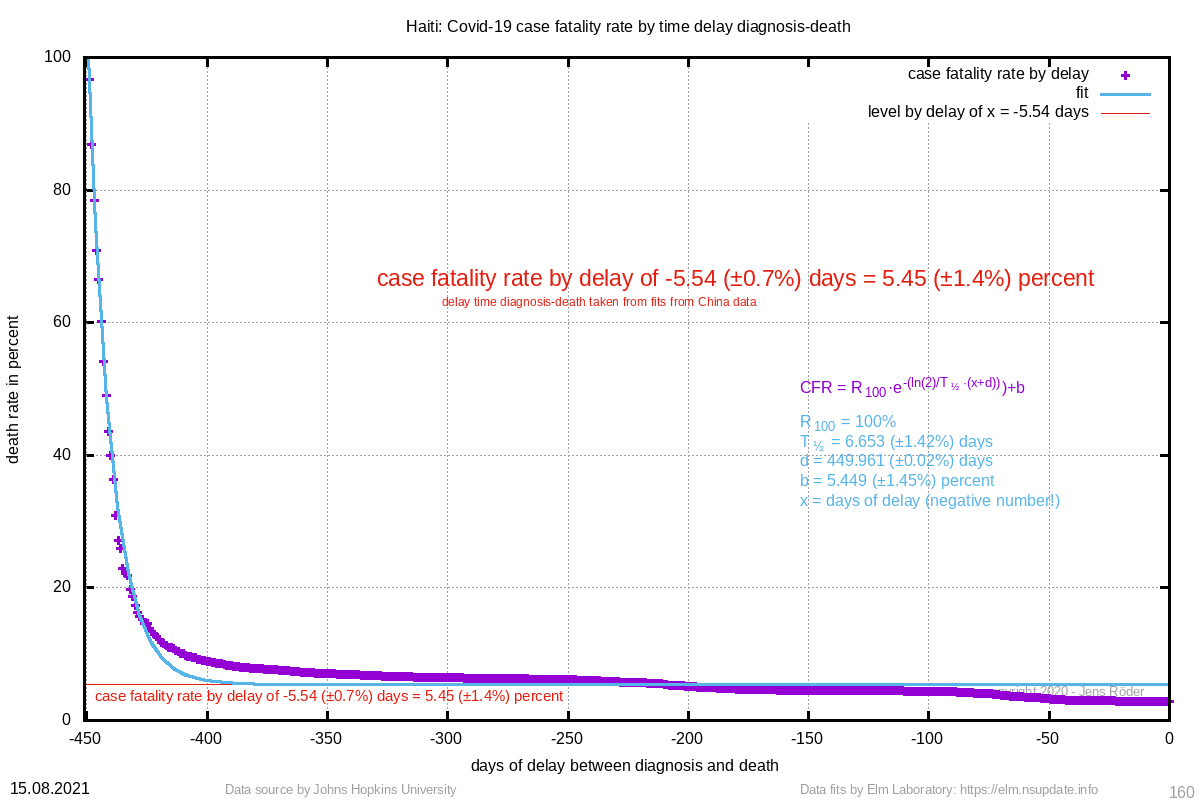 | 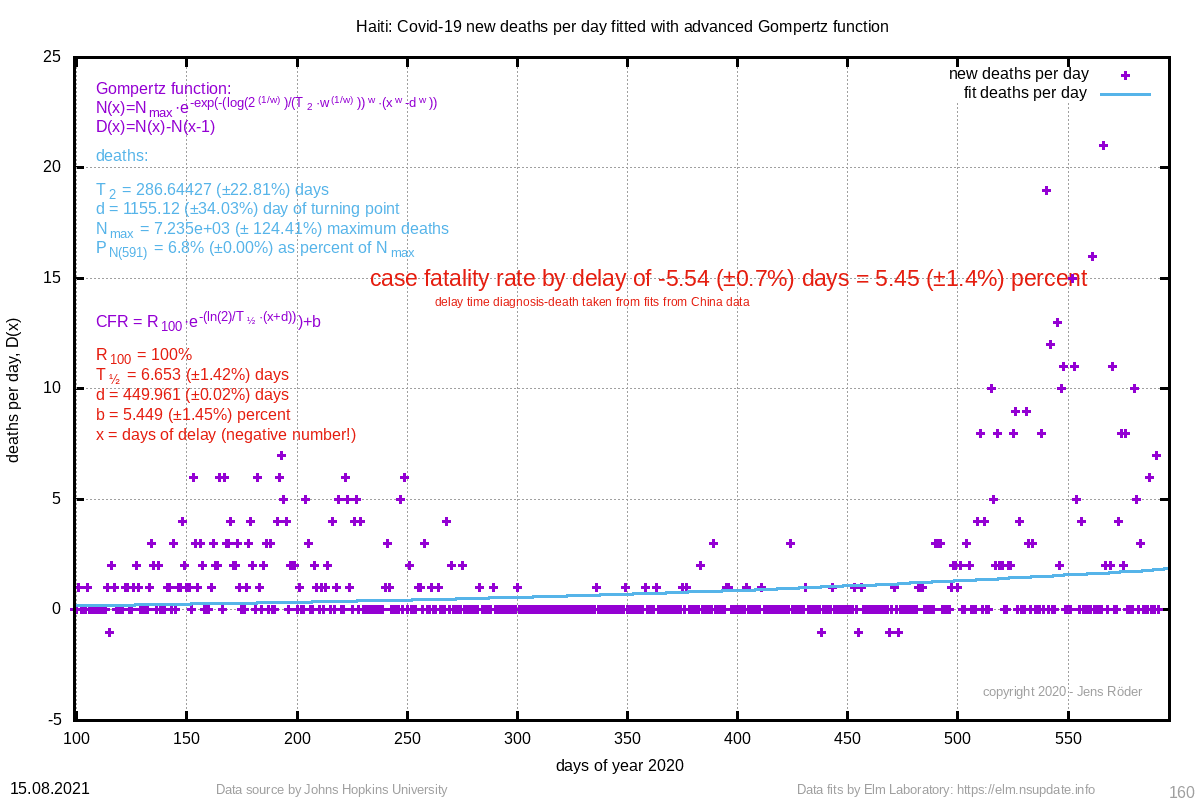 | 286.644 (±22.8%) | 1155.12 (±34.0%) |
| 534 | 758 (±2.6%) | 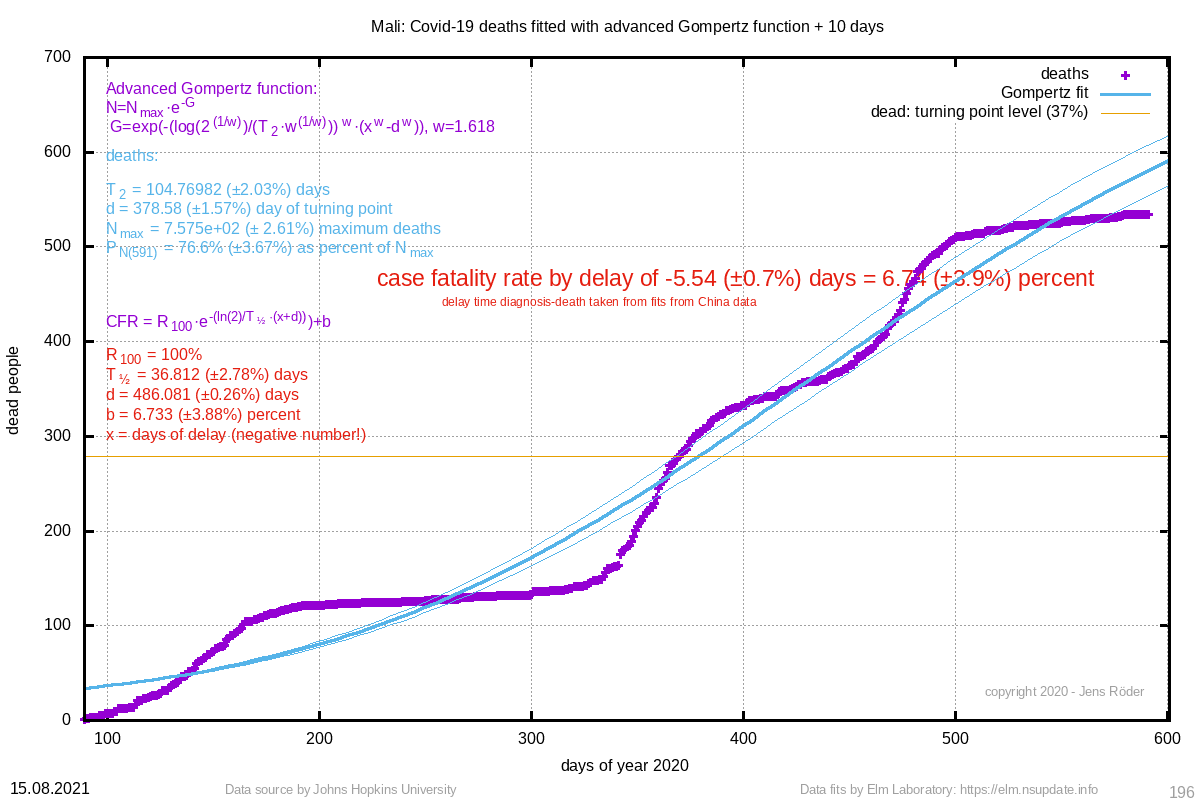 | Mali | 6.74 (±3.9%) |  | 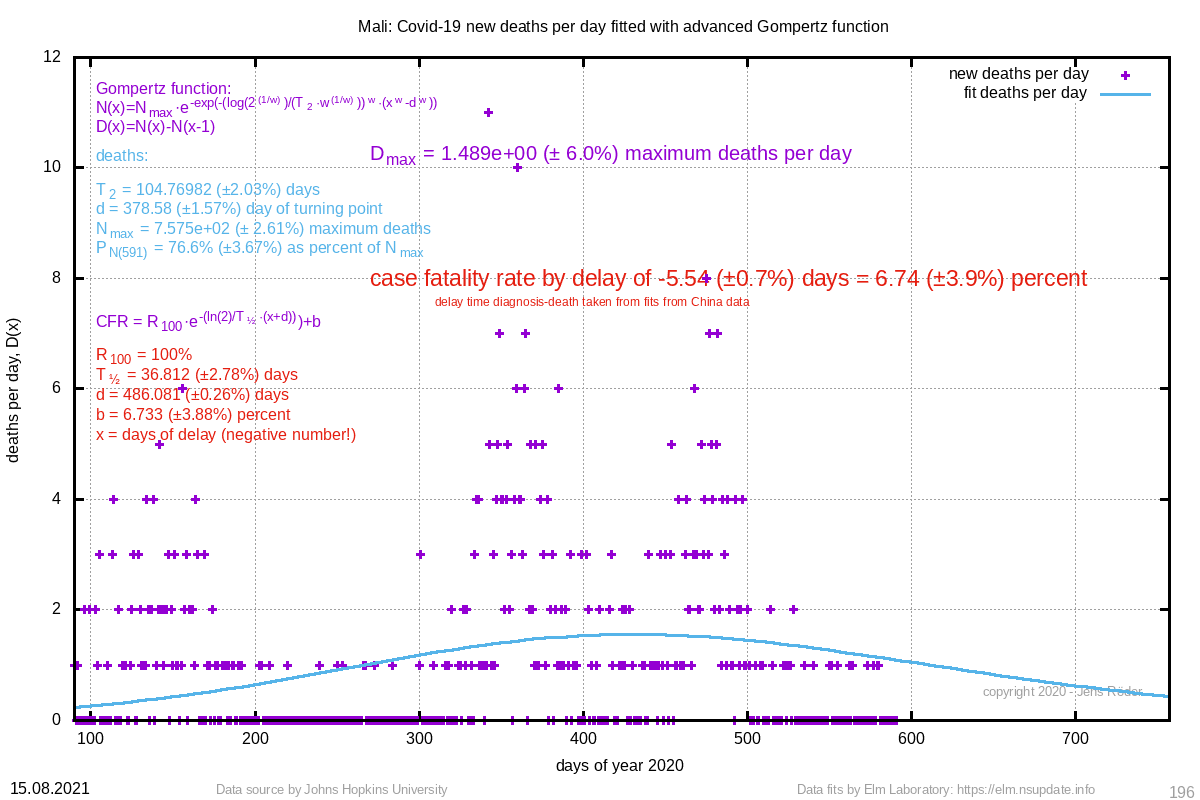 | 104.770 (±2.0%) | 378.58 (±1.6%) |
| 344 | 329 (±0.2%) |  | Belize | 3.29 (±4.4%) | 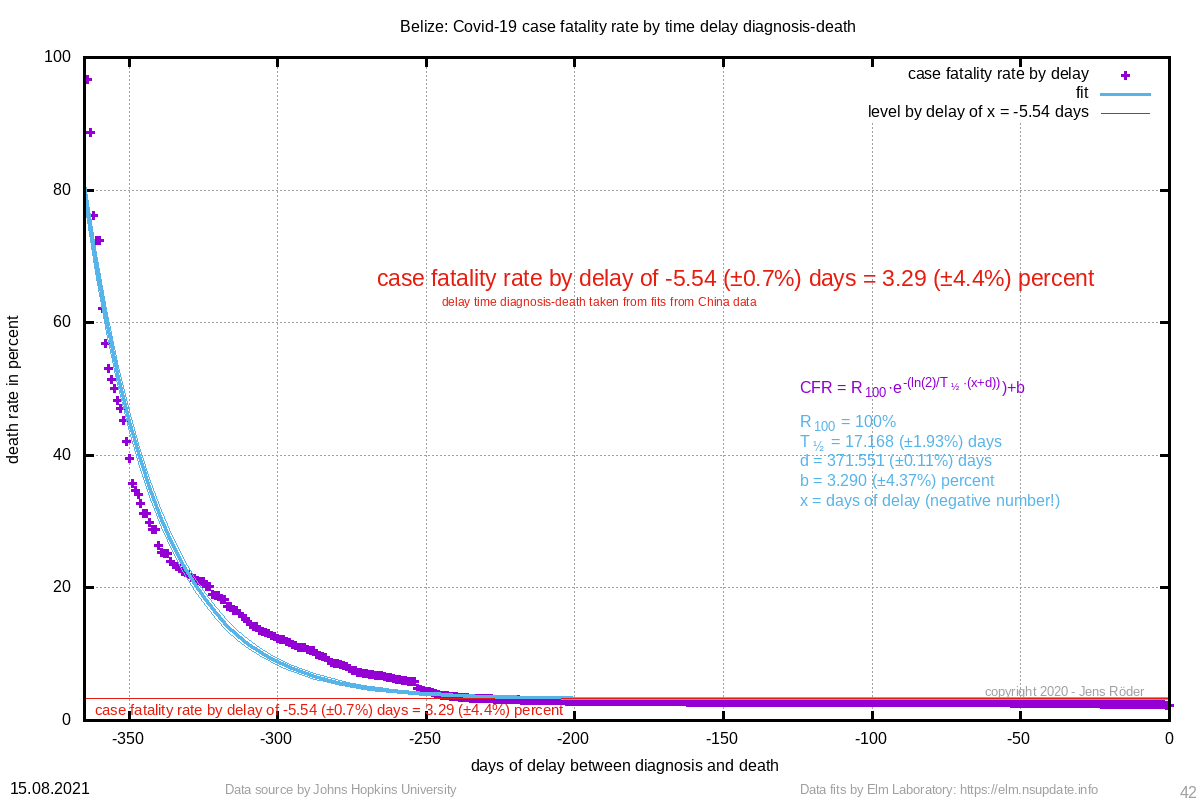 | 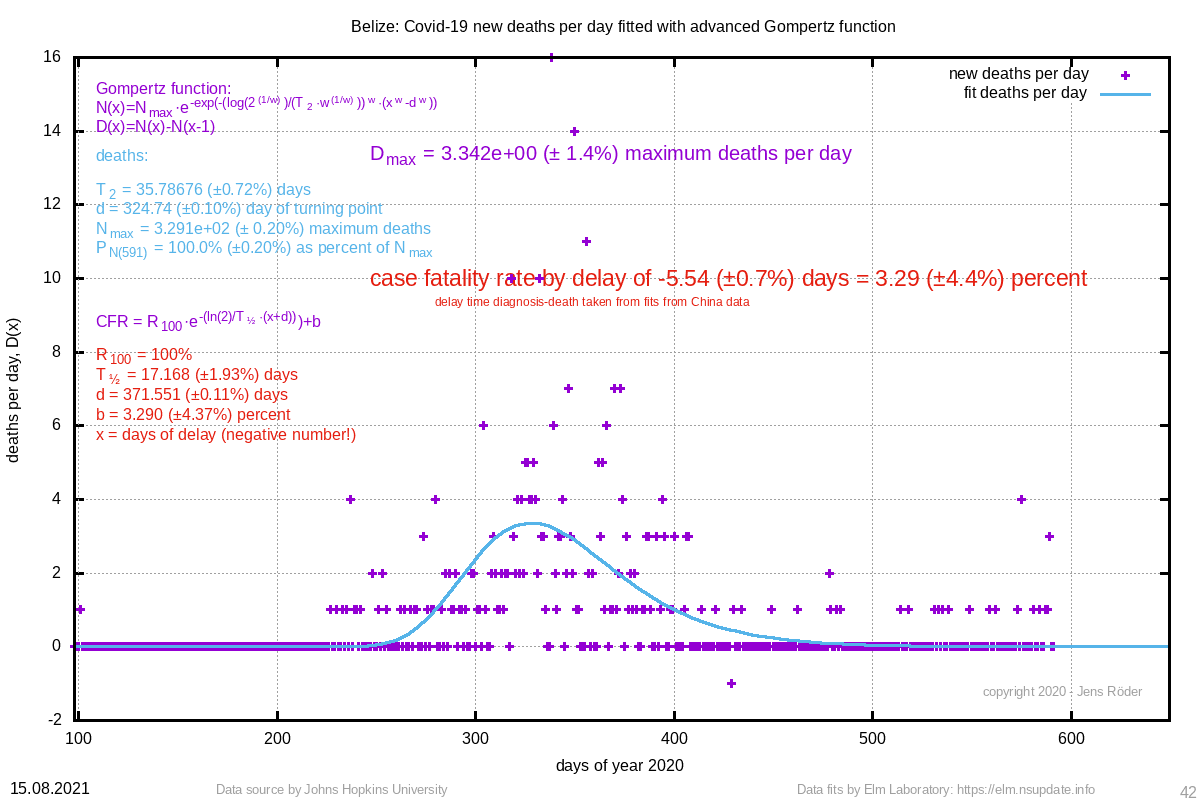 | 35.787 (±0.7%) | 324.74 (±0.1%) |
| 311 | 248 (±1.1%) | 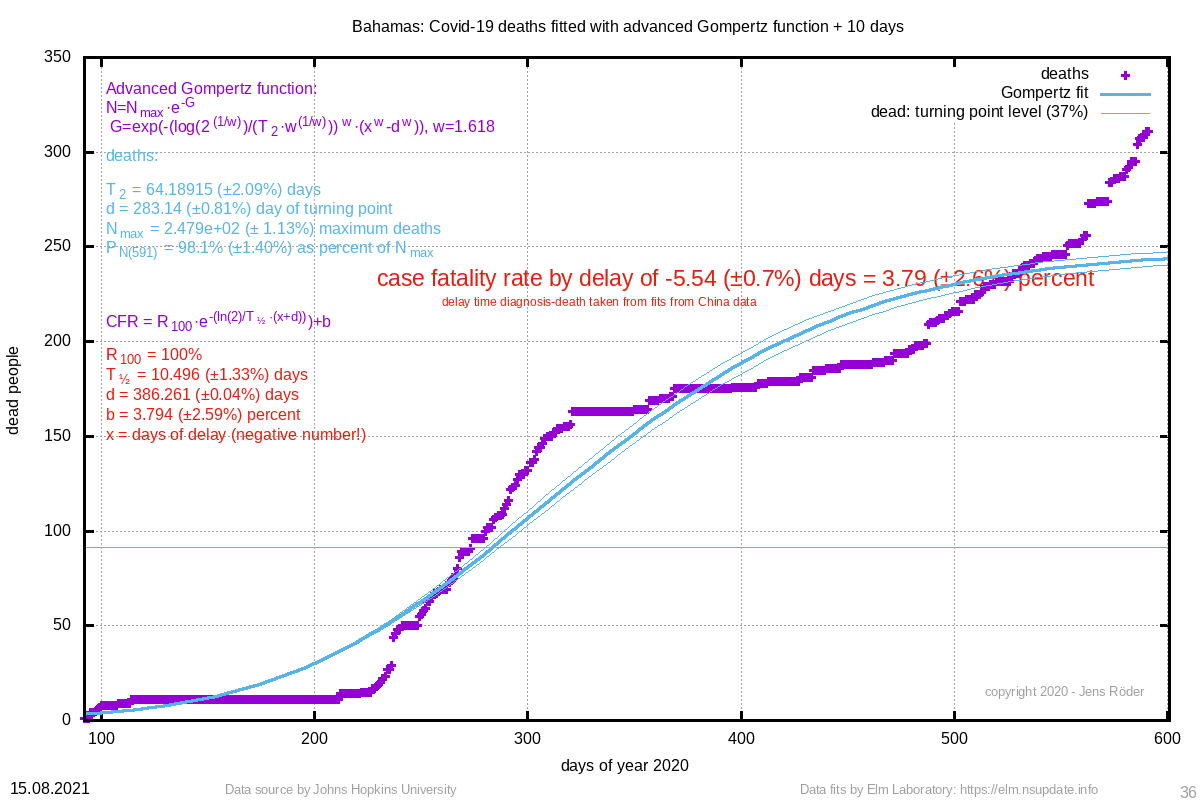 | Bahamas | 3.79 (±2.6%) |  | 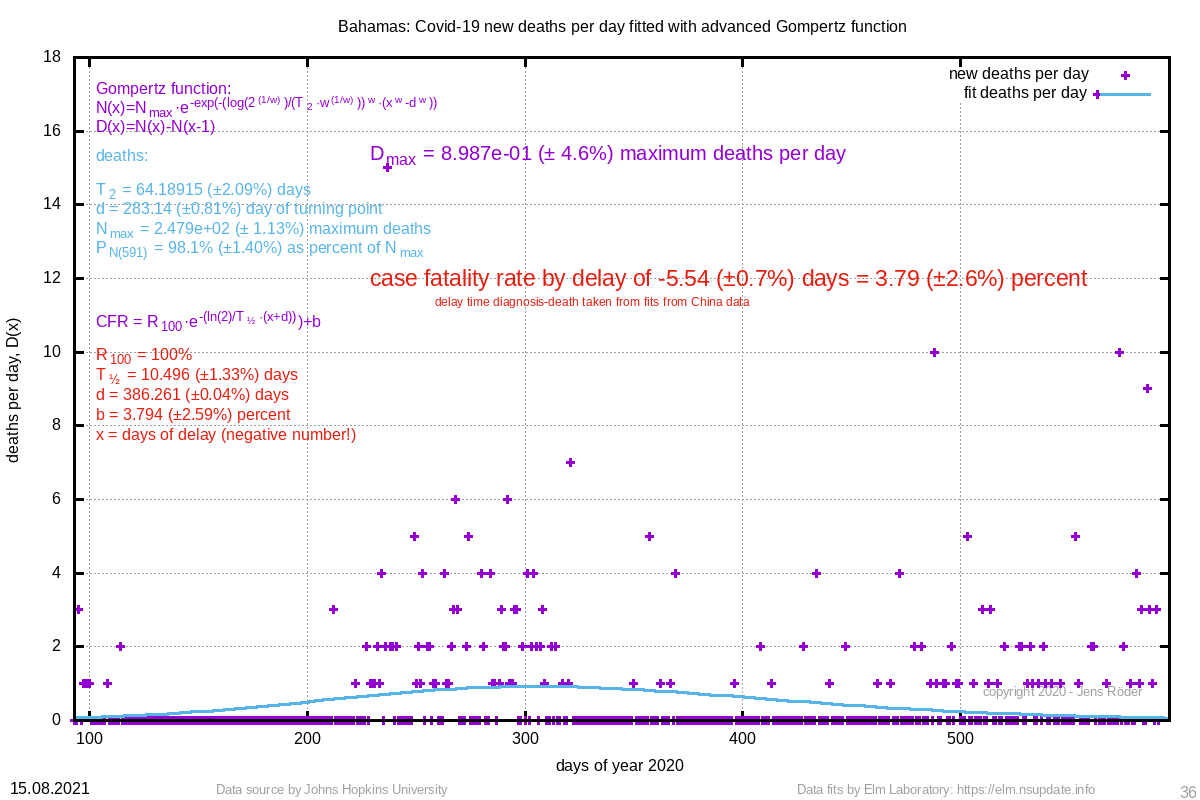 | 64.189 (±2.1%) | 283.14 (±0.8%) |
| 298 | 466 (±2.9%) | 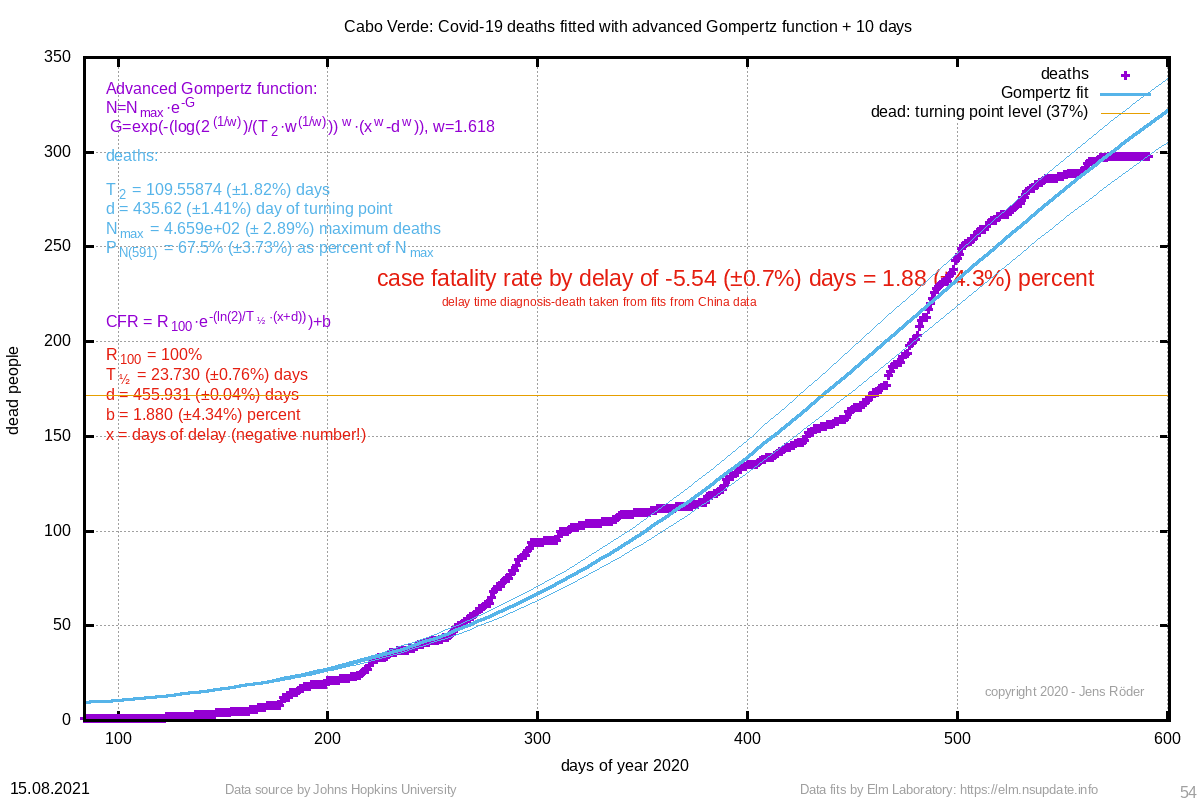 | Cabo Verde | 1.88 (±4.3%) | 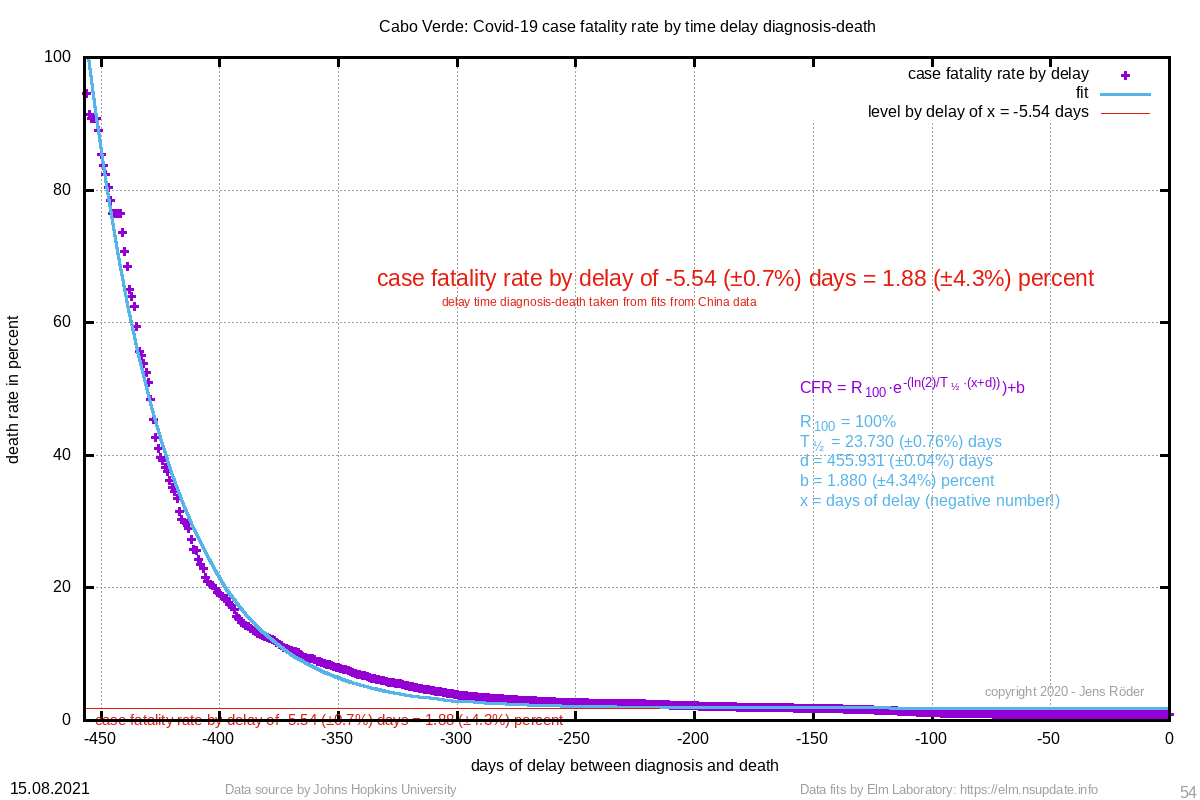 | 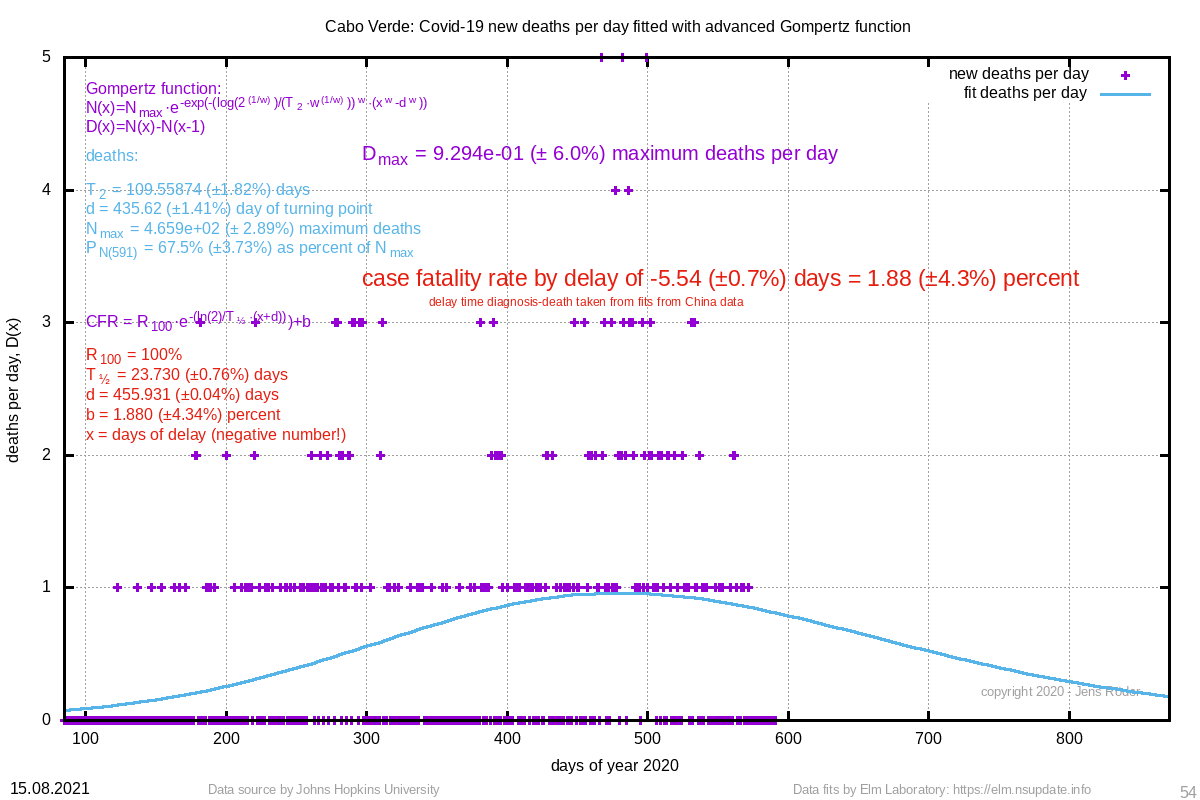 | 109.559 (±1.8%) | 435.62 (±1.4%) |
| 277 | 2748 (±42.9%) | 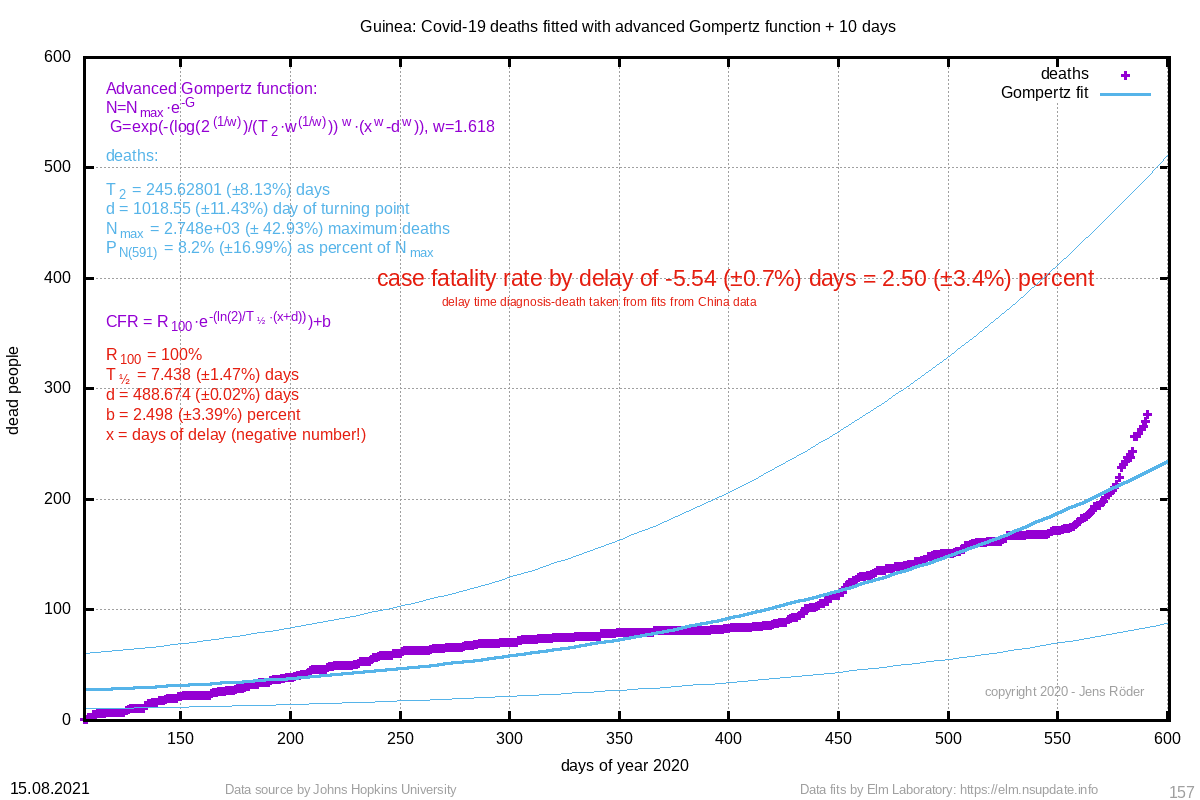 | Guinea | 2.50 (±3.4%) |  | 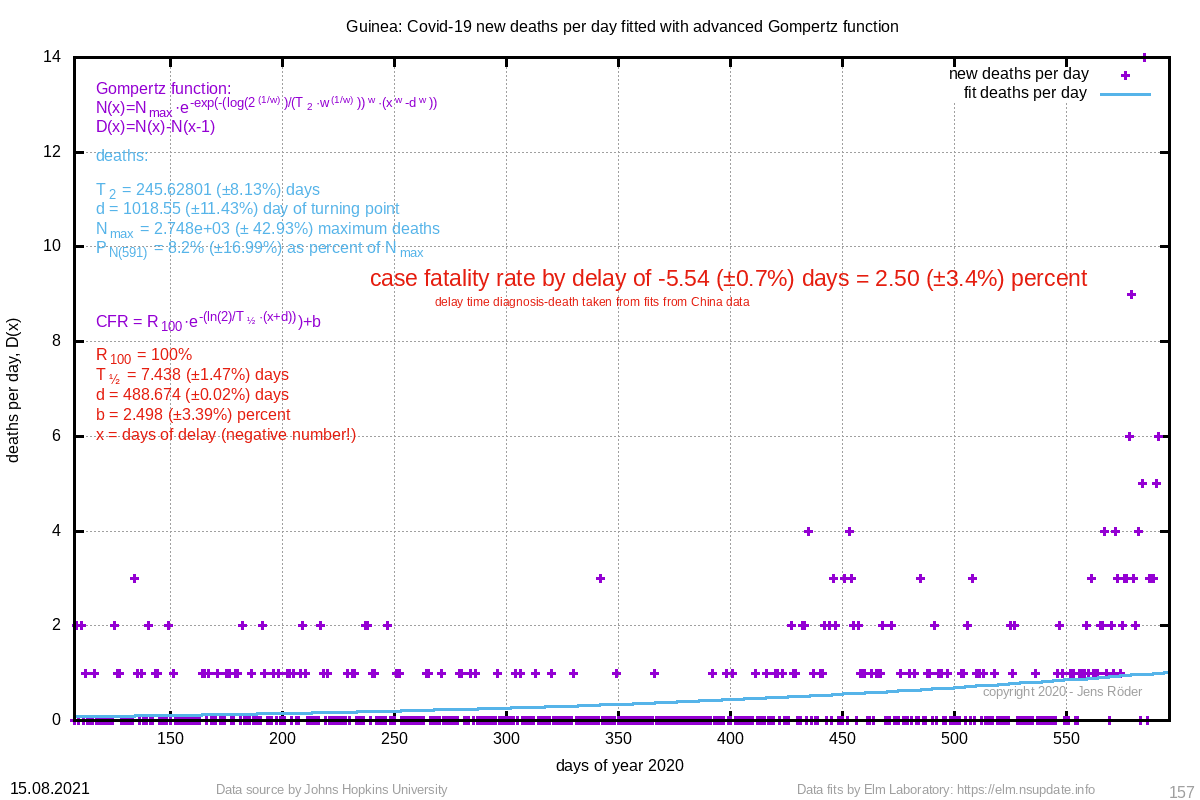 | 245.628 (±8.1%) | 1018.55 (±11.4%) |
| 251 | 182 (±1.1%) |  | Gambia | 5.43 (±1.6%) | 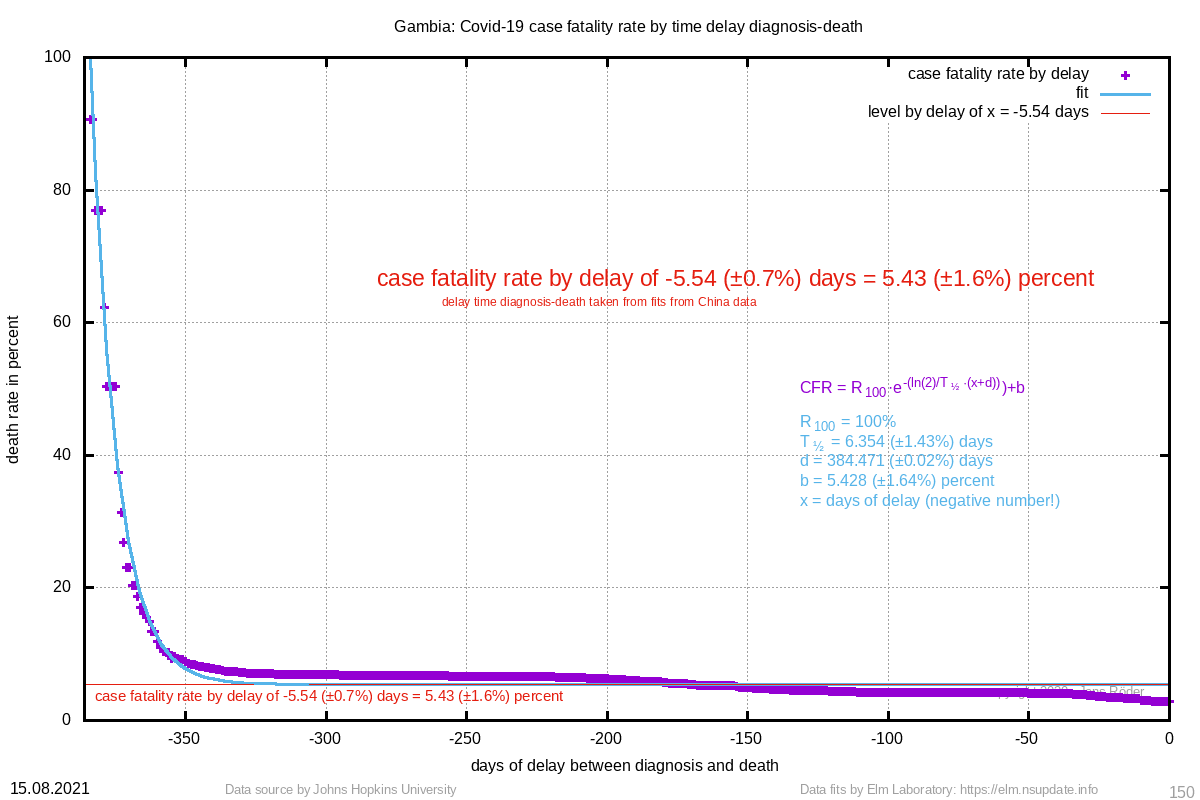 | 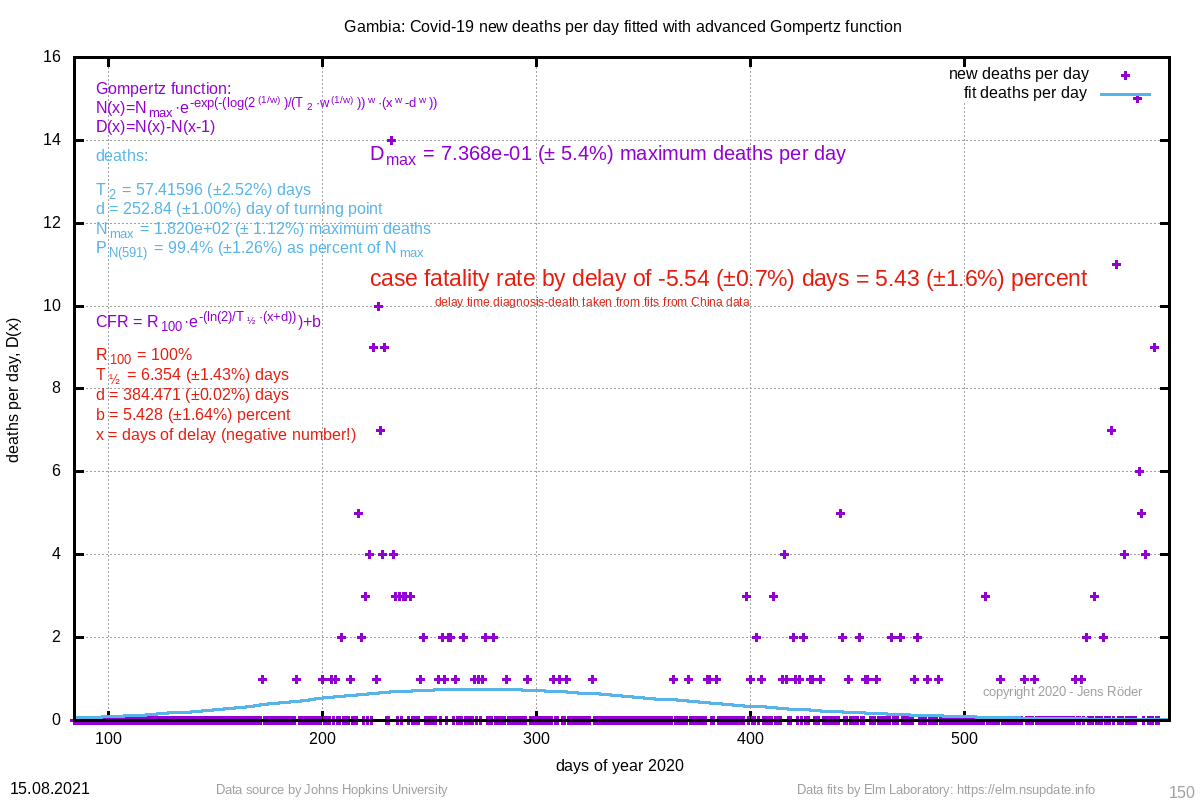 | 57.416 (±2.5%) | 252.84 (±1.0%) |
| 222 | 100281532 (±569.3%) | 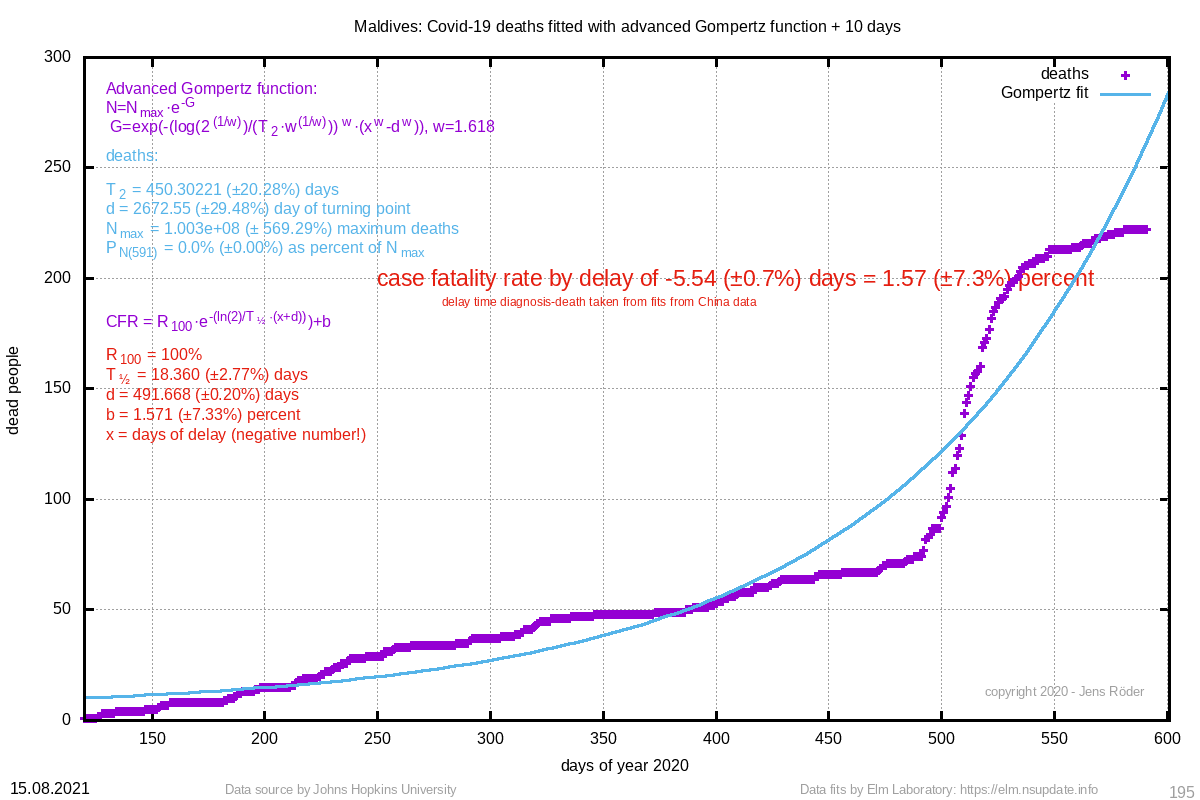 | Maldives | 1.57 (±7.3%) | 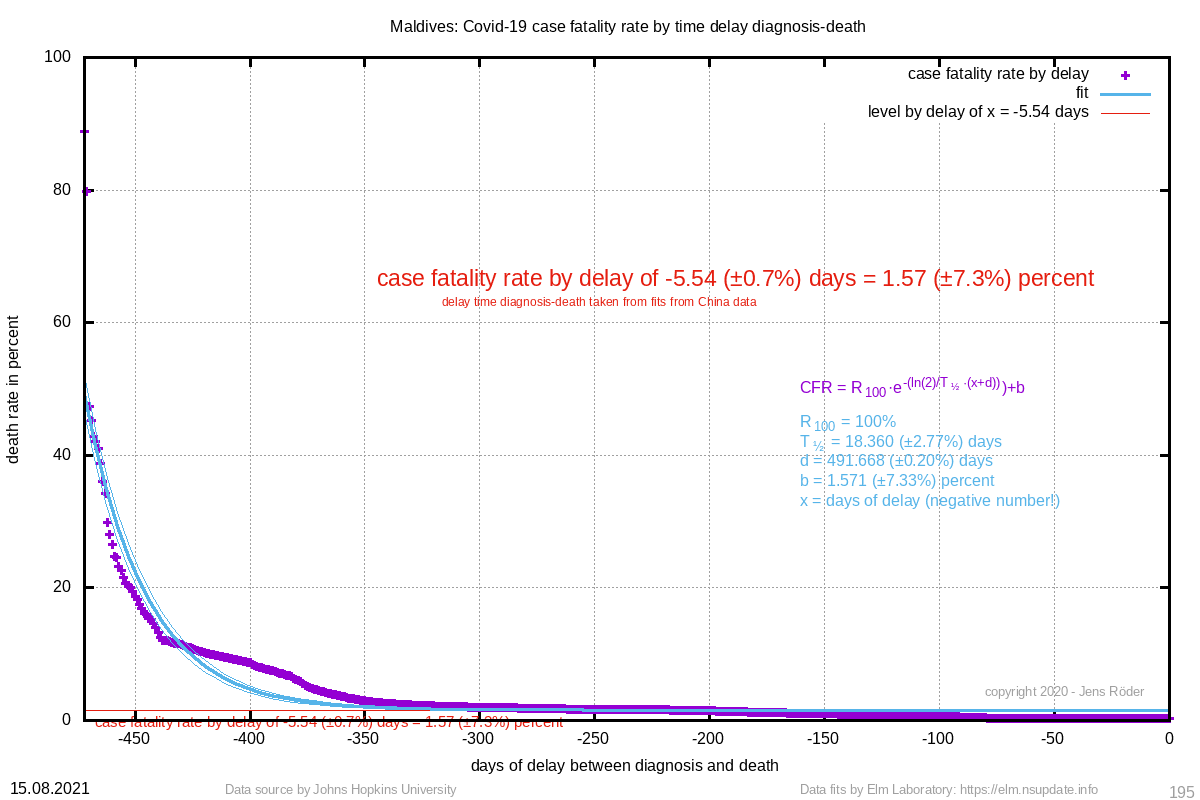 | 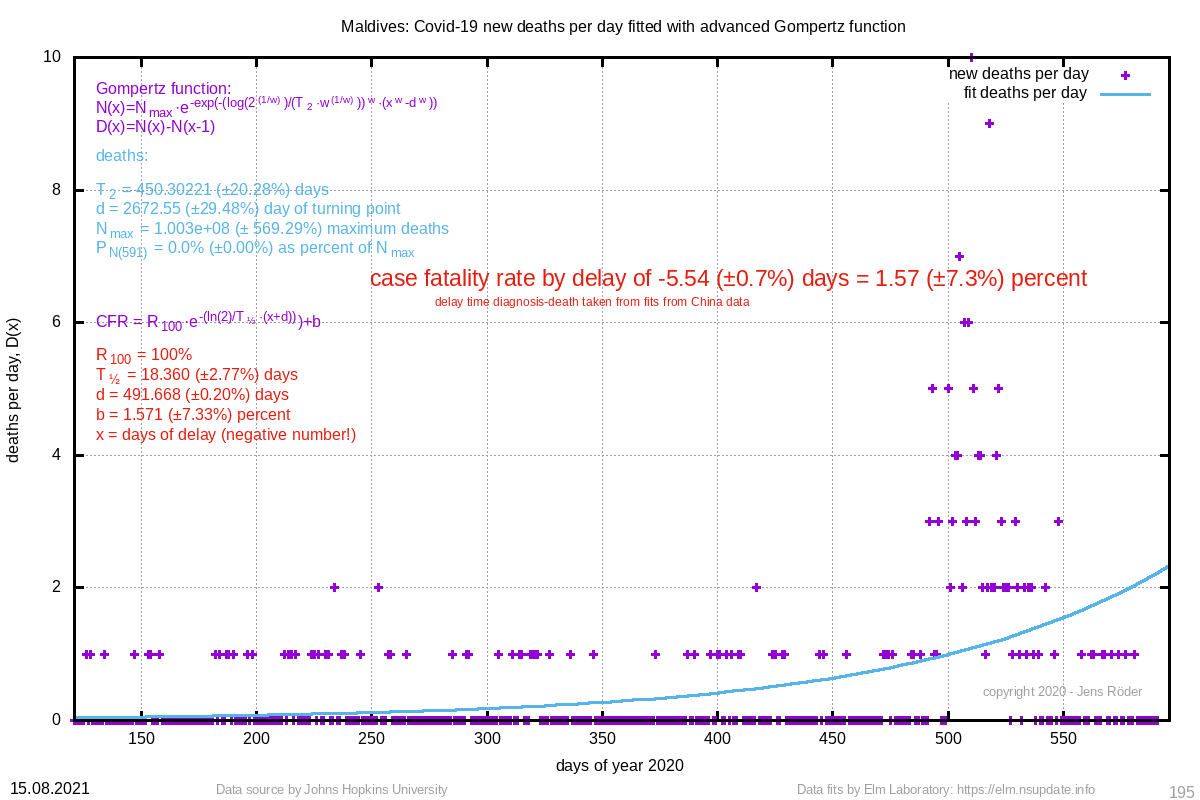 | 450.302 (±20.3%) | 2672.55 (±29.5%) |
| 197 | 1270 (±51.2%) | 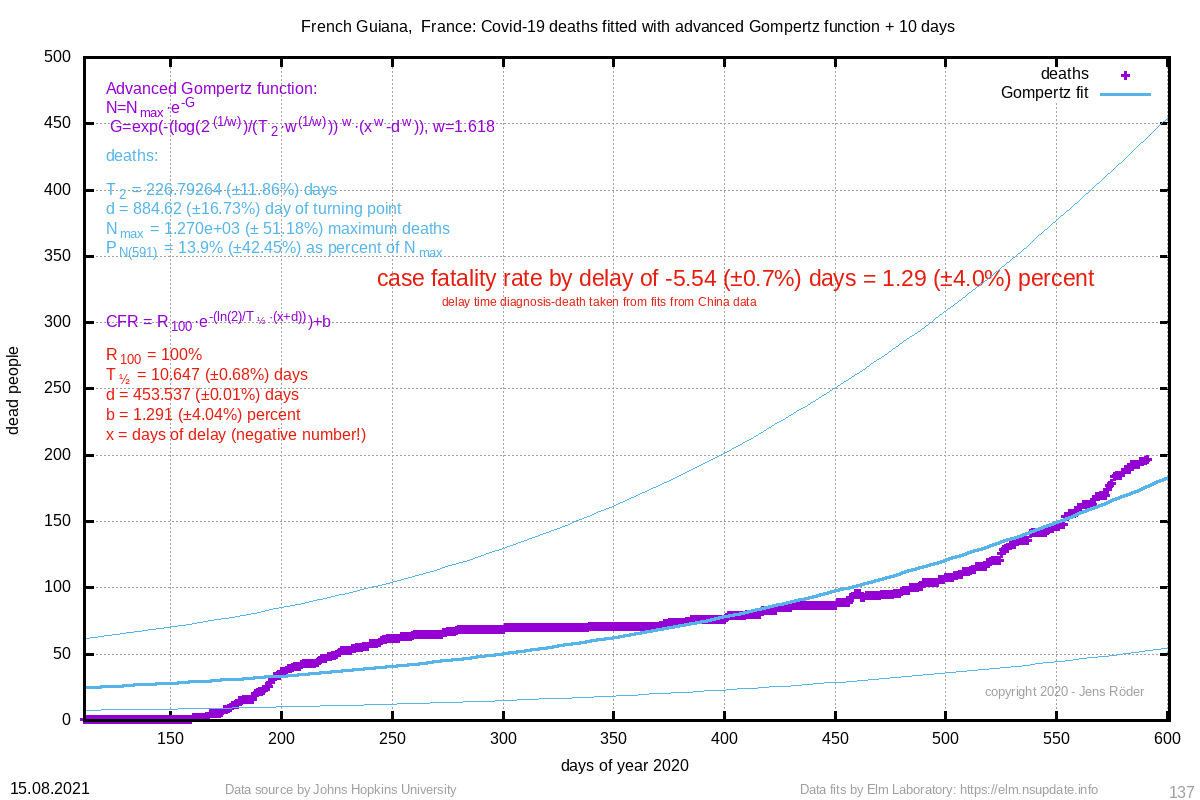 | French Guiana, France | 1.29 (±4.0%) | 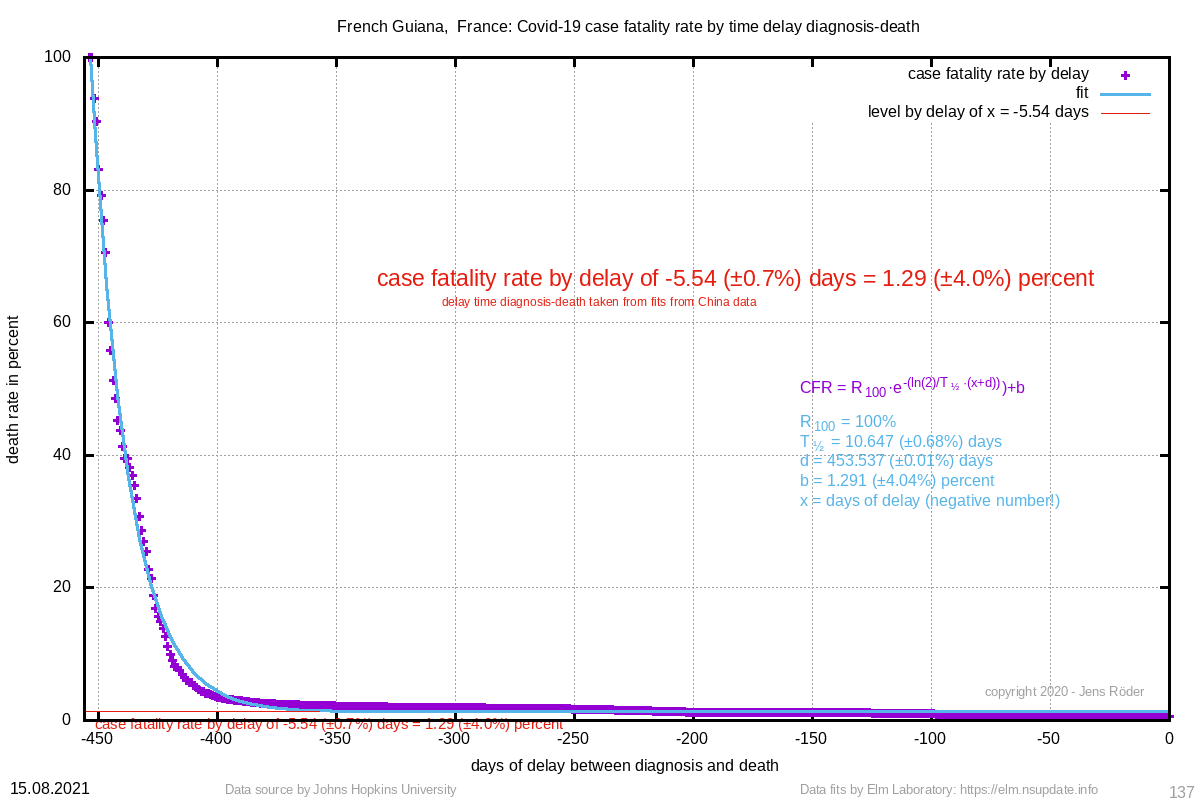 |  | 226.793 (±11.9%) | 884.62 (±16.7%) |
| 196 | 253 (±3.1%) |  | Niger | 2.49 (±62.2%) | 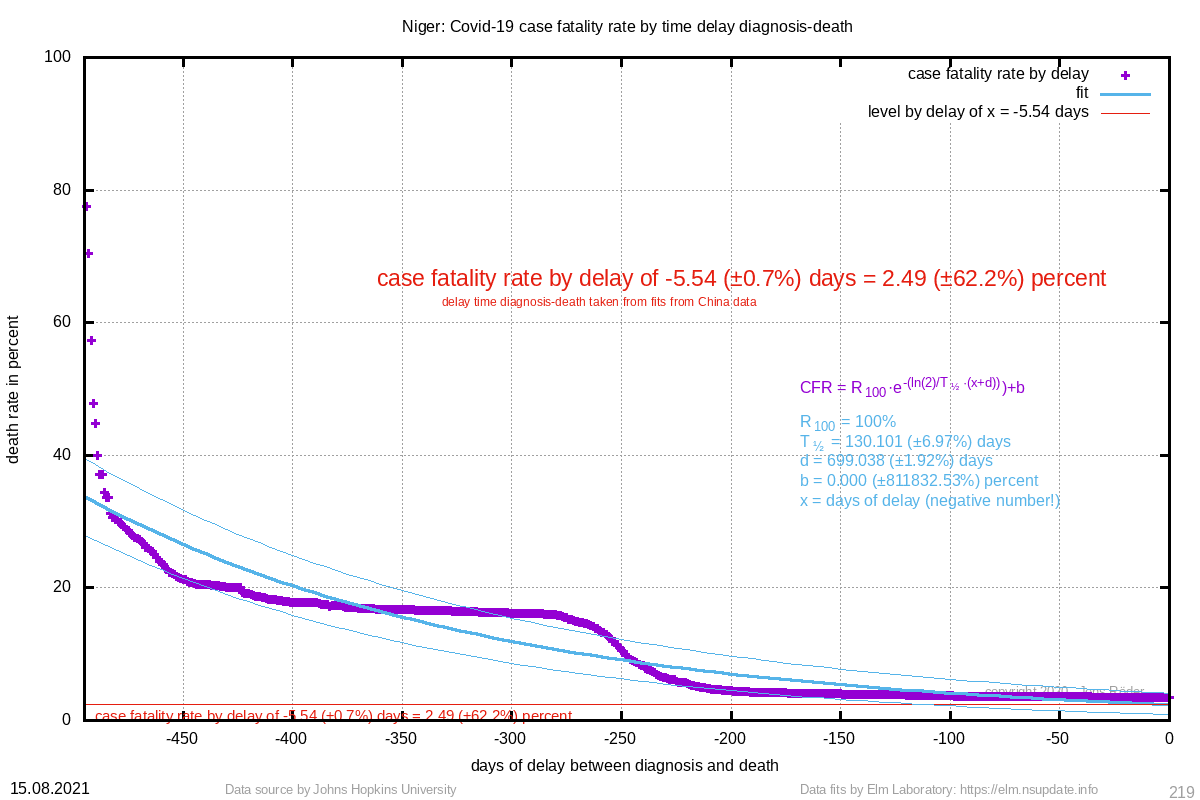 |  | 101.043 (±3.2%) | 302.97 (±2.6%) |
| 188 | 145 (±0.3%) | 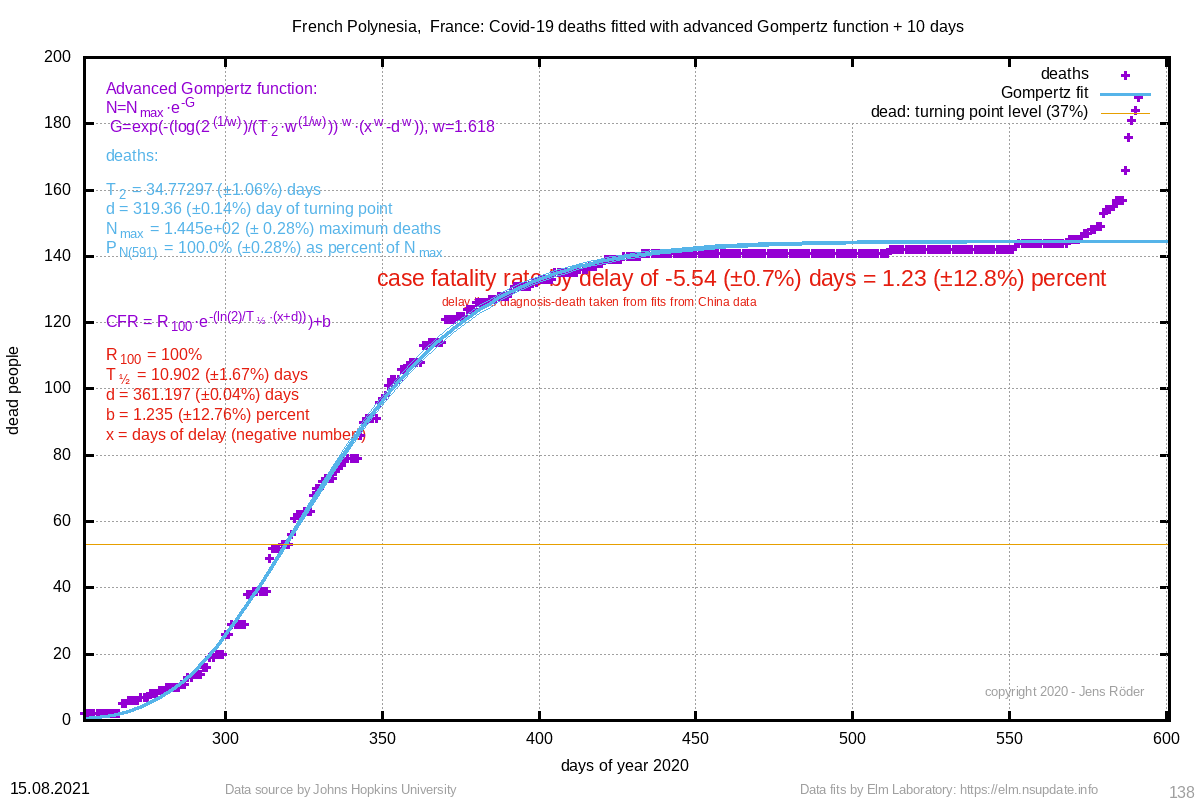 | French Polynesia, France | 1.23 (±12.8%) | 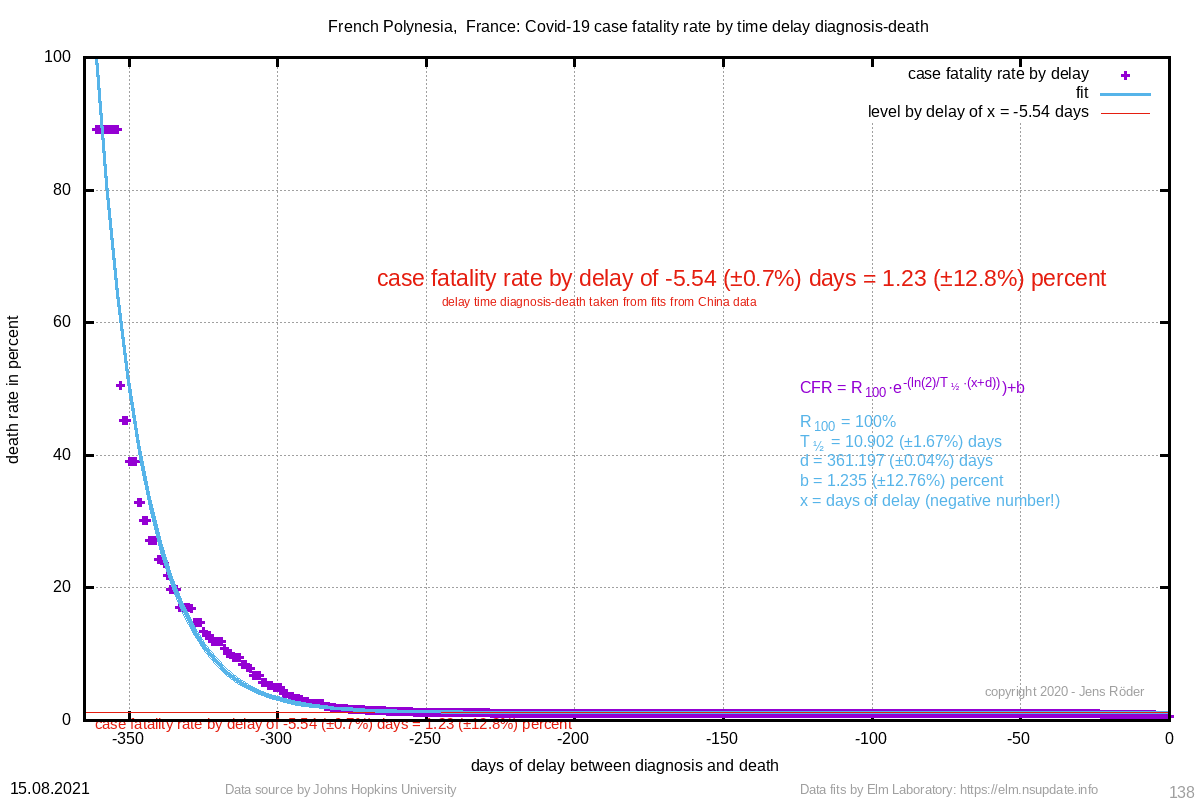 | 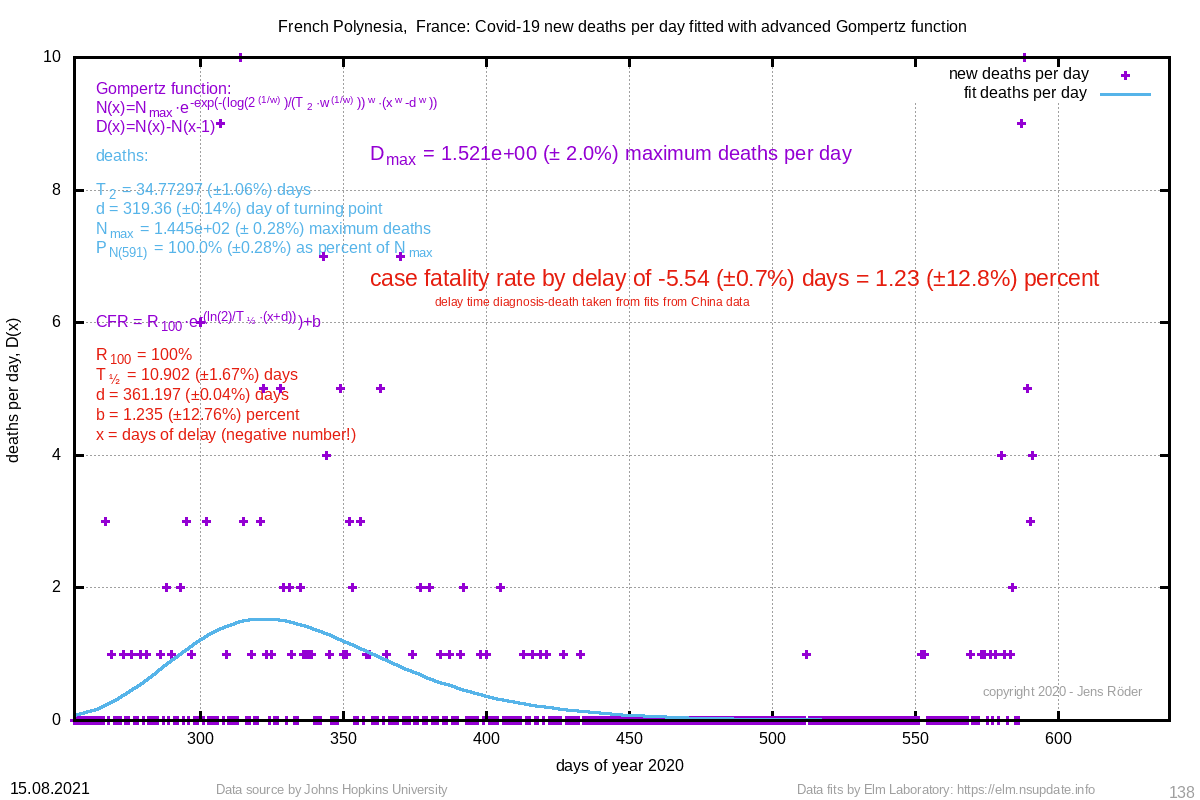 | 34.773 (±1.1%) | 319.36 (±0.1%) |
| 184 | 38654744 (±548.7%) | 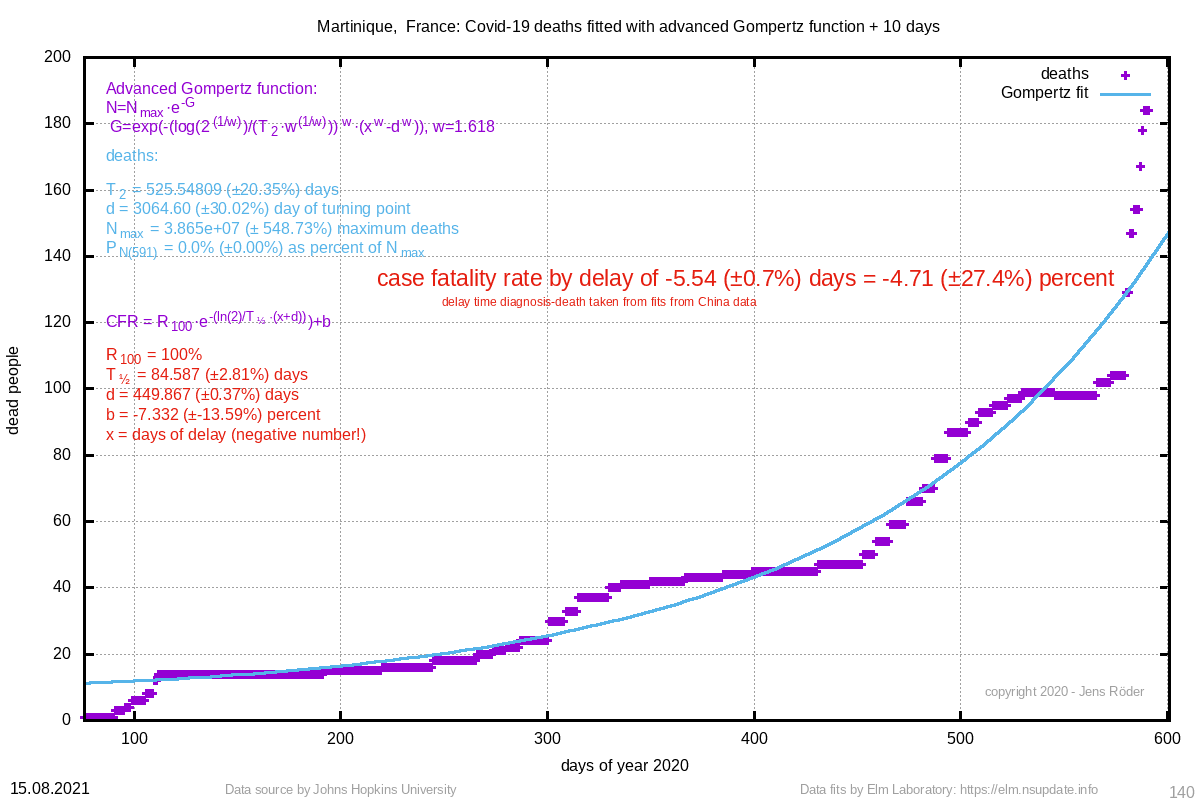 | Martinique, France | -4.71 (±27.4%) | 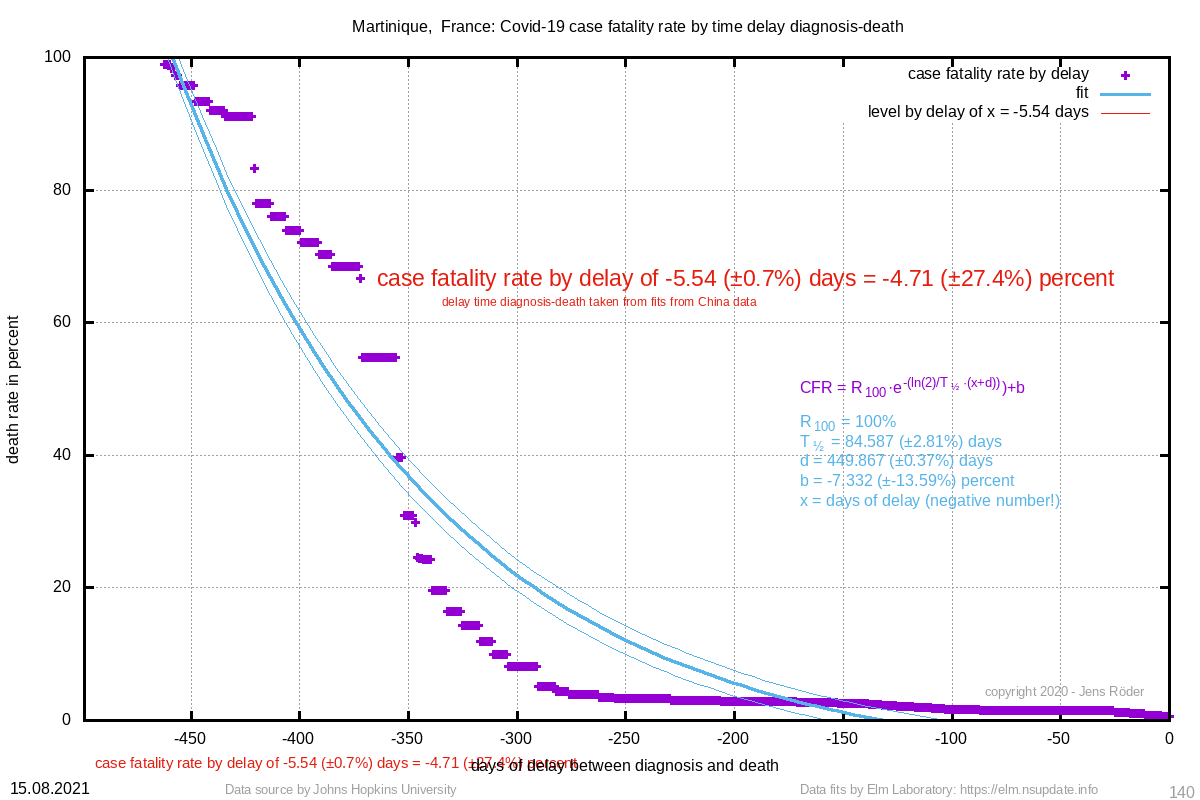 | 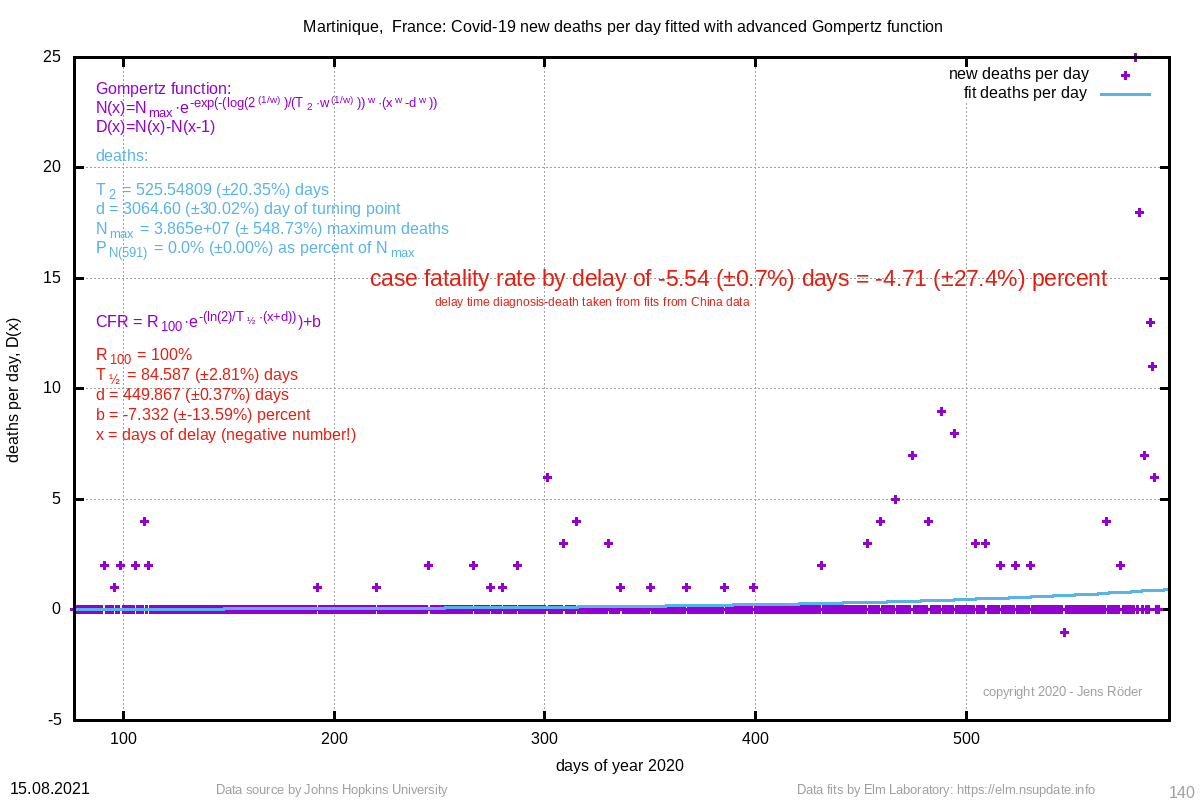 | 525.548 (±20.3%) | 3064.60 (±30.0%) |
| 179 | 172 (±1.2%) |  | Congo (Brazzaville) | 2.13 (±3.2%) |  | 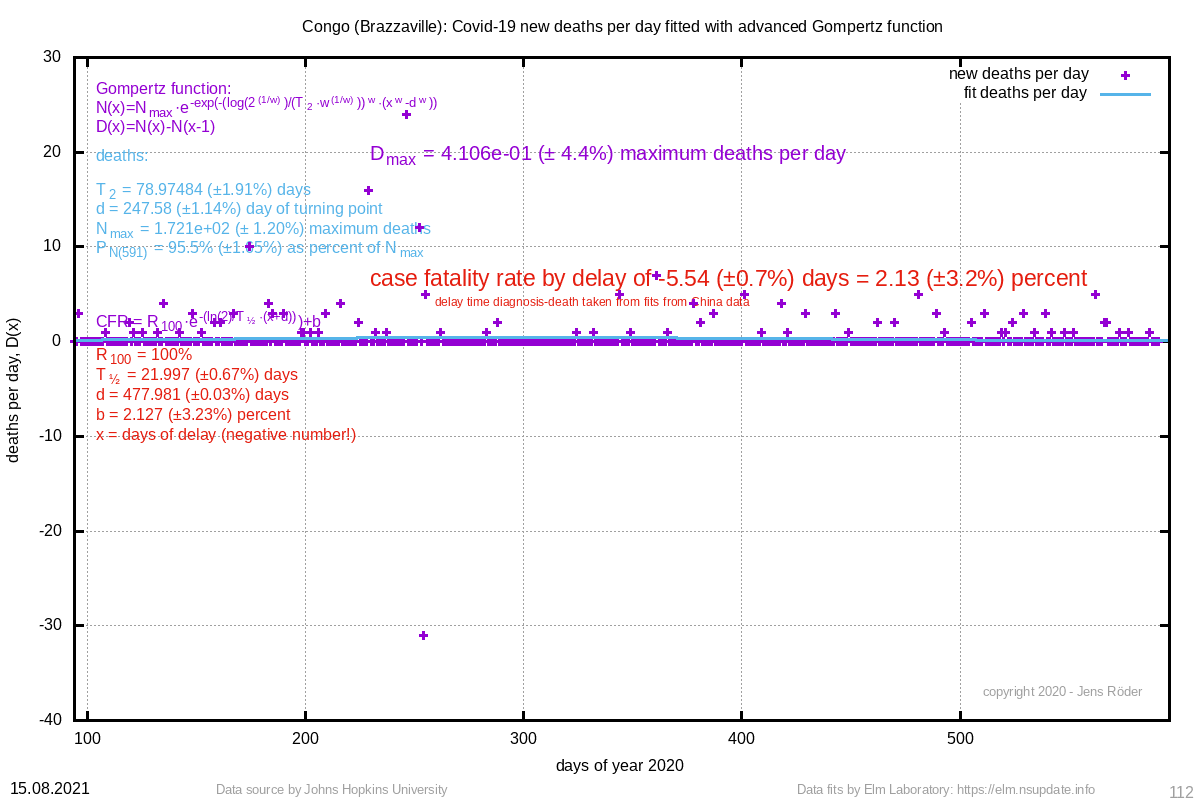 | 78.975 (±1.9%) | 247.58 (±1.1%) |
| 175 | 283 (±5.4%) |  | Mayotte, France | 2.82 (±3.4%) |  | 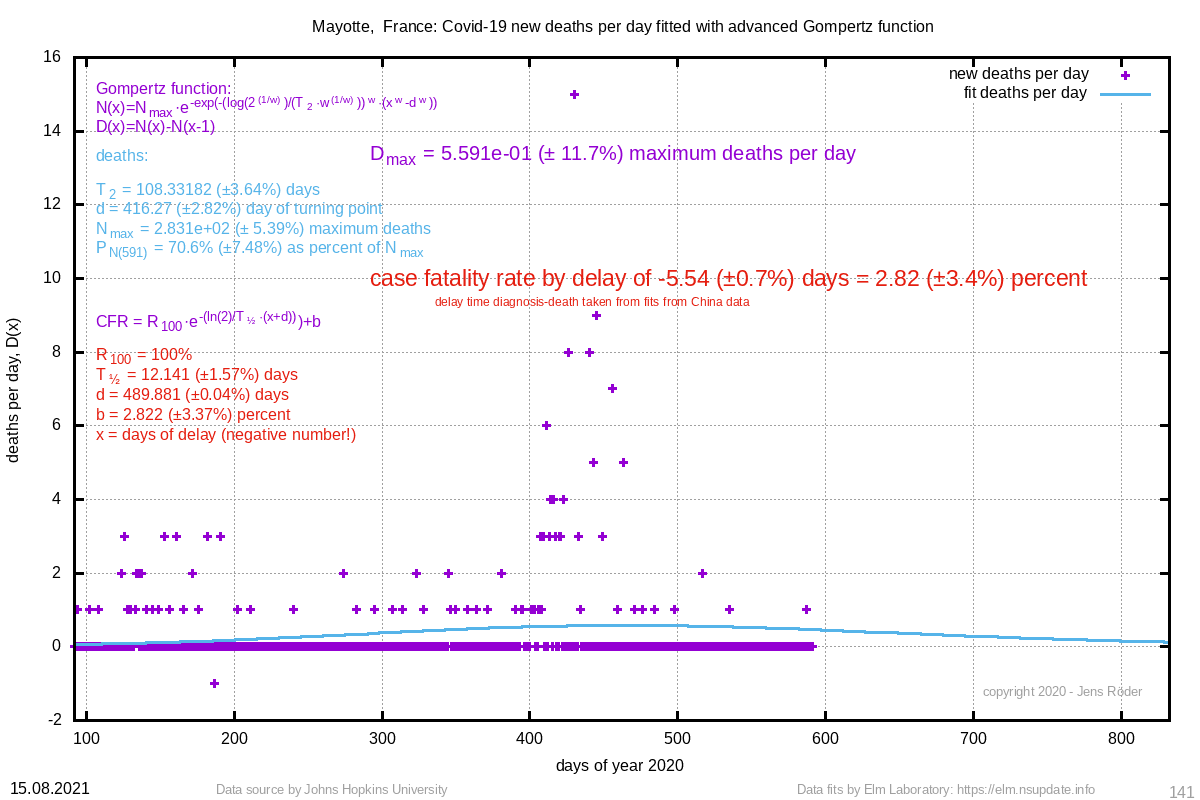 | 108.332 (±3.6%) | 416.27 (±2.8%) |
| 174 | 227 (±2.8%) | 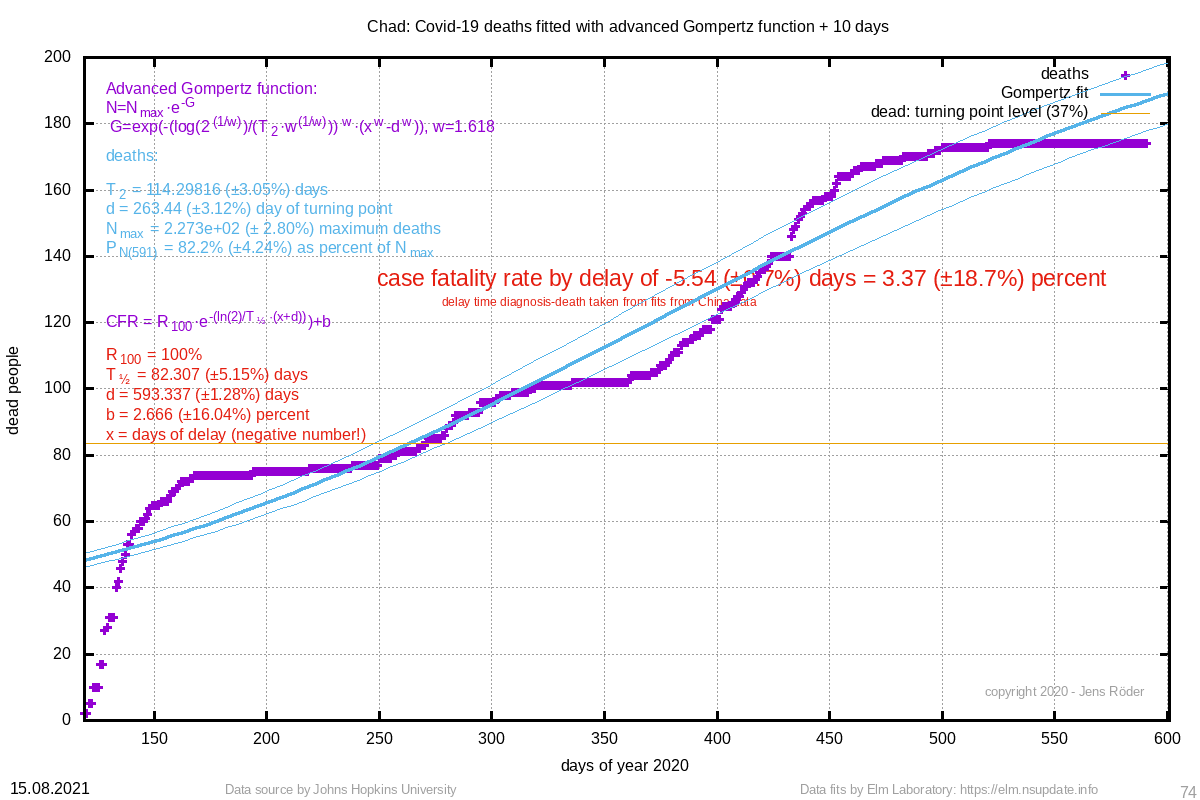 | Chad | 3.37 (±18.7%) | 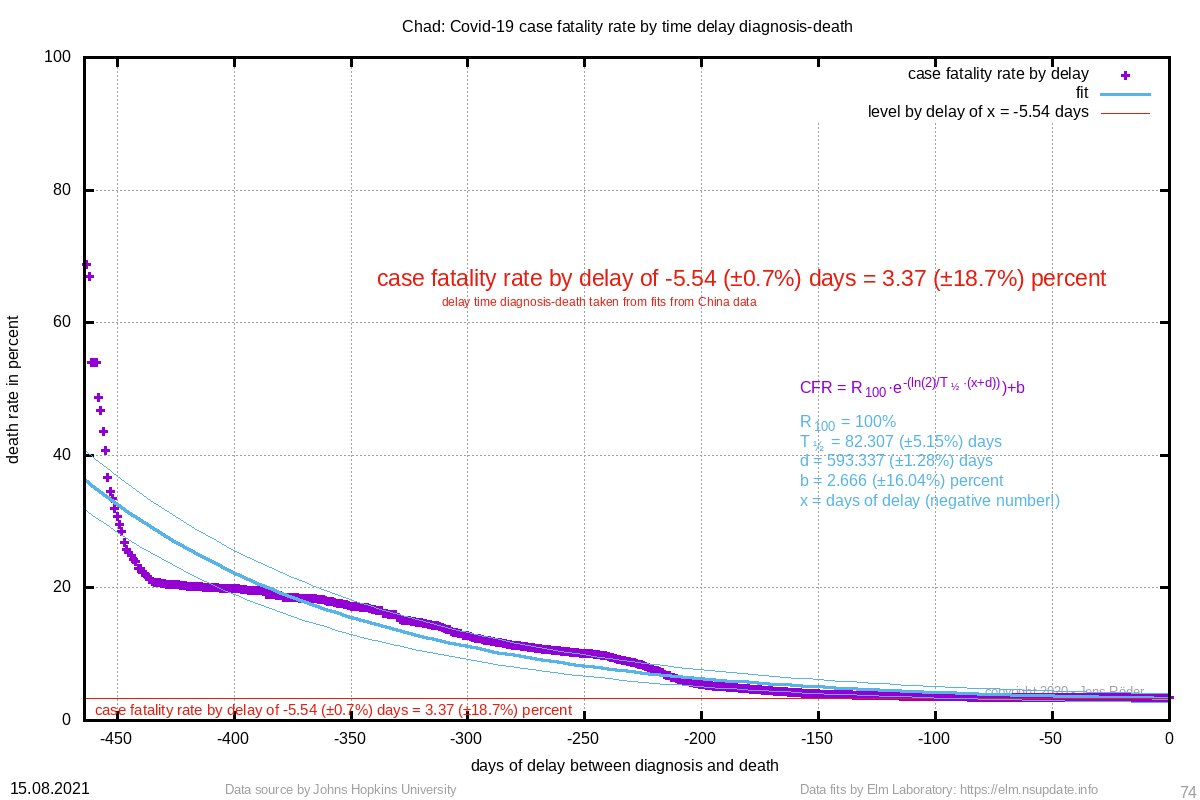 | 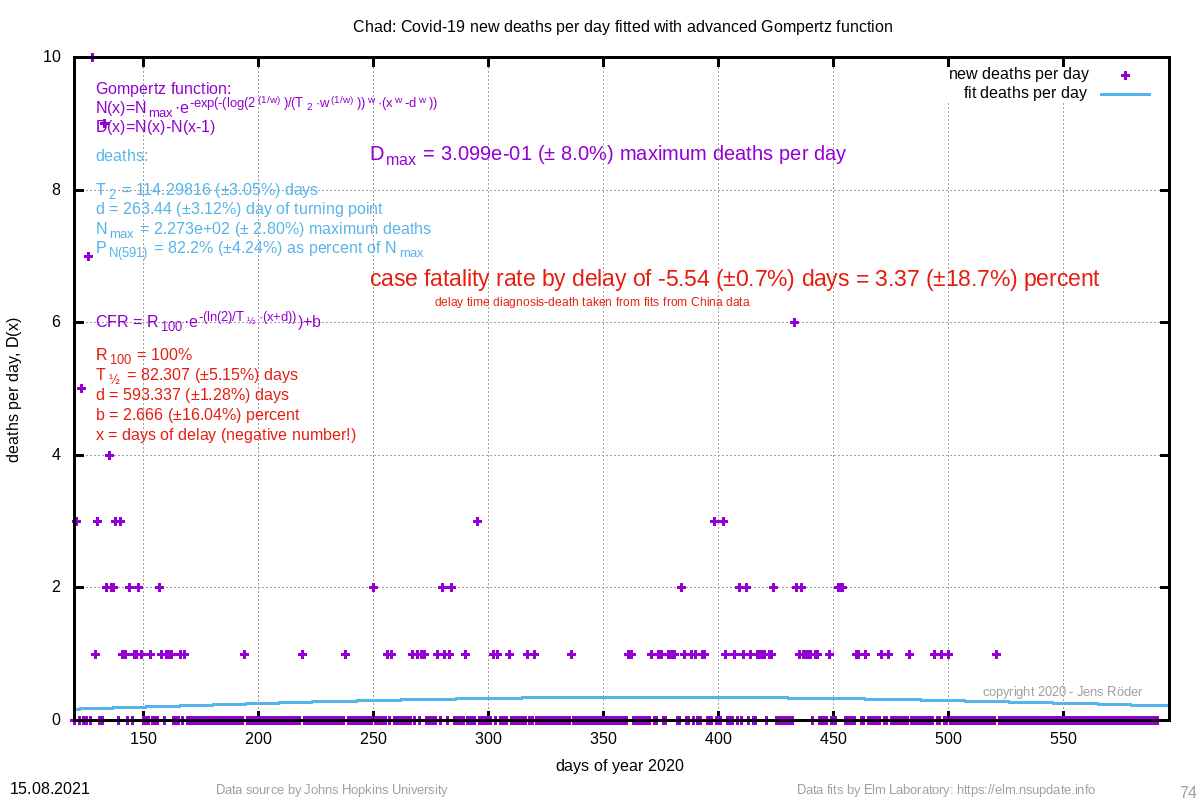 | 114.298 (±3.0%) | 263.44 (±3.1%) |
| 170 | 245 (±3.7%) | 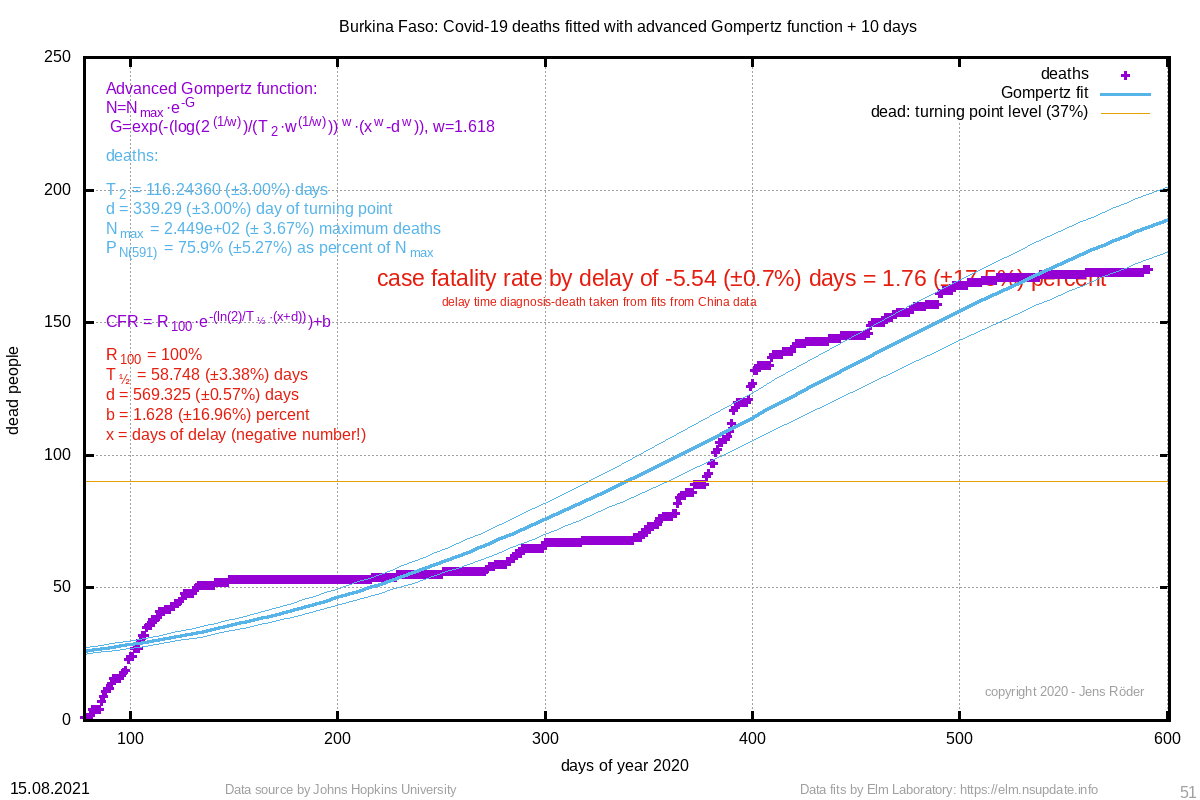 | Burkina Faso | 1.76 (±17.5%) | 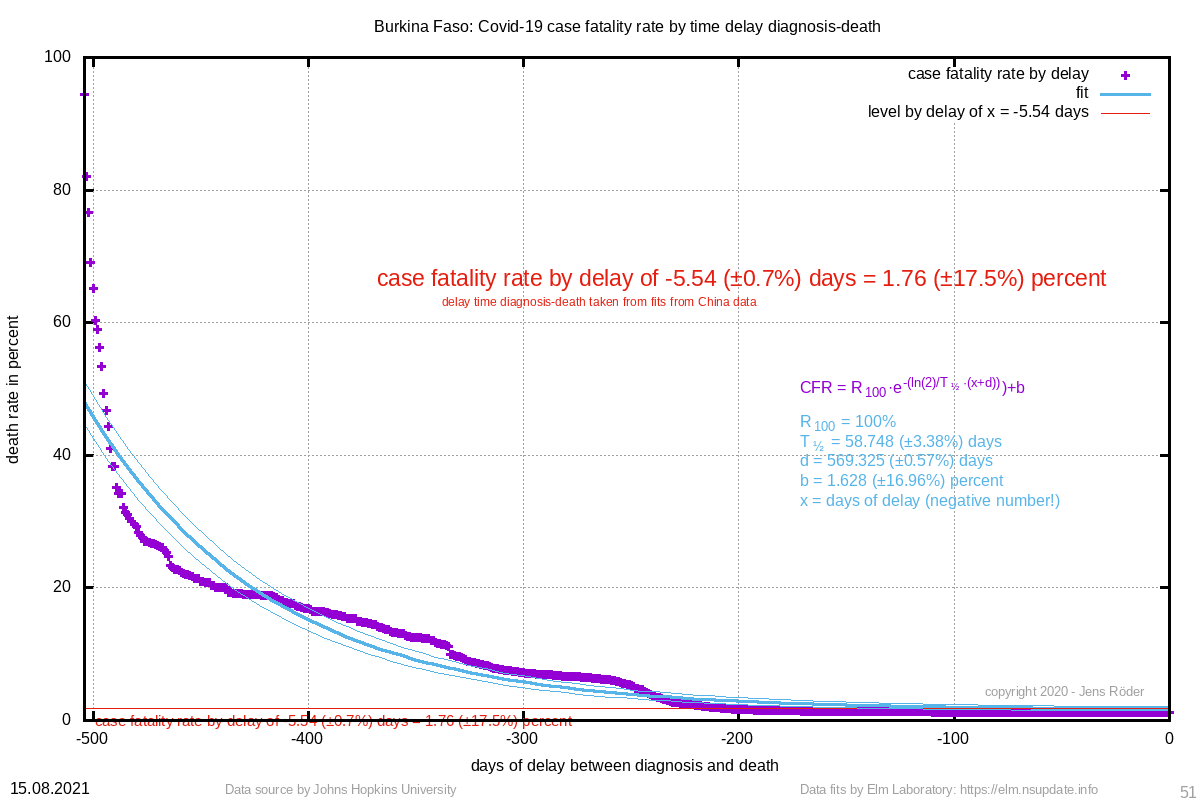 | 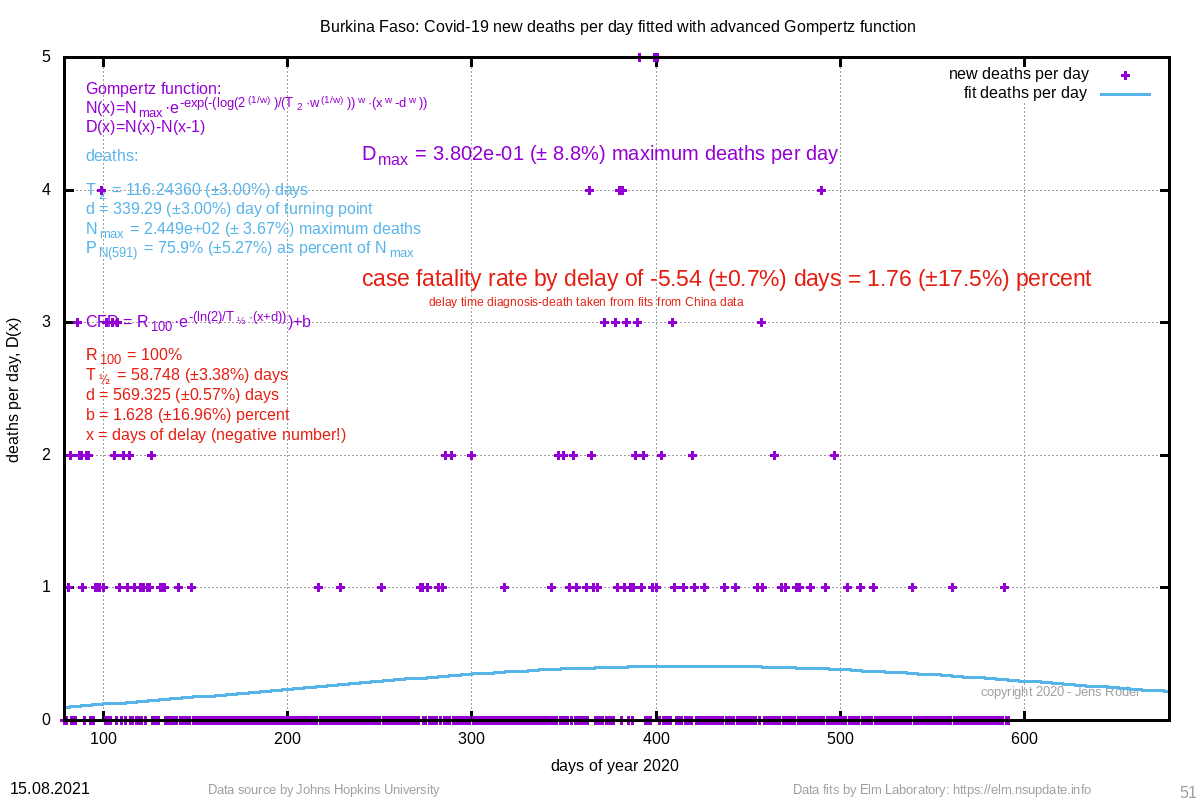 | 116.244 (±3.0%) | 339.29 (±3.0%) |
| 165 | 375897979 (±1106.6%) | 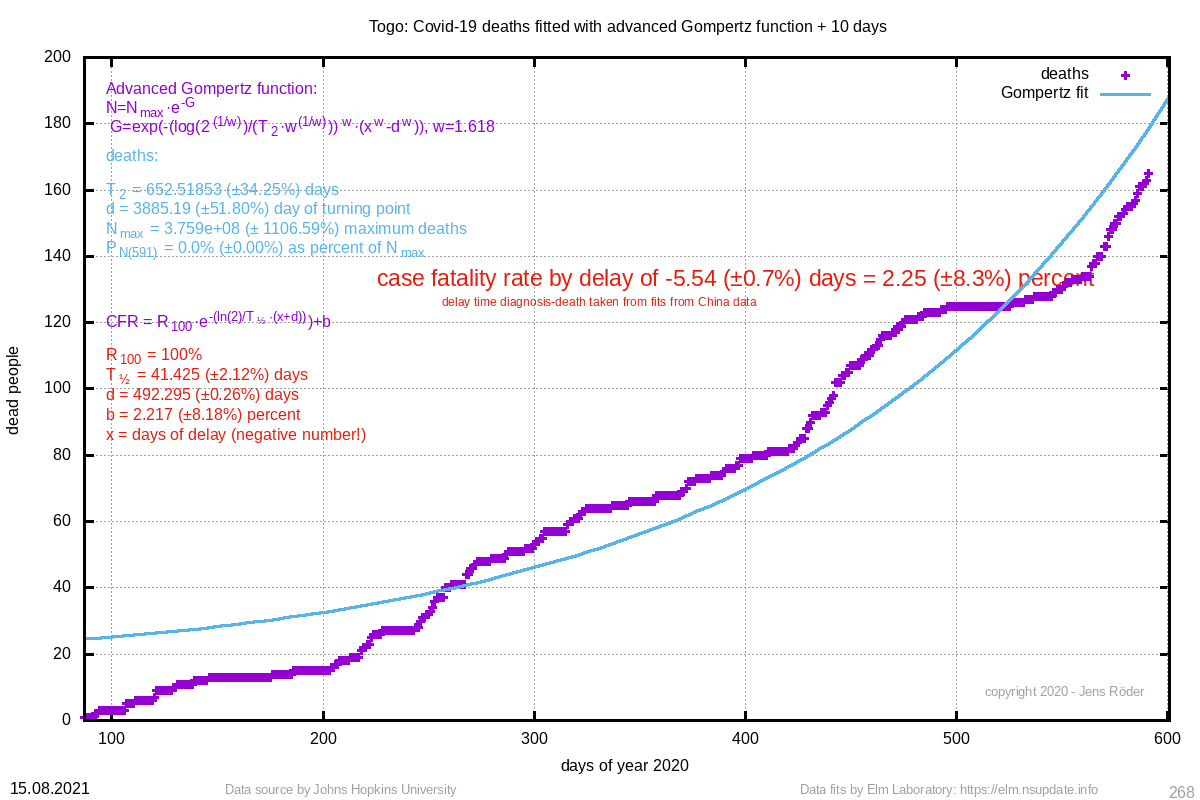 | Togo | 2.25 (±8.3%) | 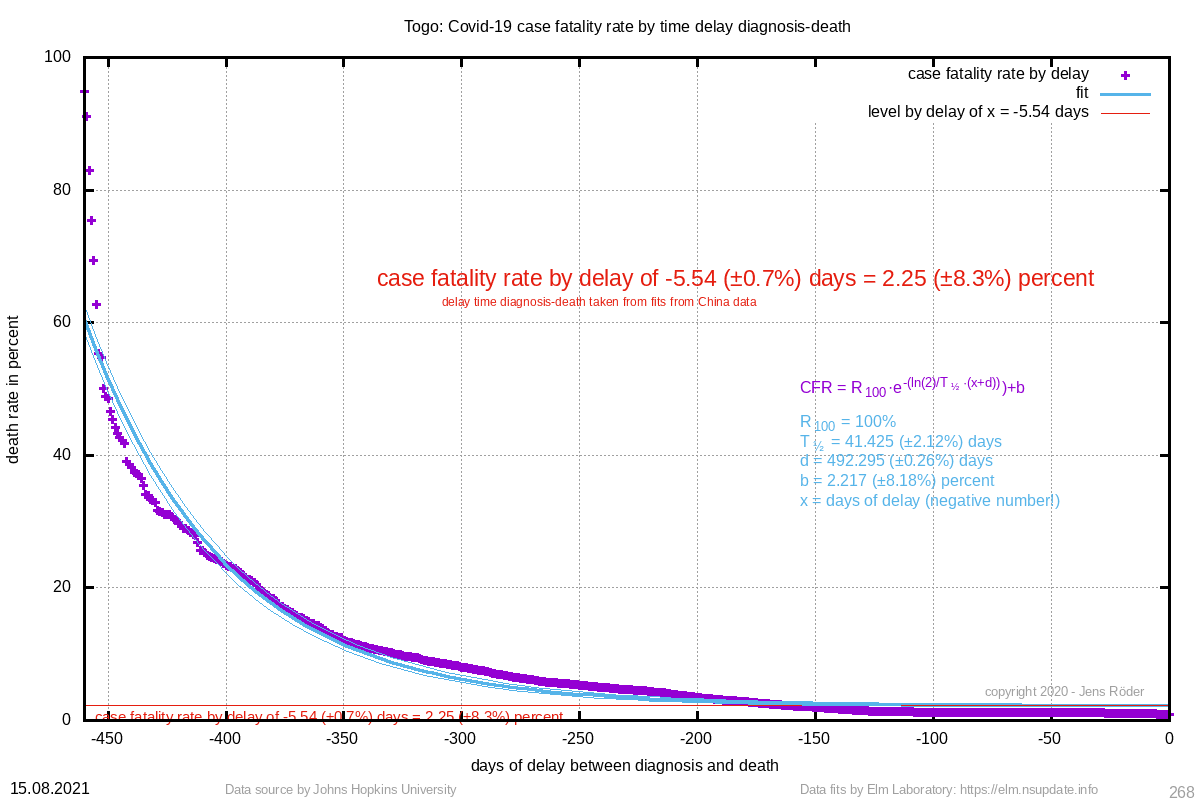 |  | 652.519 (±34.3%) | 3885.19 (±51.8%) |
| 156 | 1433819 (±730.0%) | 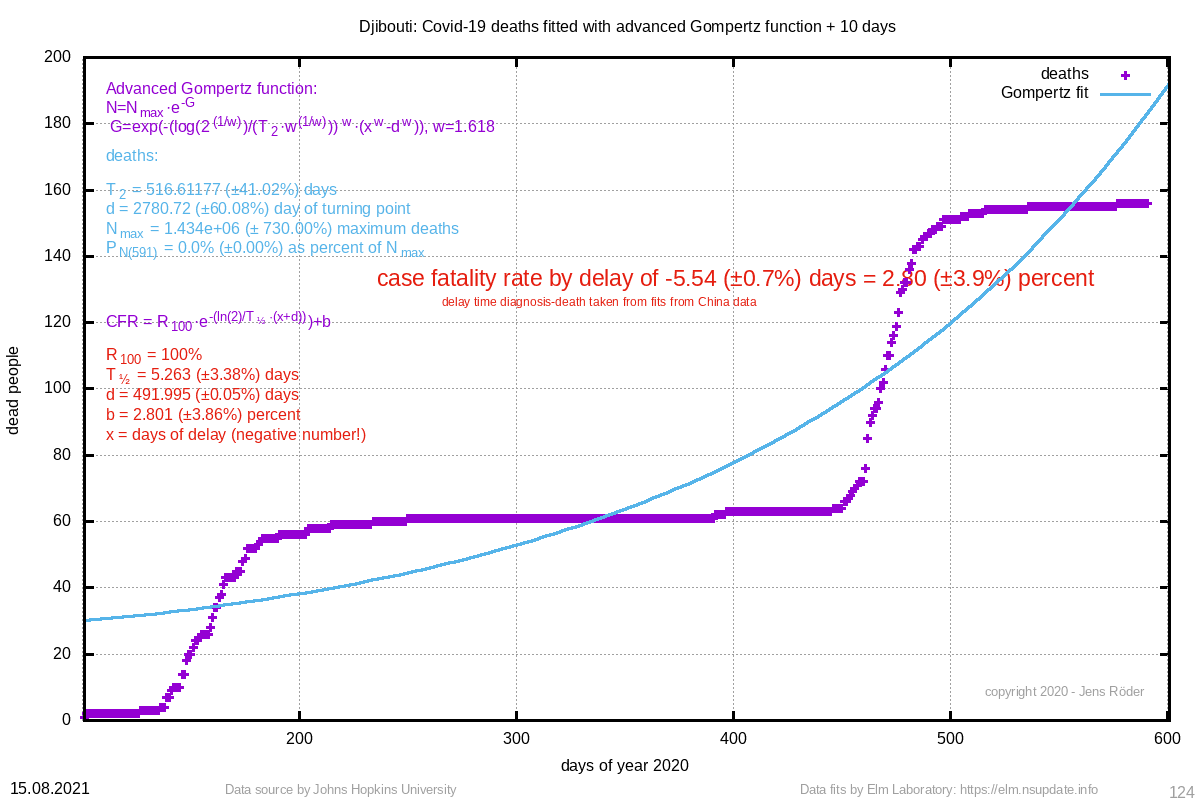 | Djibouti | 2.80 (±3.9%) | 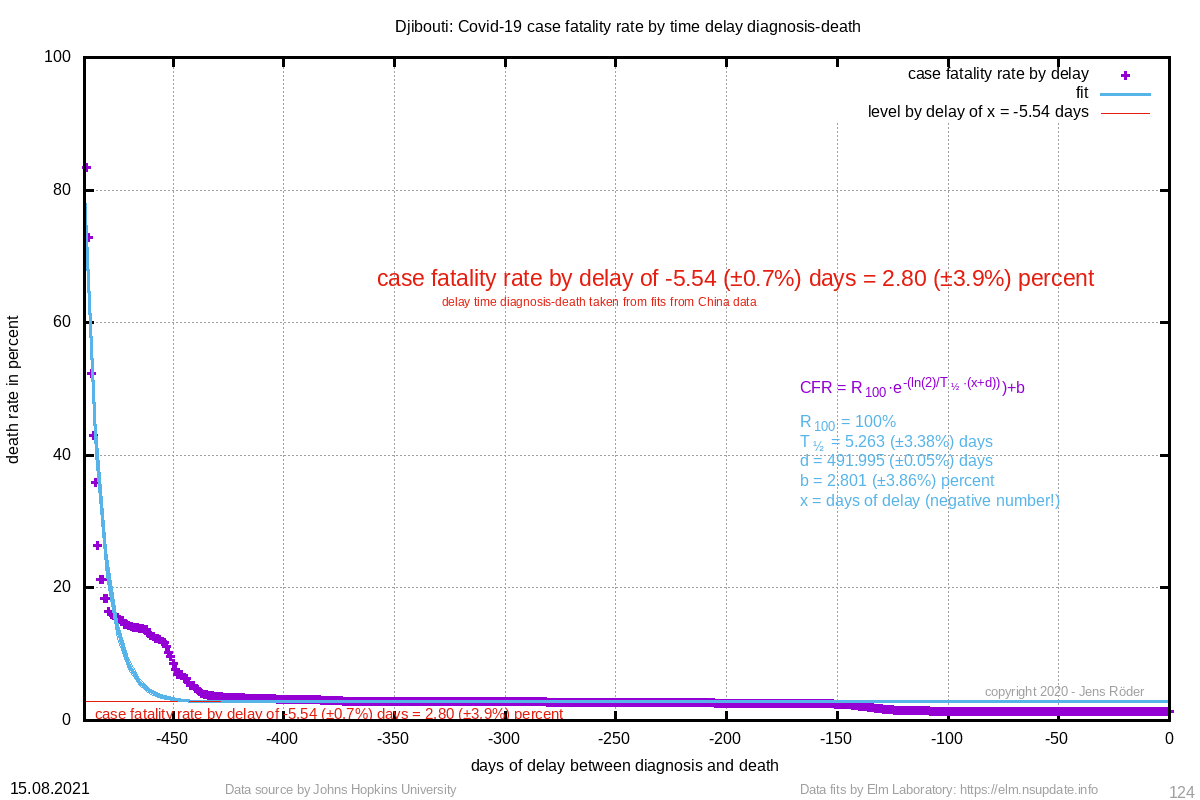 | 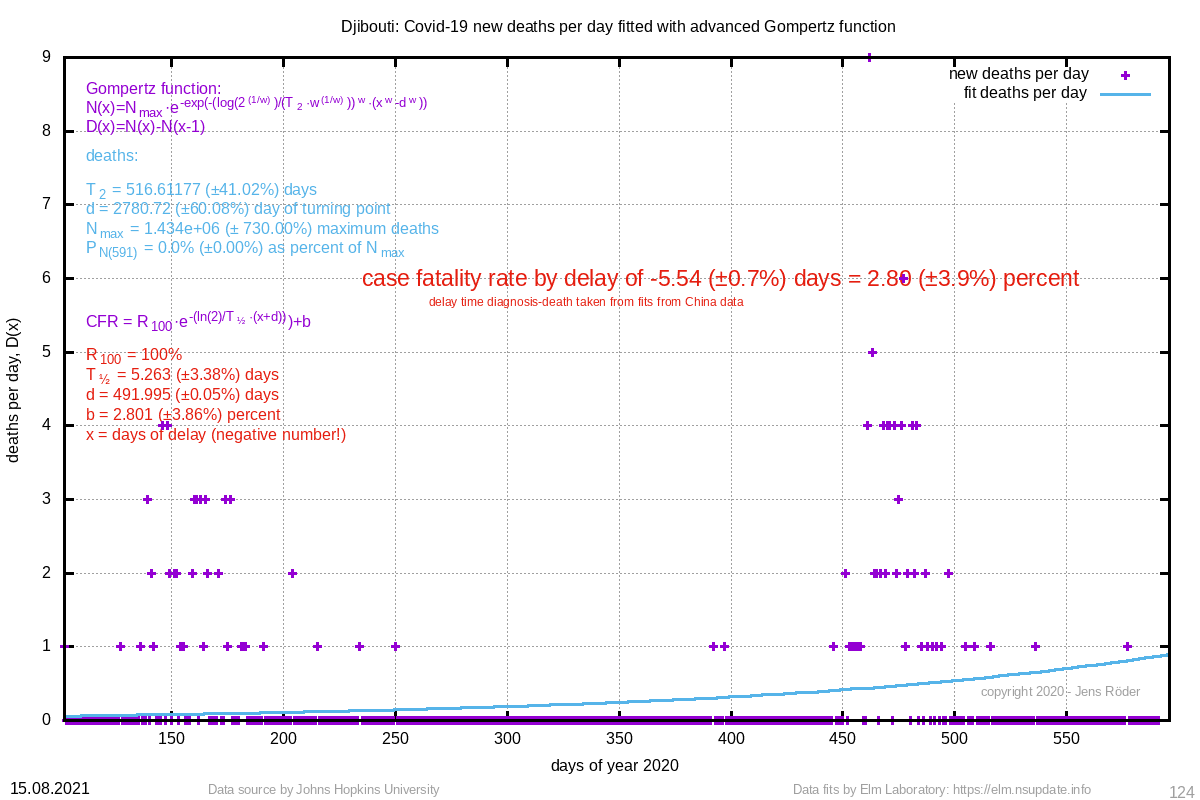 | 516.612 (±41.0%) | 2780.72 (±60.1%) |
| 129 | 157 (±2.0%) | 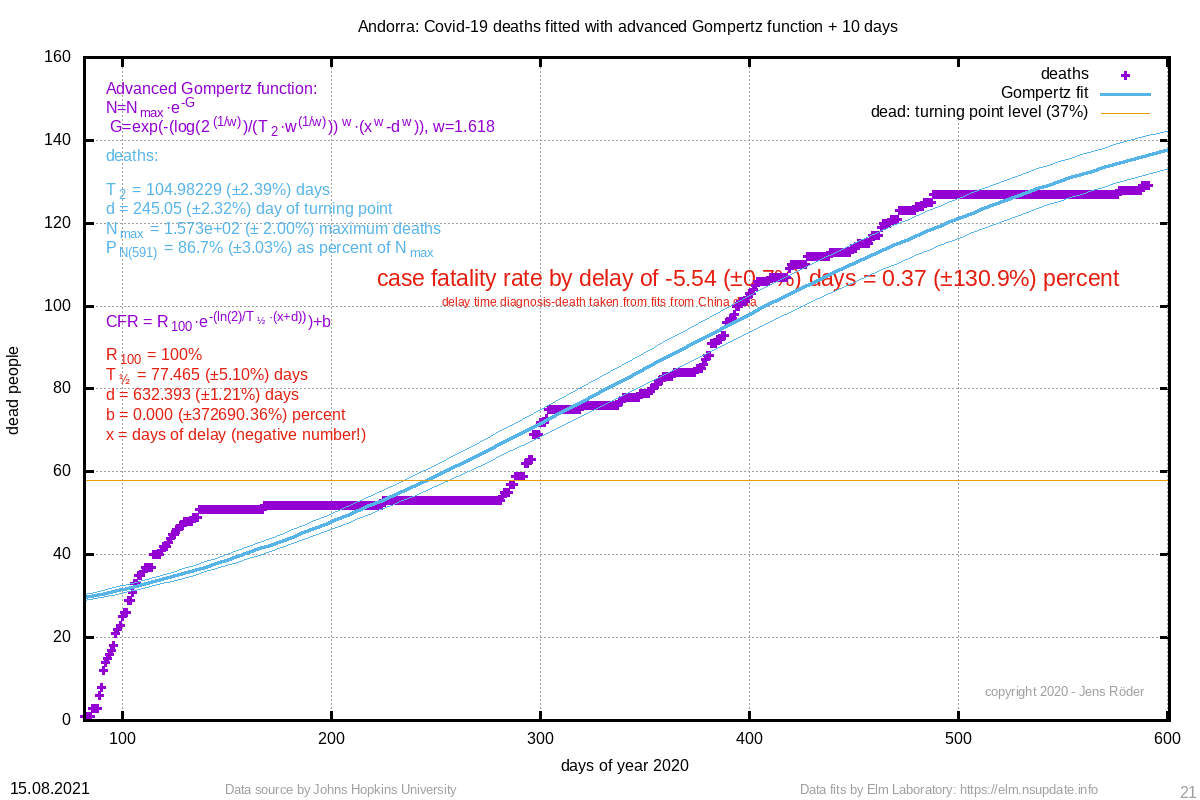 | Andorra | 0.37 (±130.9%) | 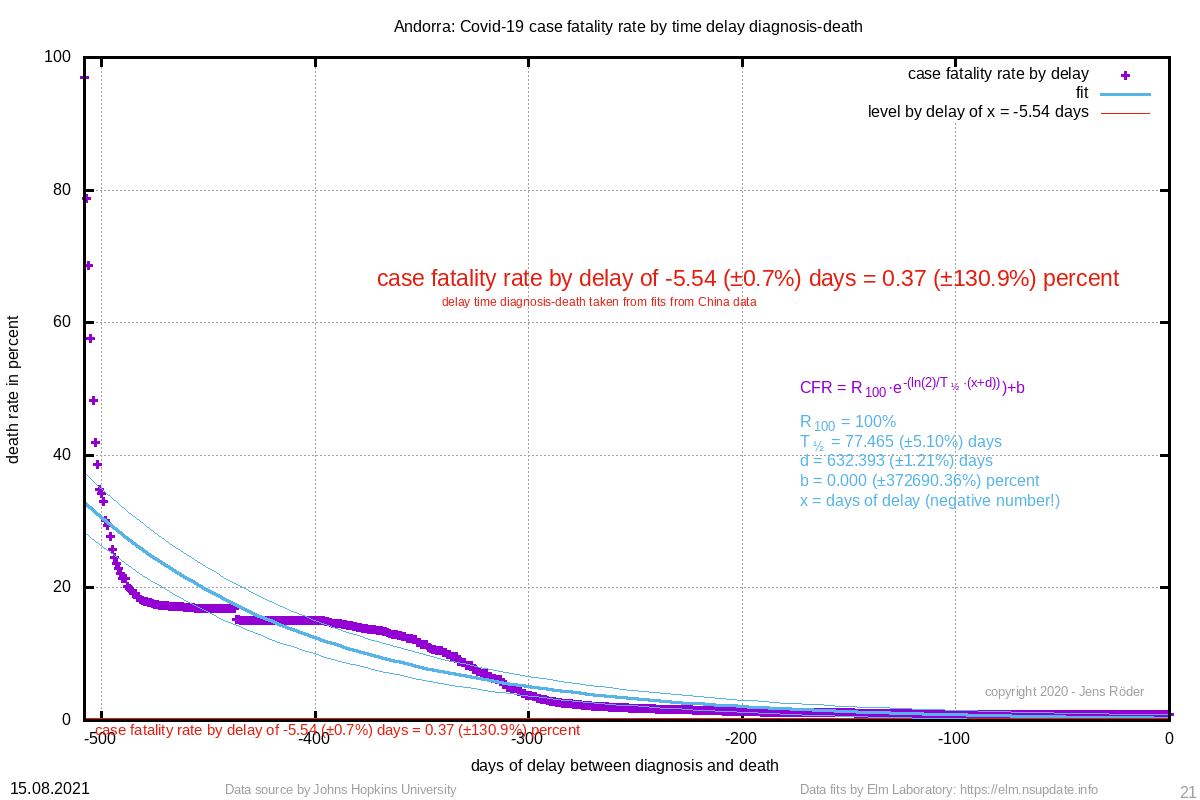 | 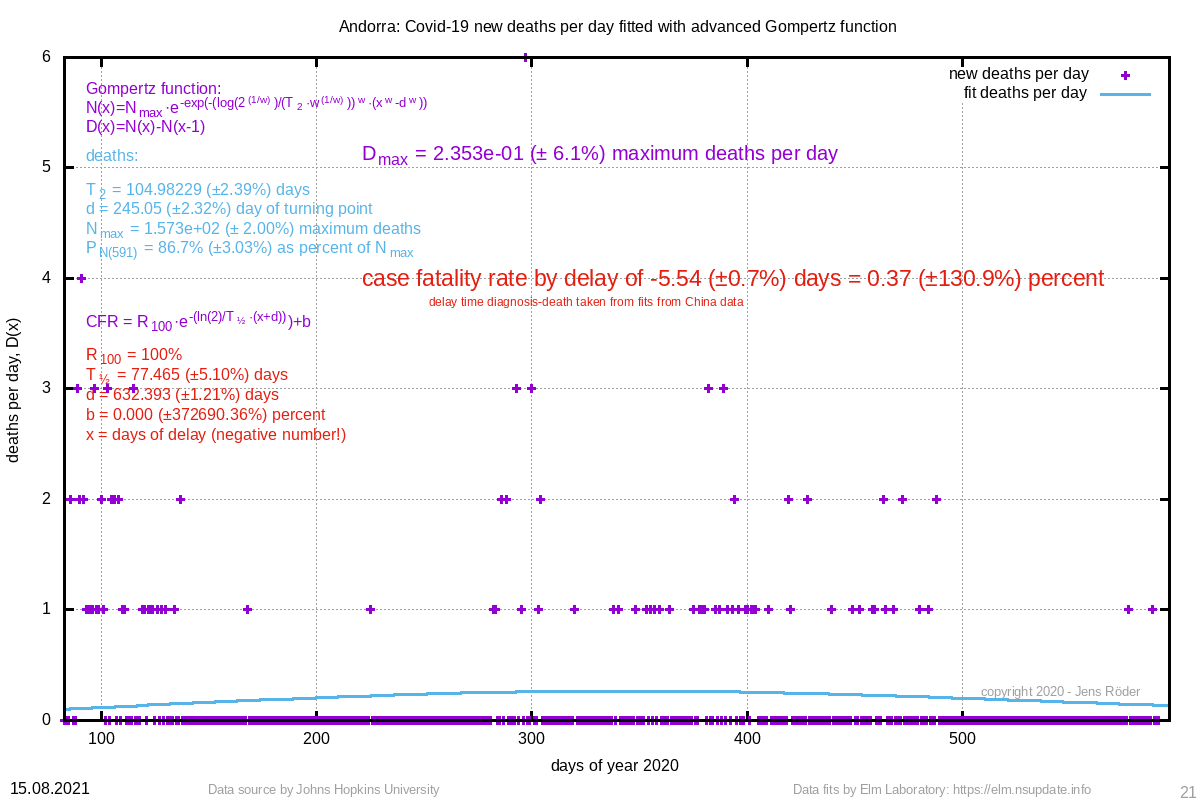 | 104.982 (±2.4%) | 245.05 (±2.3%) |
| 123 | 103 (±0.8%) | 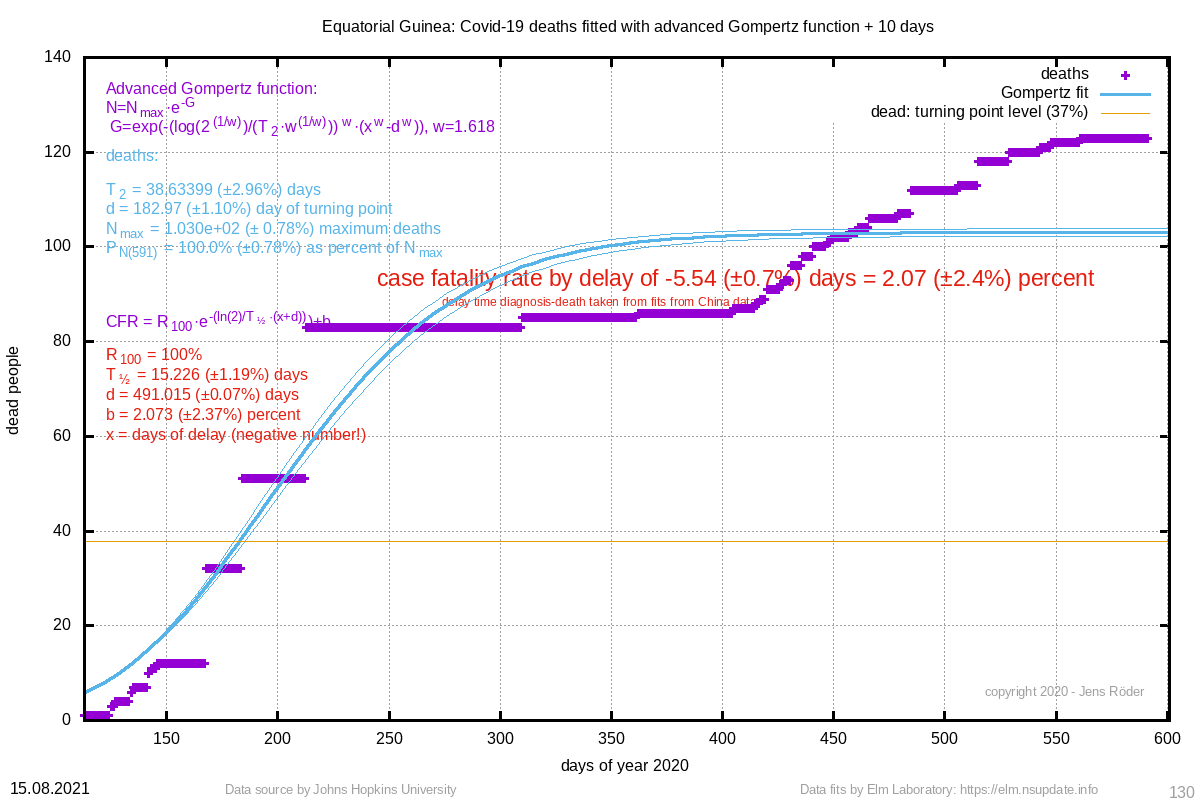 | Equatorial Guinea | 2.07 (±2.4%) | 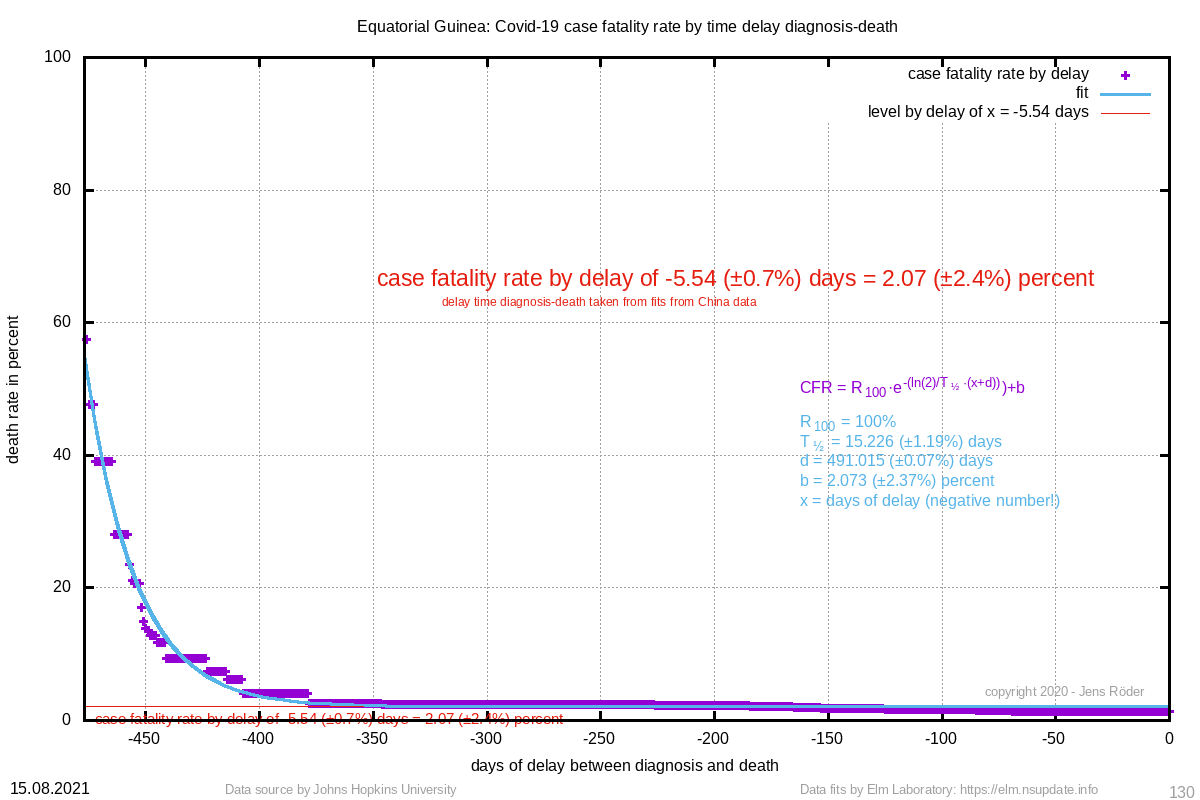 | 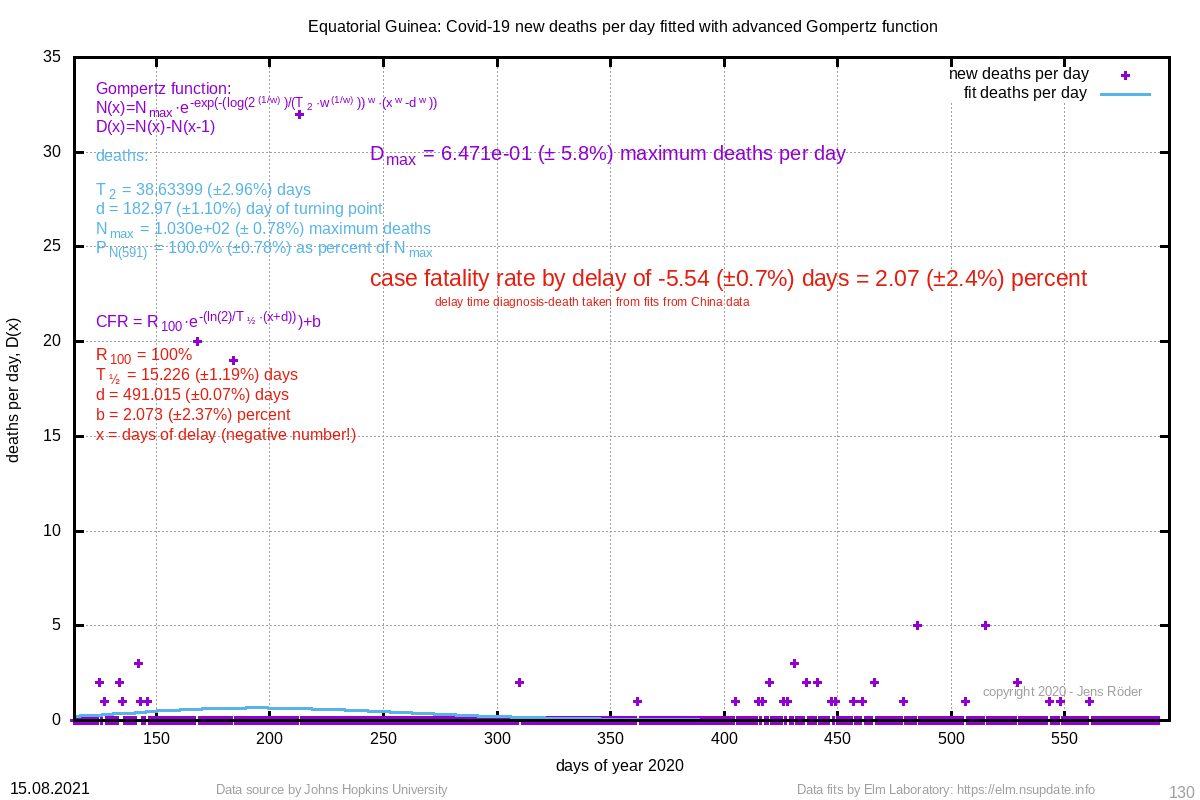 | 38.634 (±3.0%) | 182.97 (±1.1%) |
| 113 | 147 (±3.6%) | 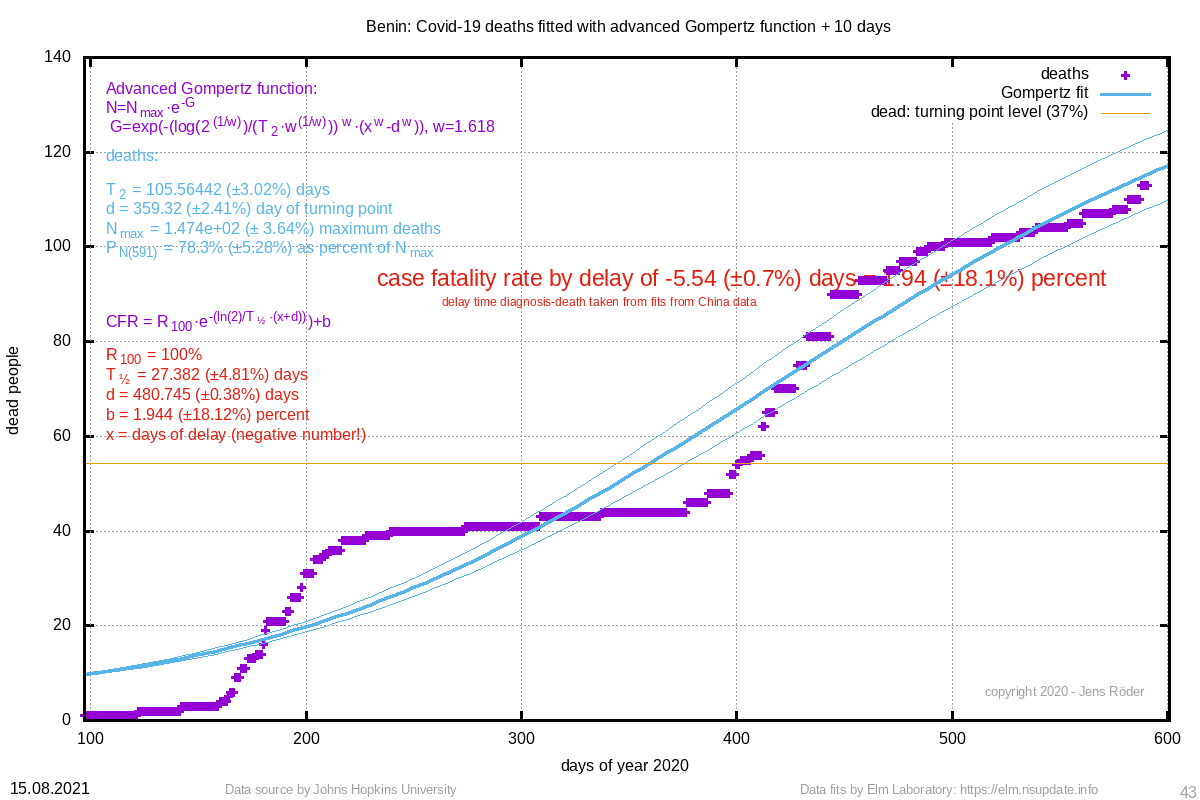 | Benin | 1.94 (±18.1%) | 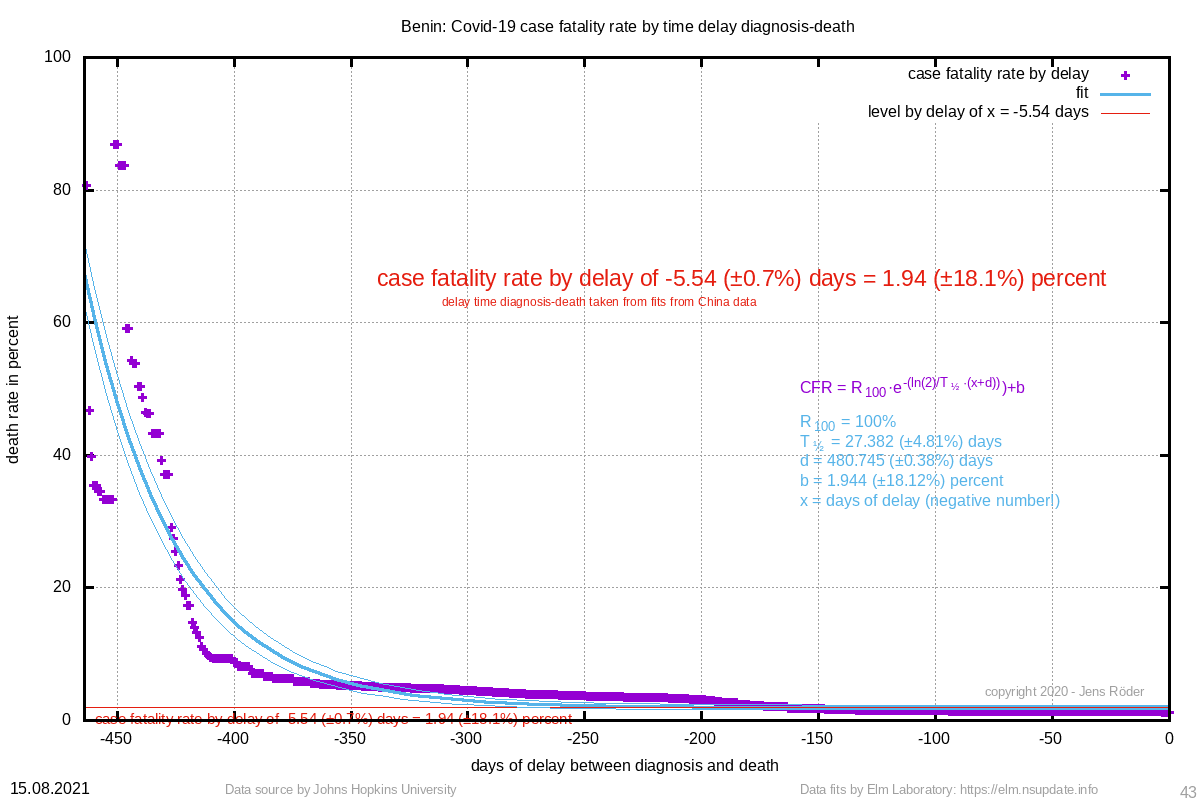 | 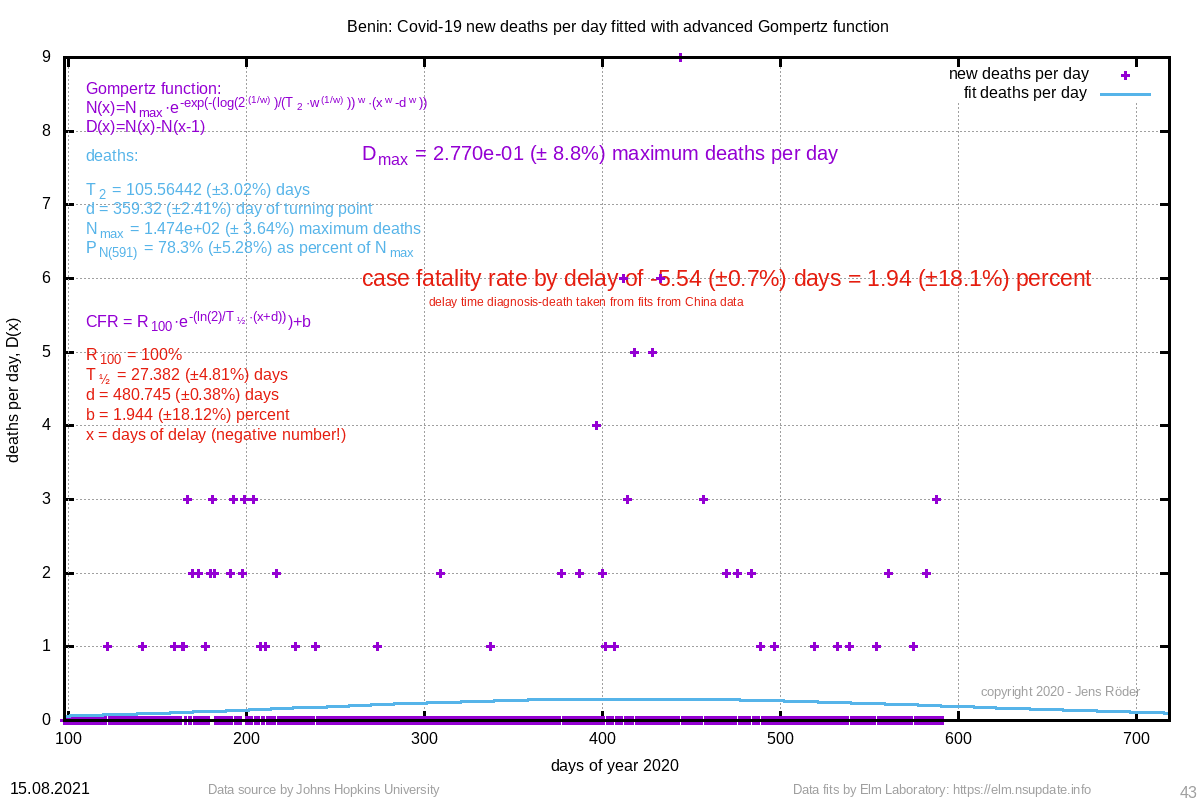 | 105.564 (±3.0%) | 359.32 (±2.4%) |
| 98 | 140 (±11.8%) | 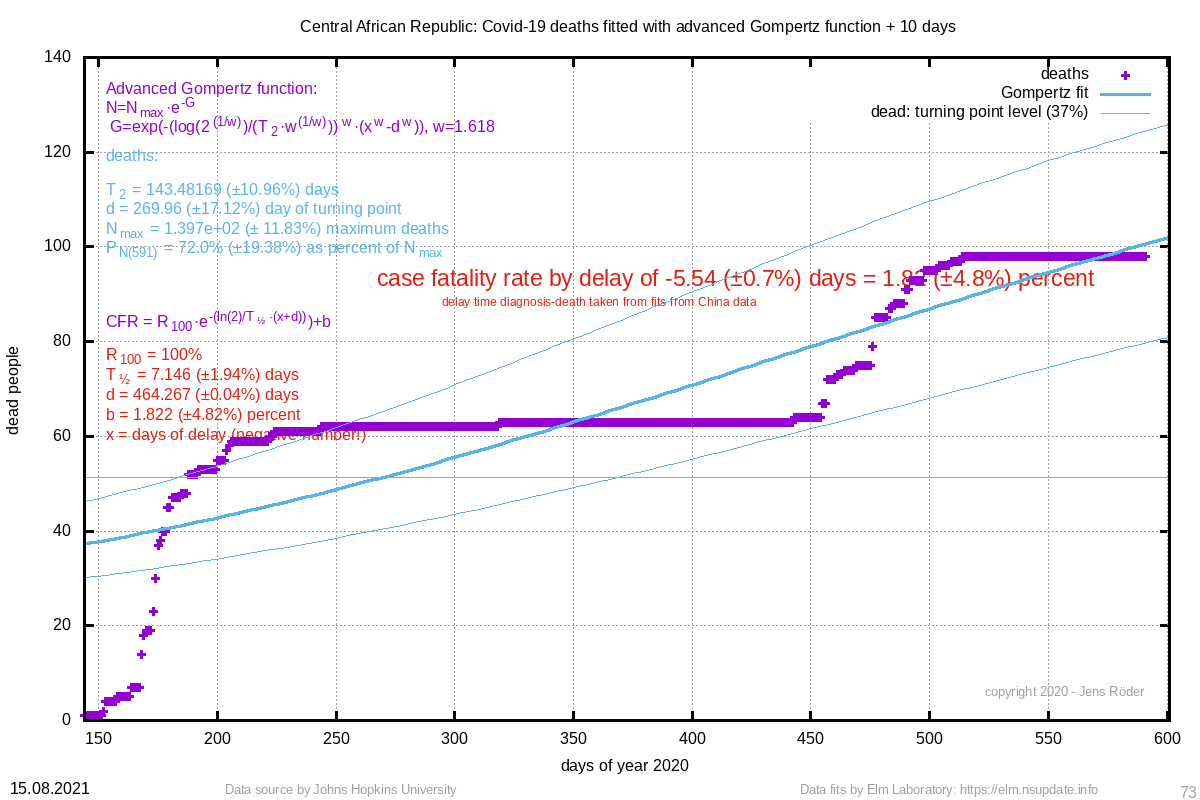 | Central African Republic | 1.82 (±4.8%) | 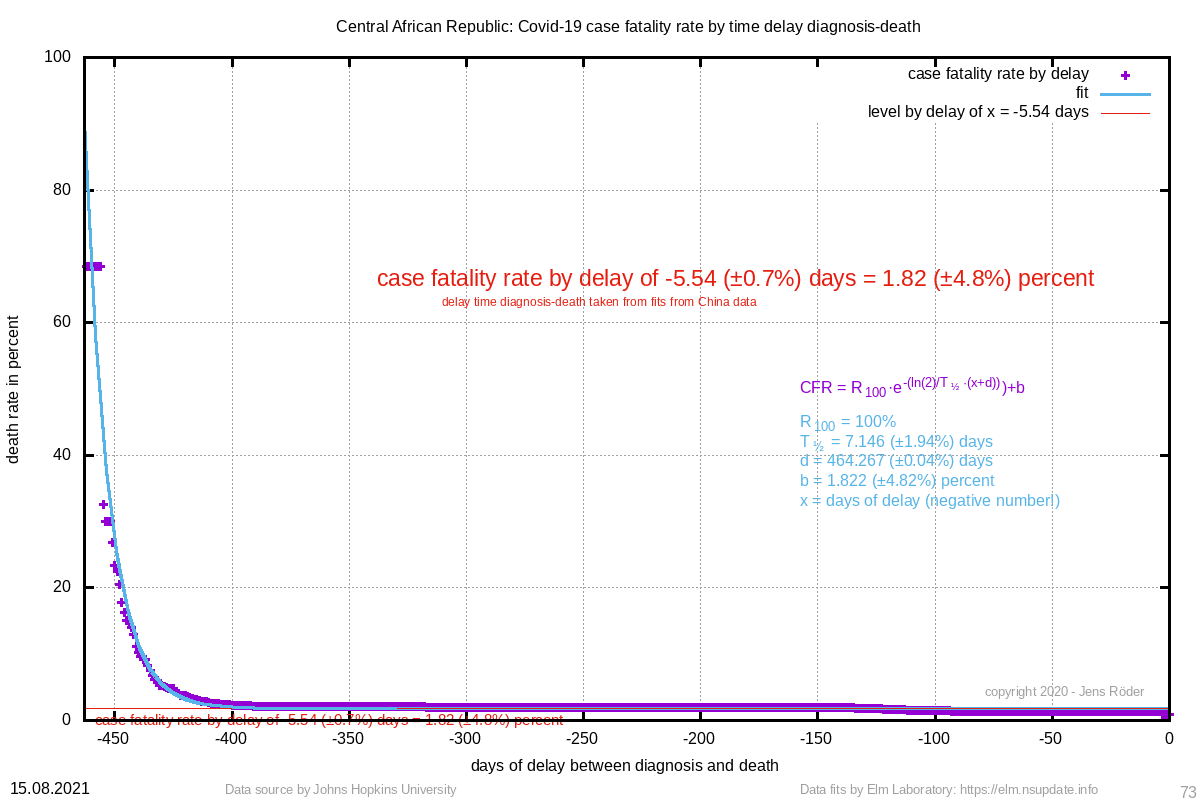 | 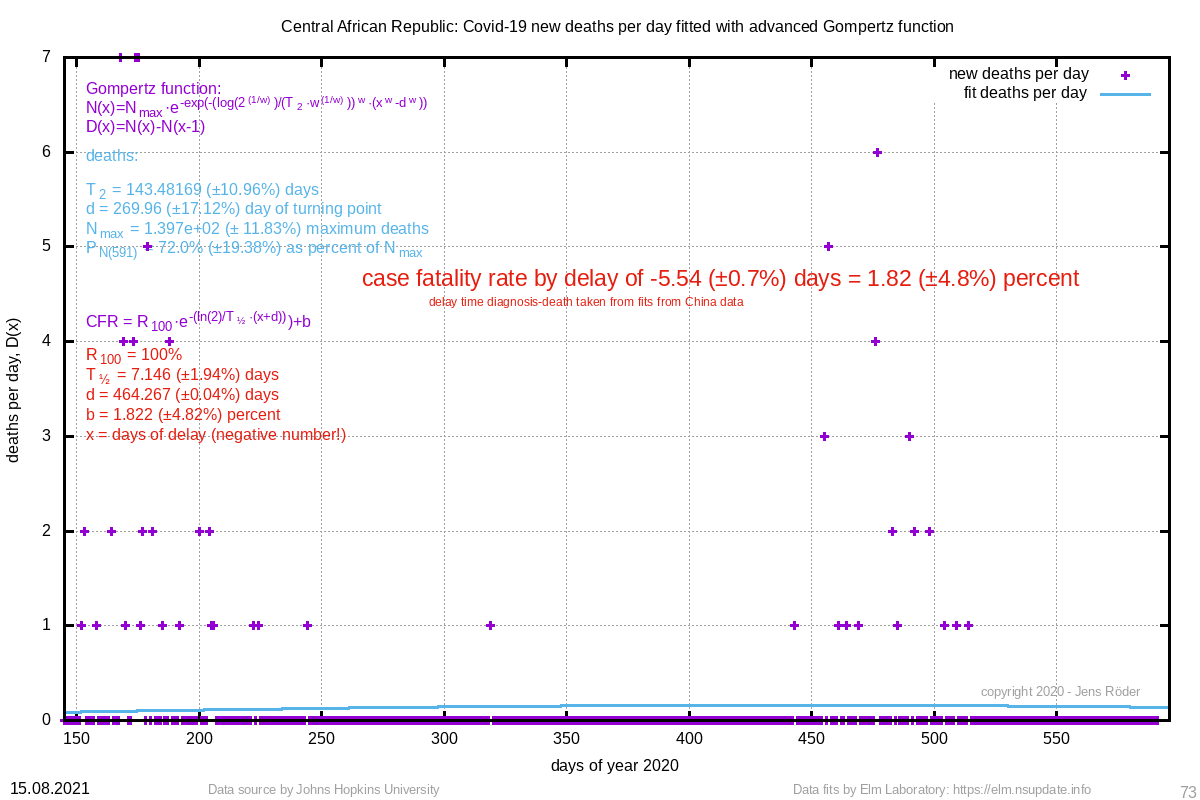 | 143.482 (±11.0%) | 269.96 (±17.1%) |
| 97 | 54 (±0.5%) | 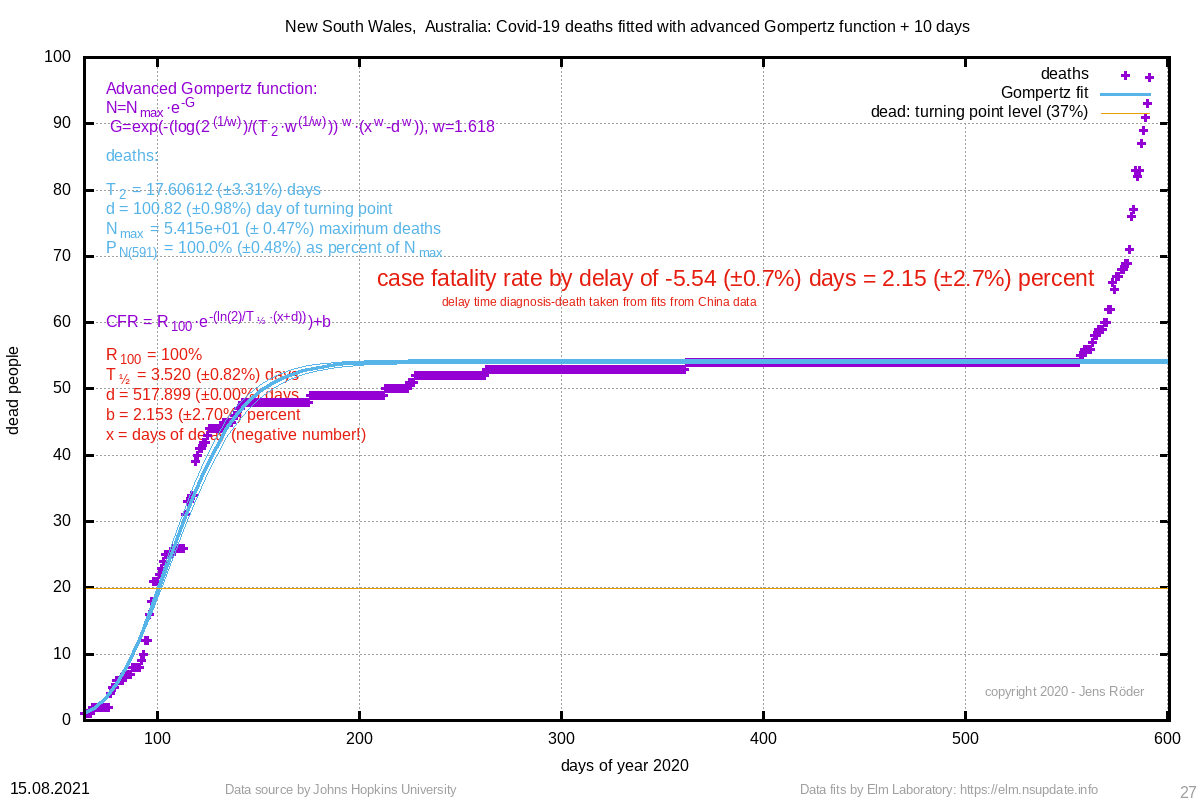 | New South Wales, Australia | 2.15 (±2.7%) | 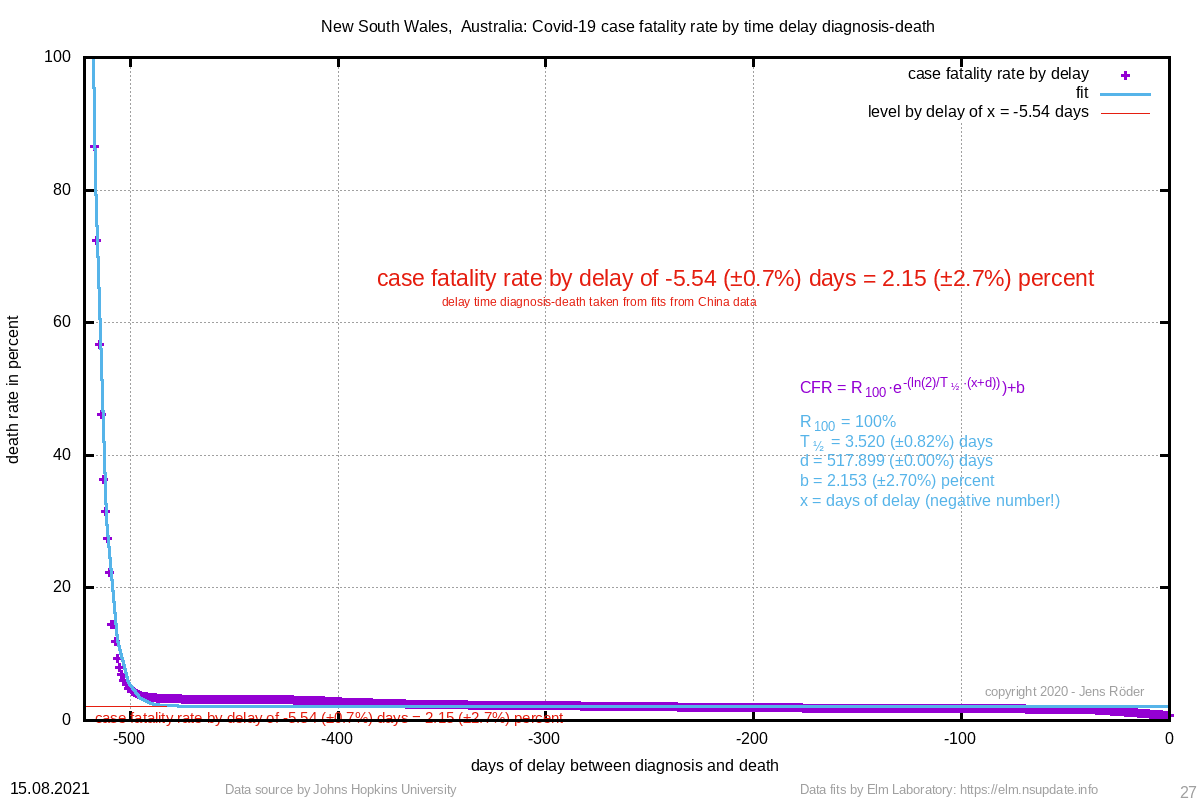 |  | 17.606 (±3.3%) | 100.82 (±1.0%) |
| 95 | 88 (±0.4%) | 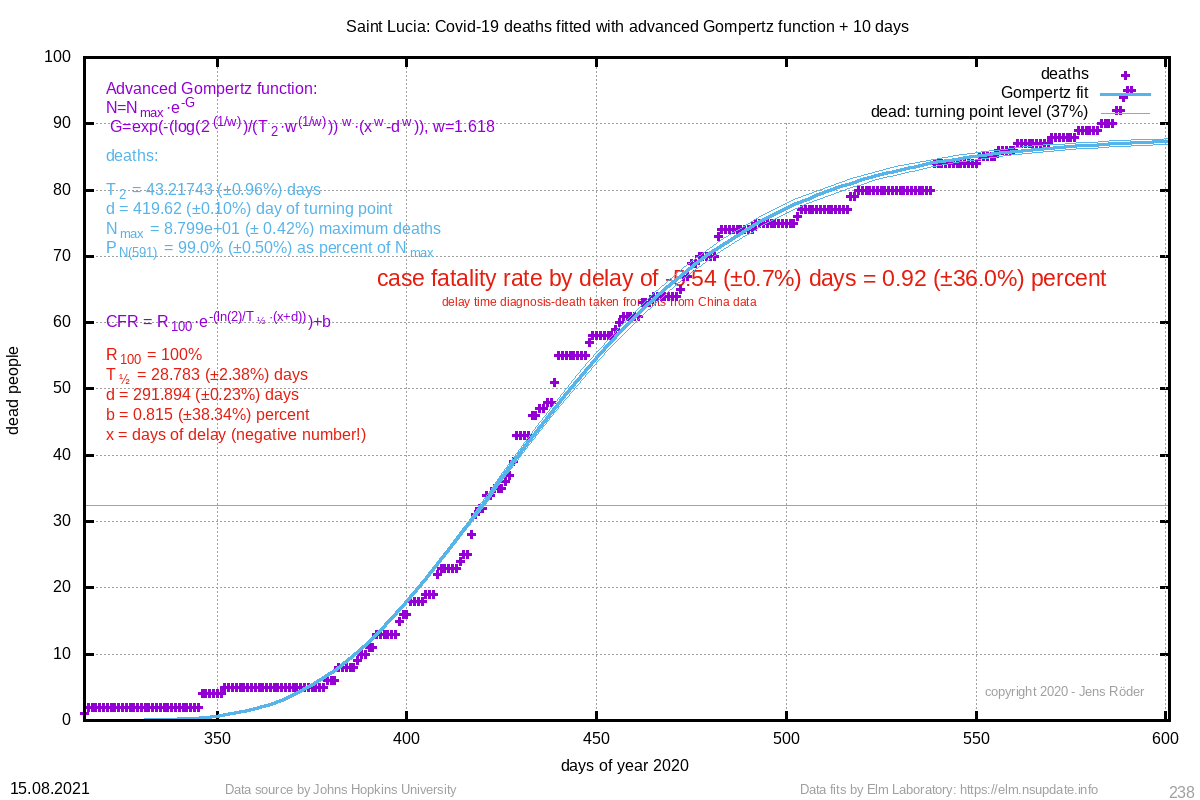 | Saint Lucia | 0.92 (±36.0%) | 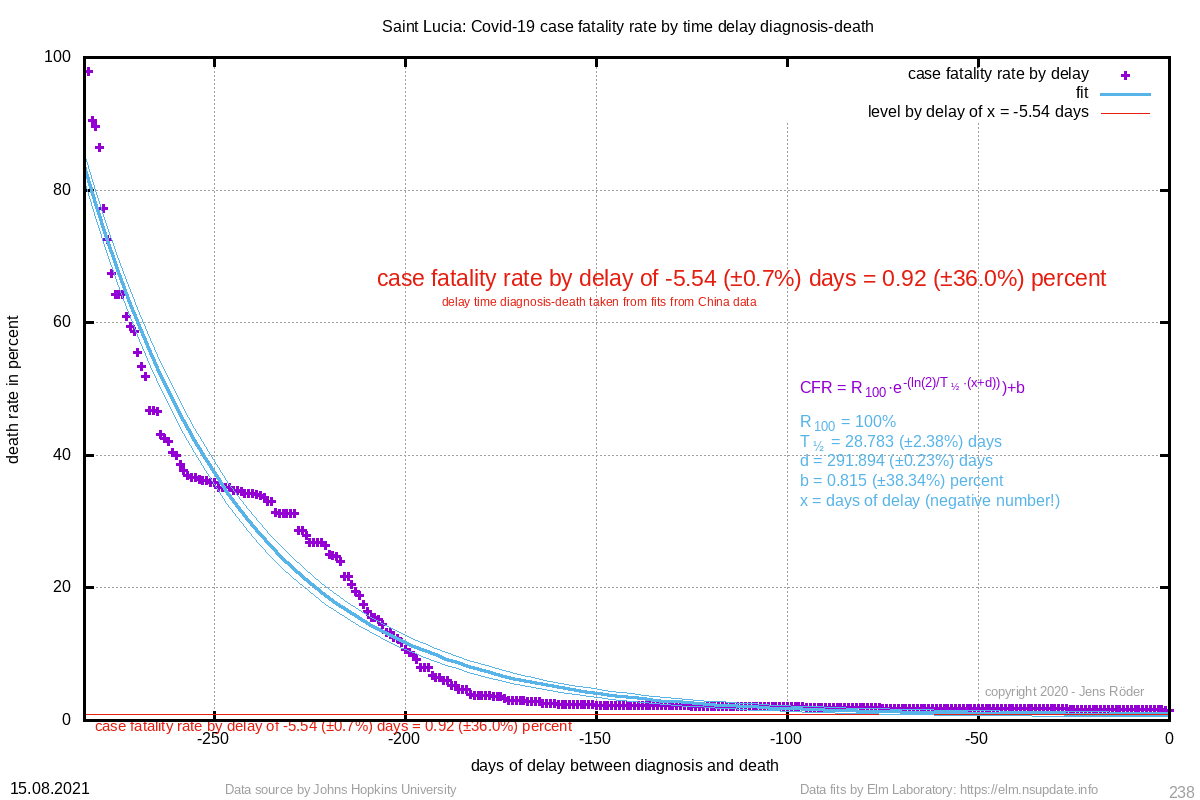 |  | 43.217 (±1.0%) | 419.62 (±0.1%) |
| 93 | 70 (±0.7%) |  | Nova Scotia, Canada | 6.22 (±2.0%) |  | 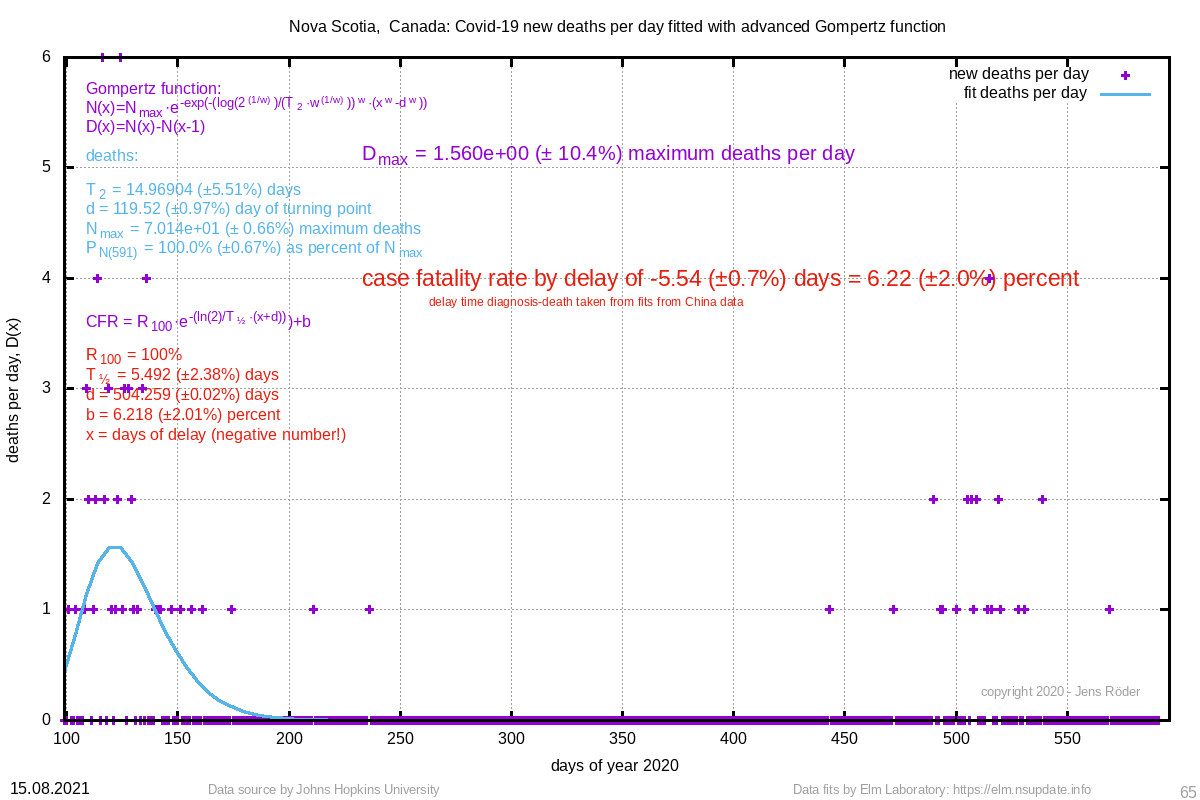 | 14.969 (±5.5%) | 119.52 (±1.0%) |
| 89 | 81 (±2.1%) | 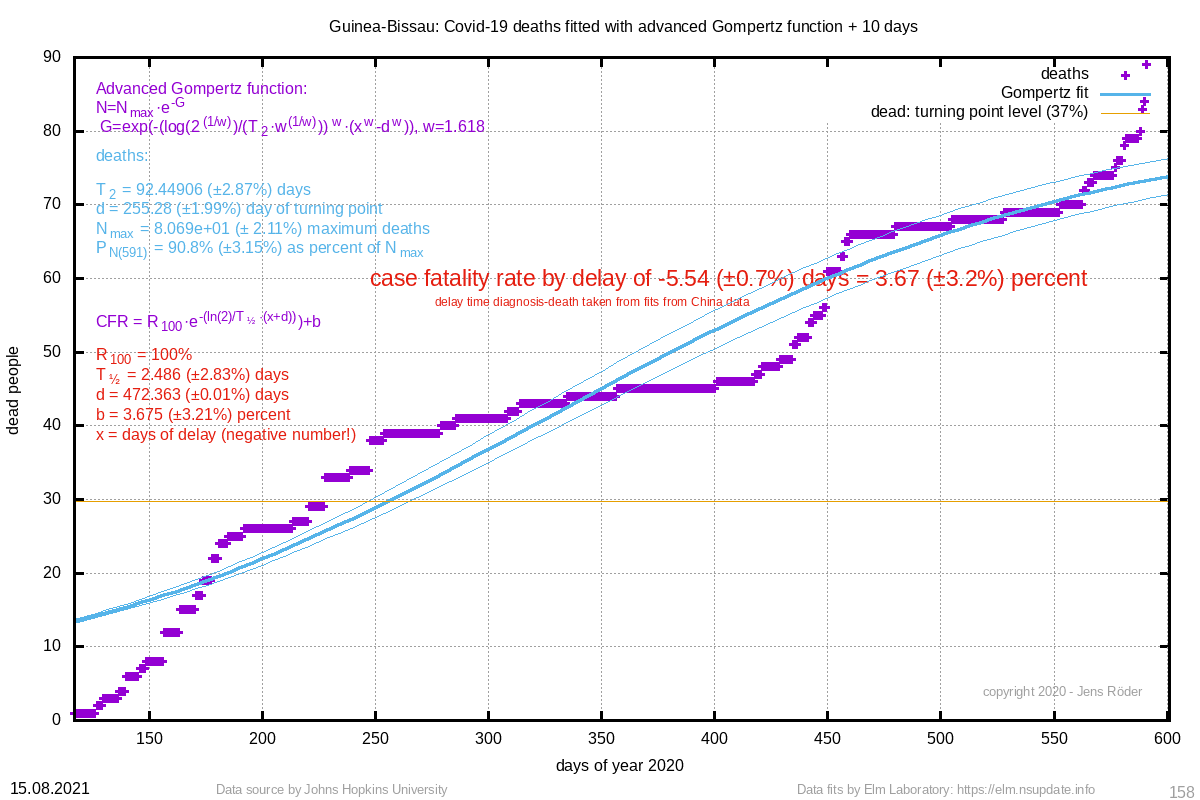 | Guinea-Bissau | 3.67 (±3.2%) | 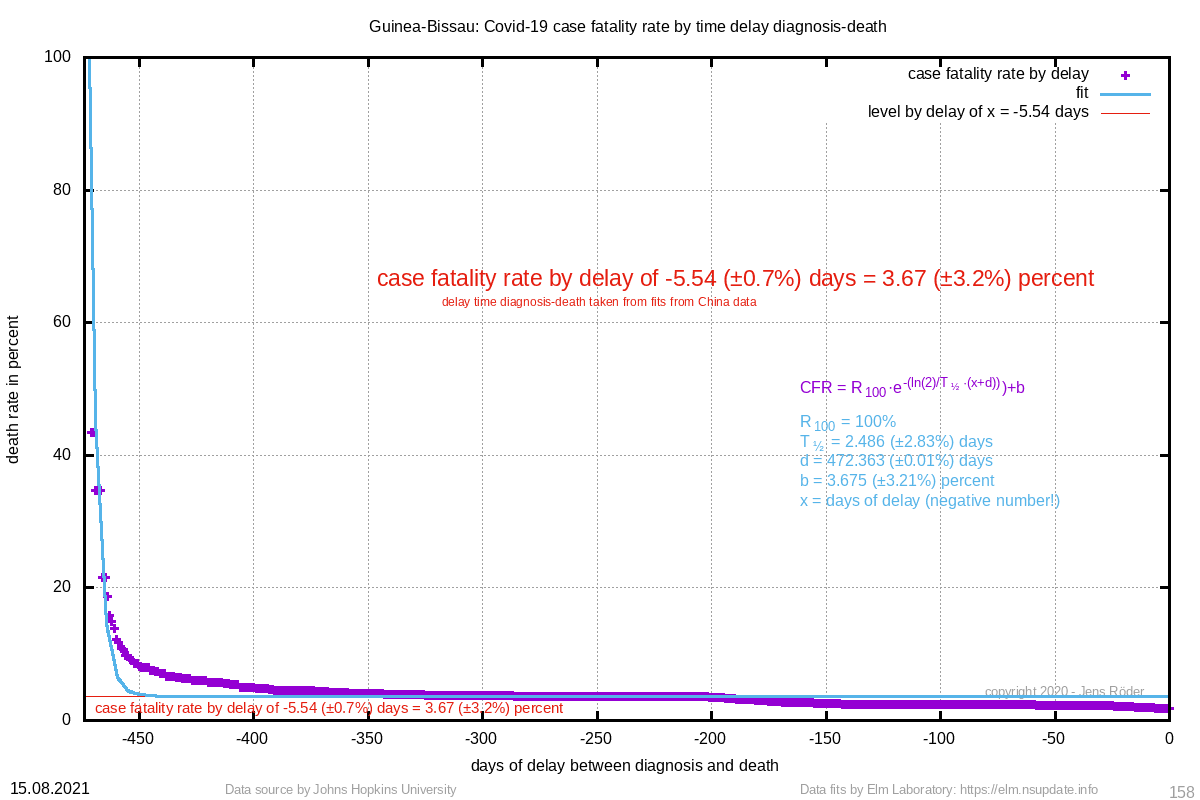 | 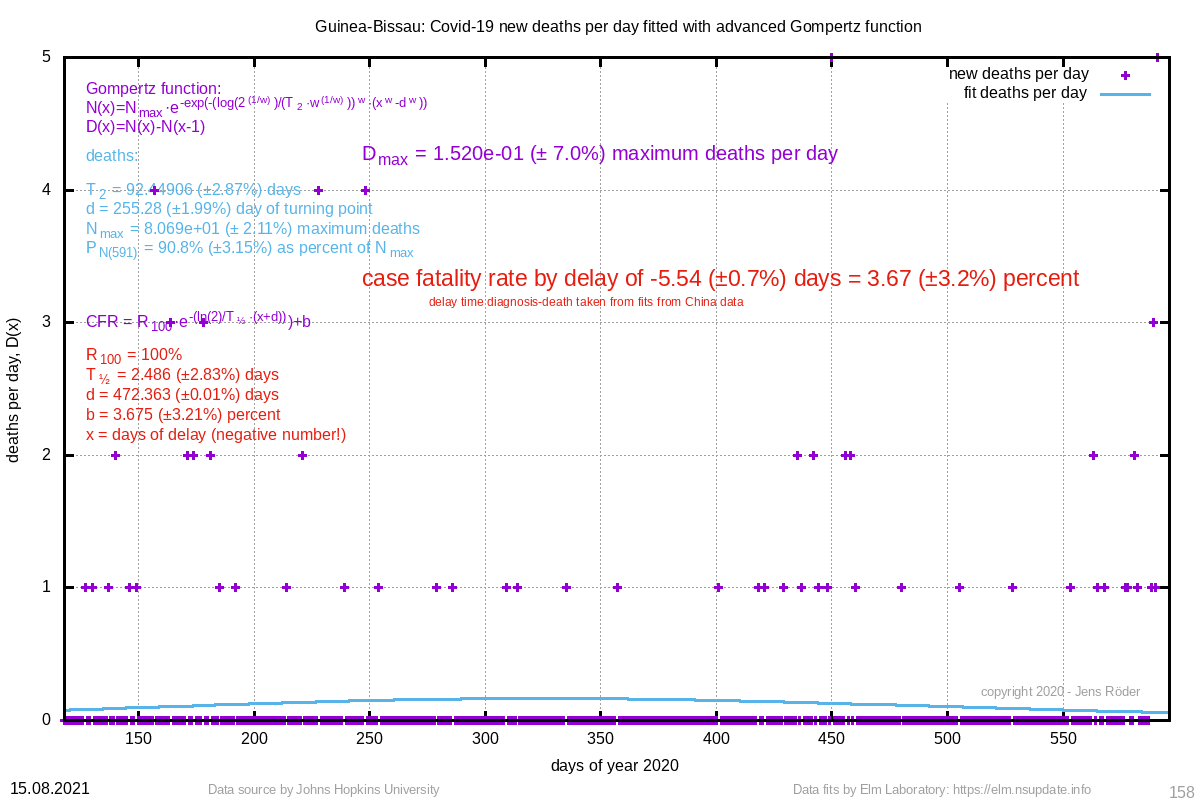 | 92.449 (±2.9%) | 255.28 (±2.0%) |
| 48 | 18193384 (±1116.0%) | 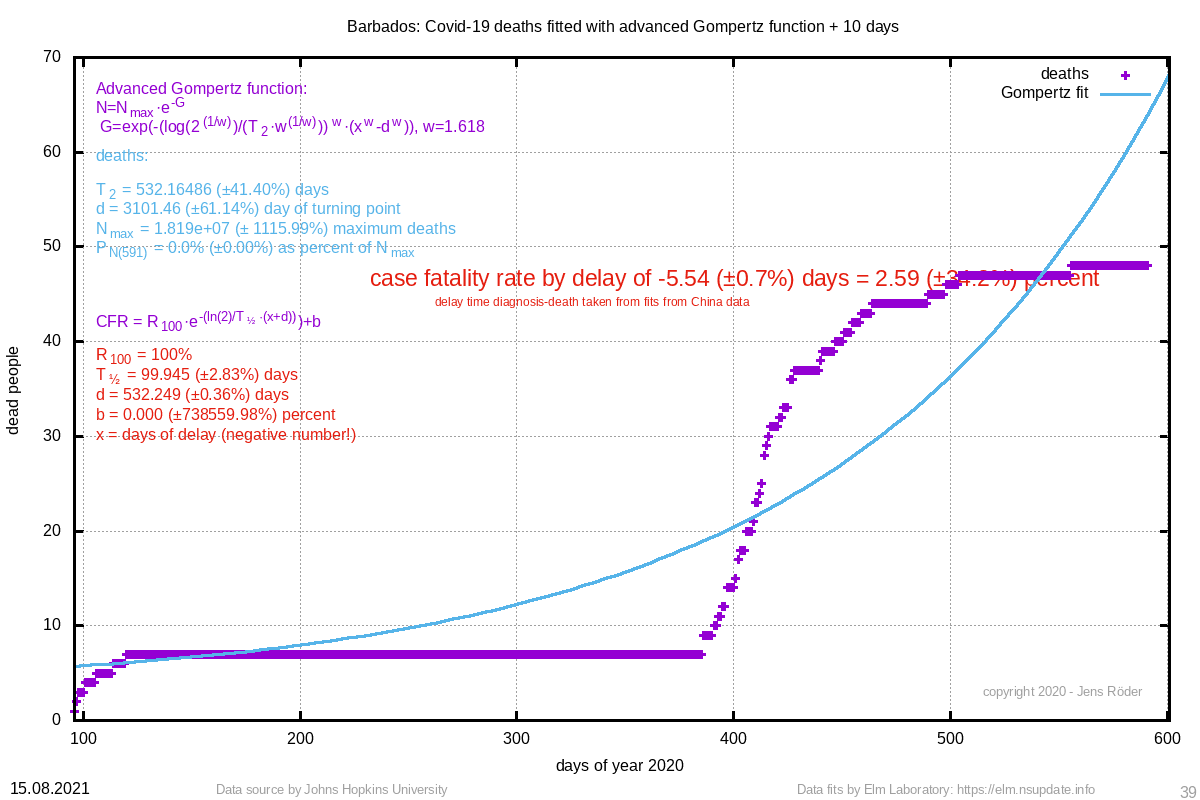 | Barbados | 2.59 (±34.2%) | 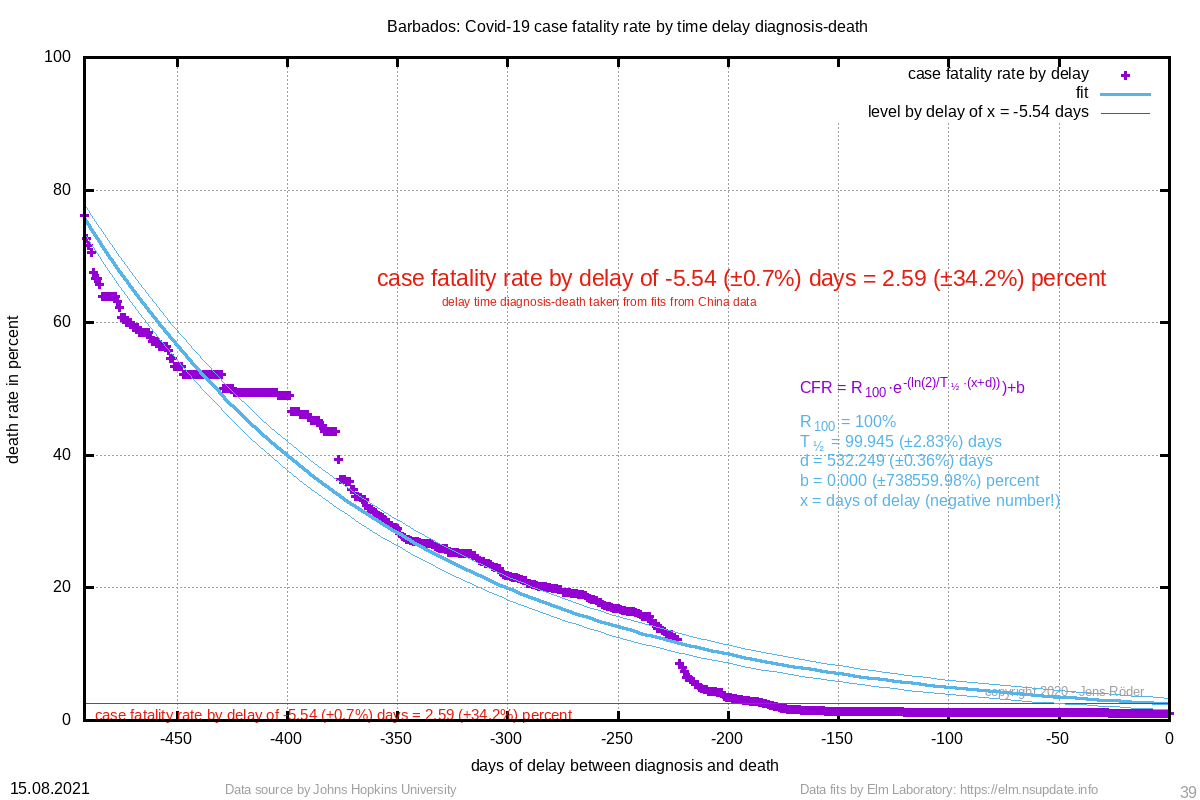 | 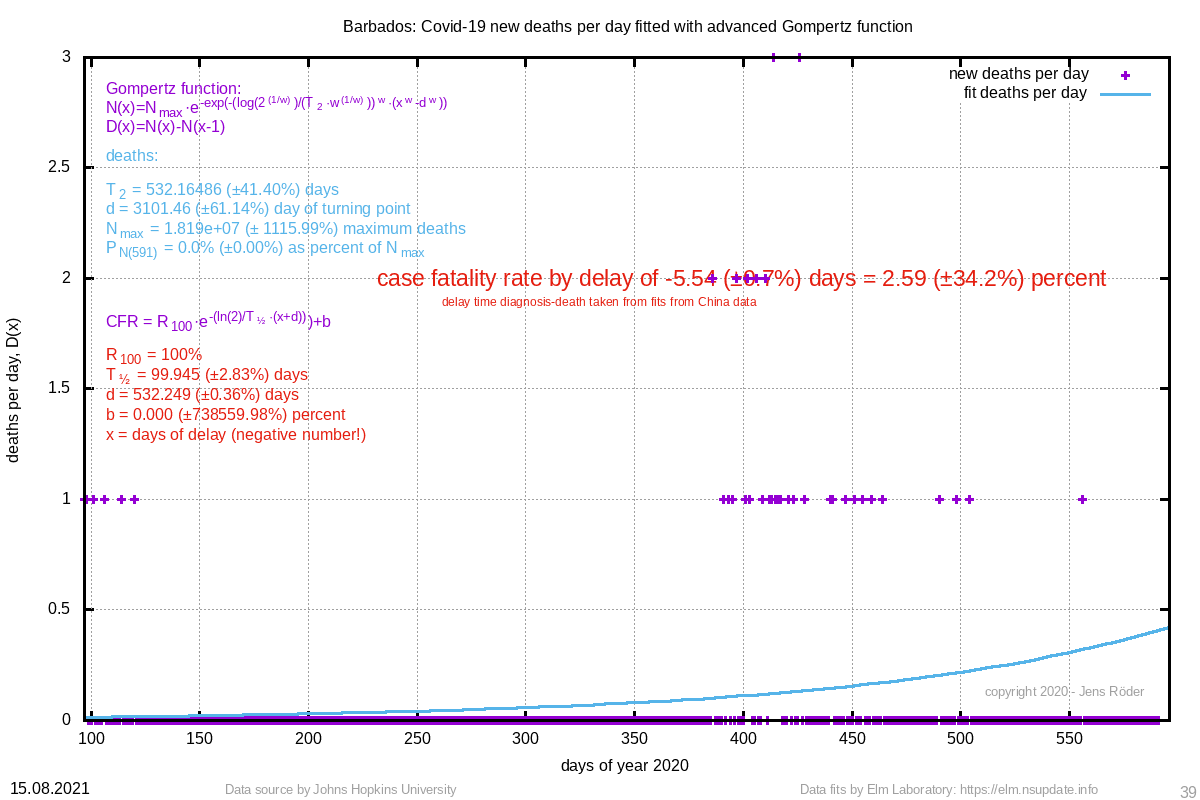 | 532.165 (±41.4%) | 3101.46 (±61.1%) |
| 46 | 52 (±1.0%) |  | New Brunswick, Canada | 2.20 (±39.9%) | 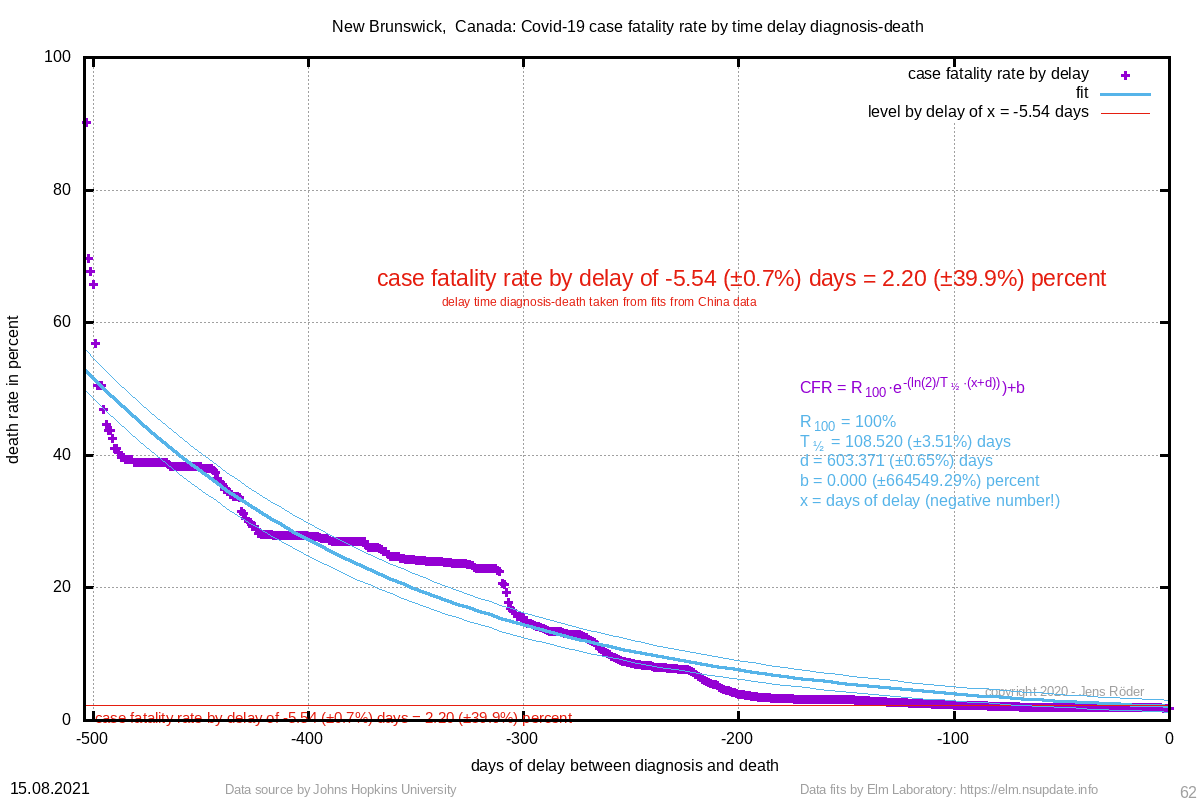 | 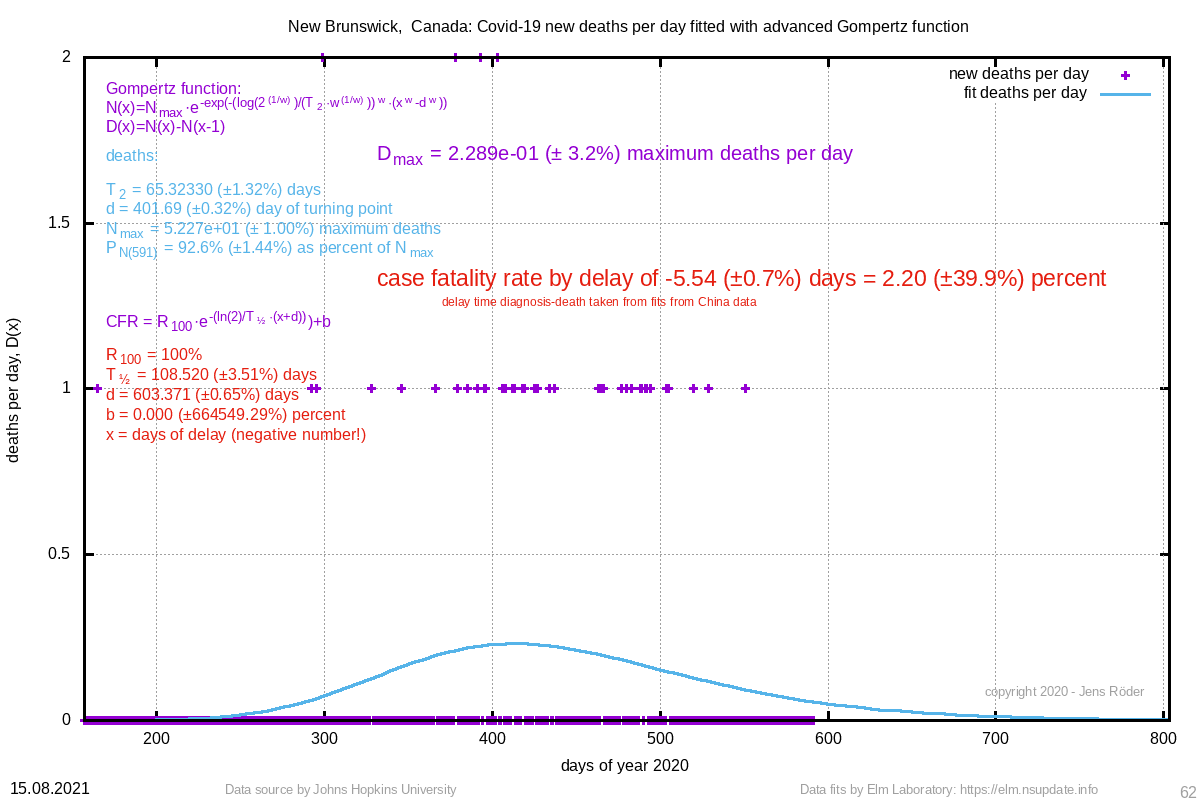 | 65.323 (±1.3%) | 401.69 (±0.3%) |
| 22 | 22 (±0.1%) | 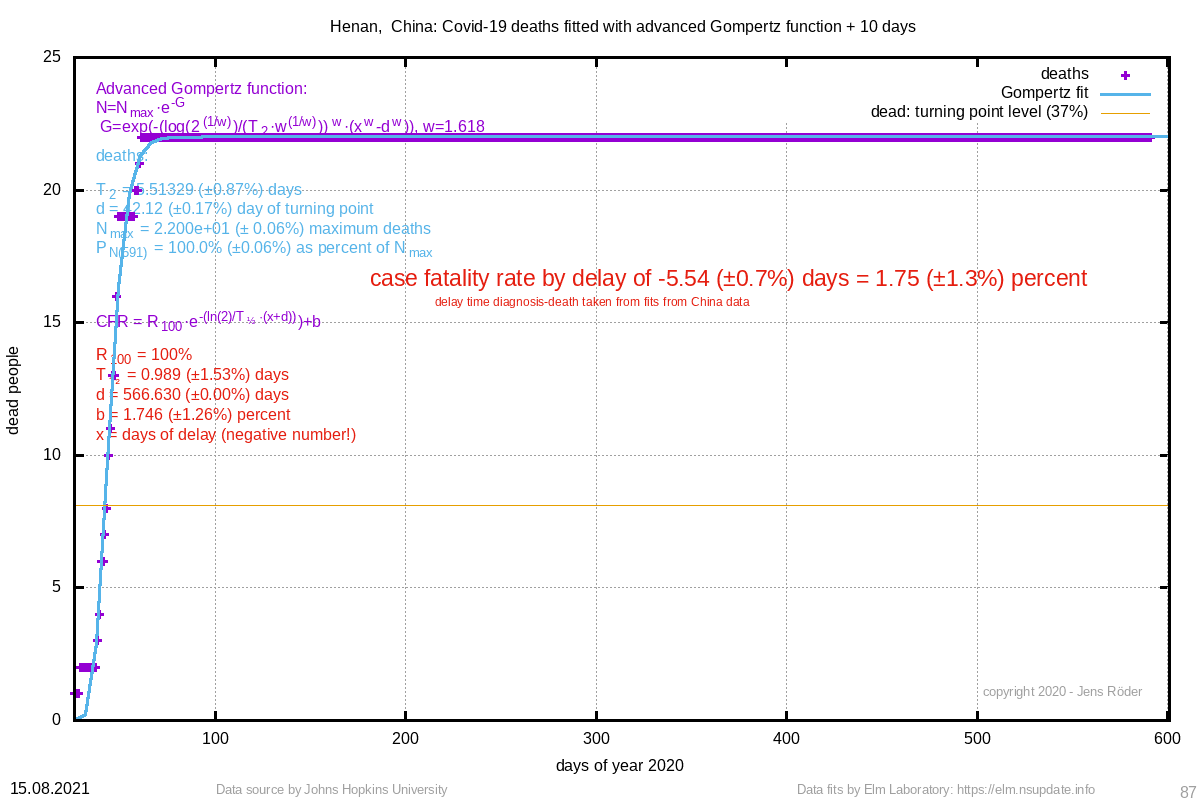 | Henan, China | 1.75 (±1.3%) | 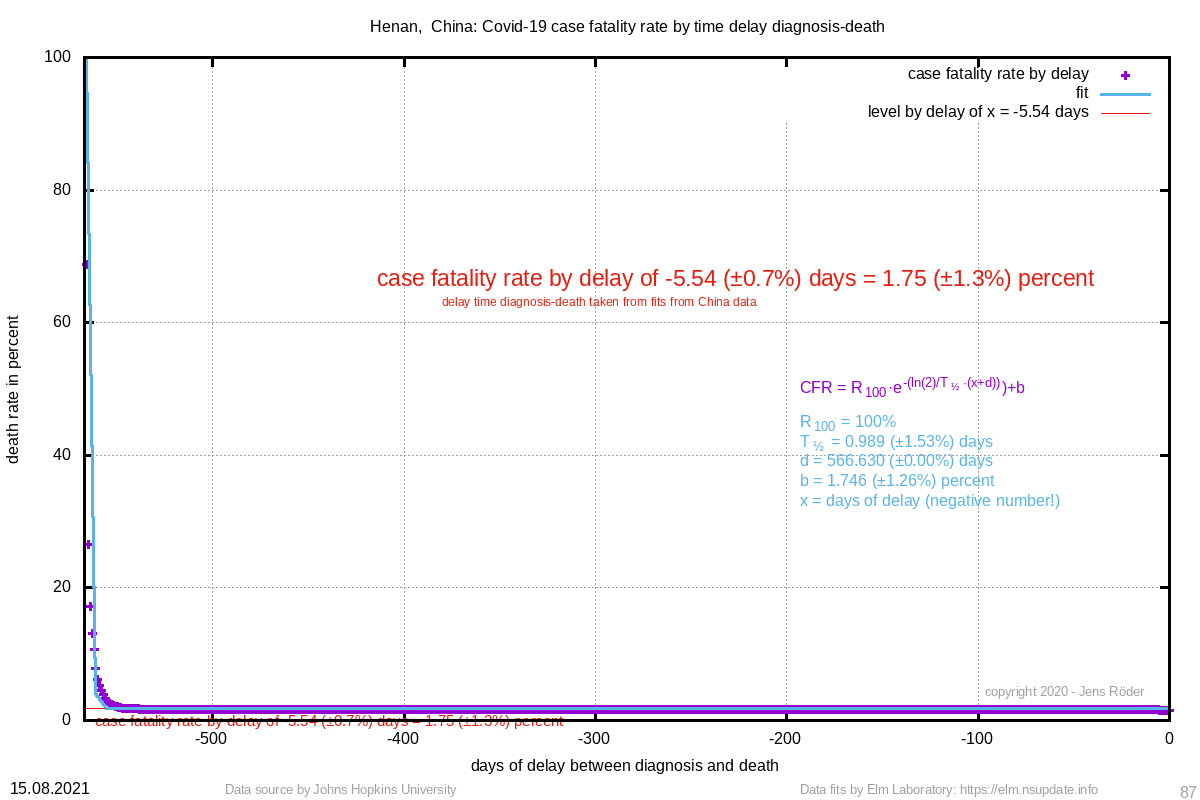 | 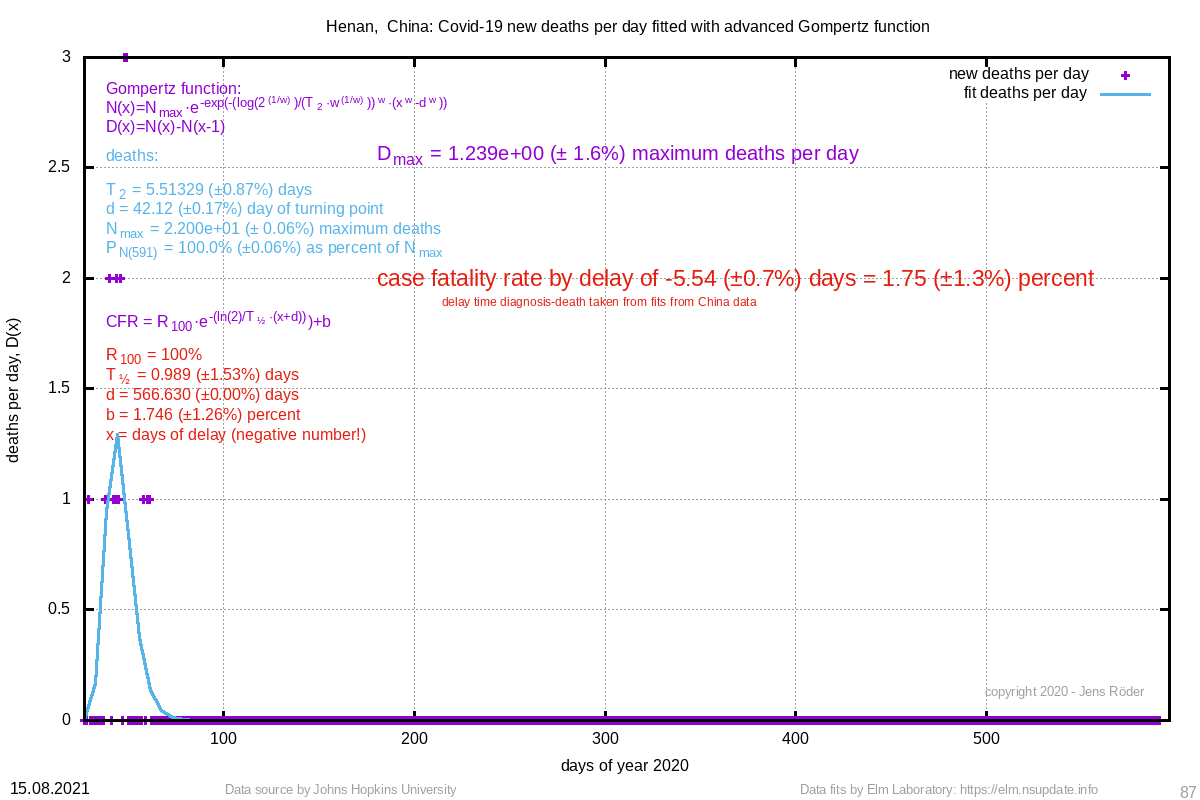 | 5.513 (±0.9%) | 42.12 (±0.2%) |
